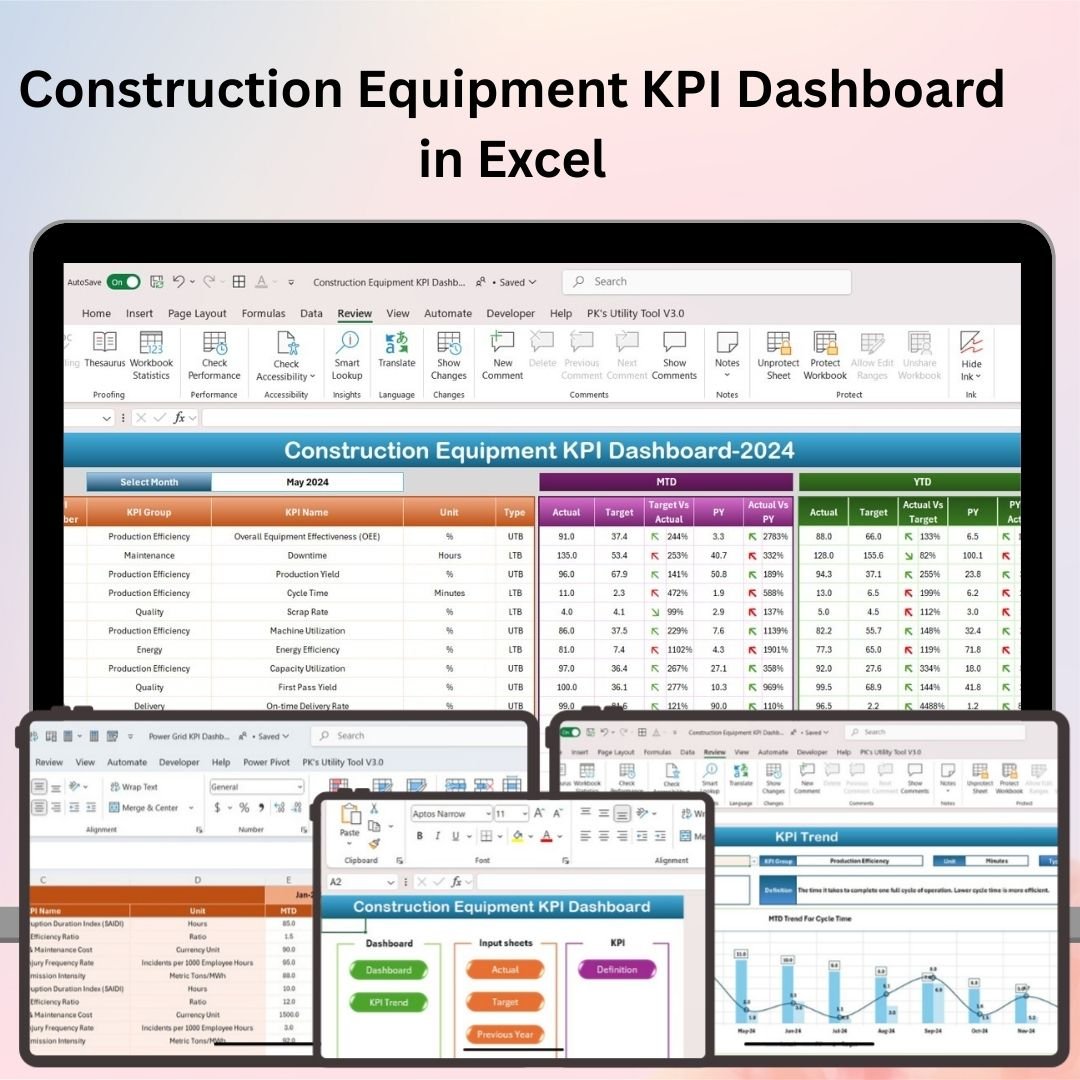
The Construction Equipment KPI Dashboard in Excel is an essential tool for construction managers, fleet operators, and project managers to monitor and optimize the performance of construction equipment. This Excel-based dashboard provides a comprehensive overview of key performance indicators (KPIs) such as equipment utilization, maintenance schedules, fuel consumption, and downtime, helping you keep your construction operations efficient and cost-effective.
With real-time tracking, customizable features, and visual performance metrics, this dashboard allows you to ensure that your equipment is operating at maximum efficiency while minimizing downtime and maintenance costs.

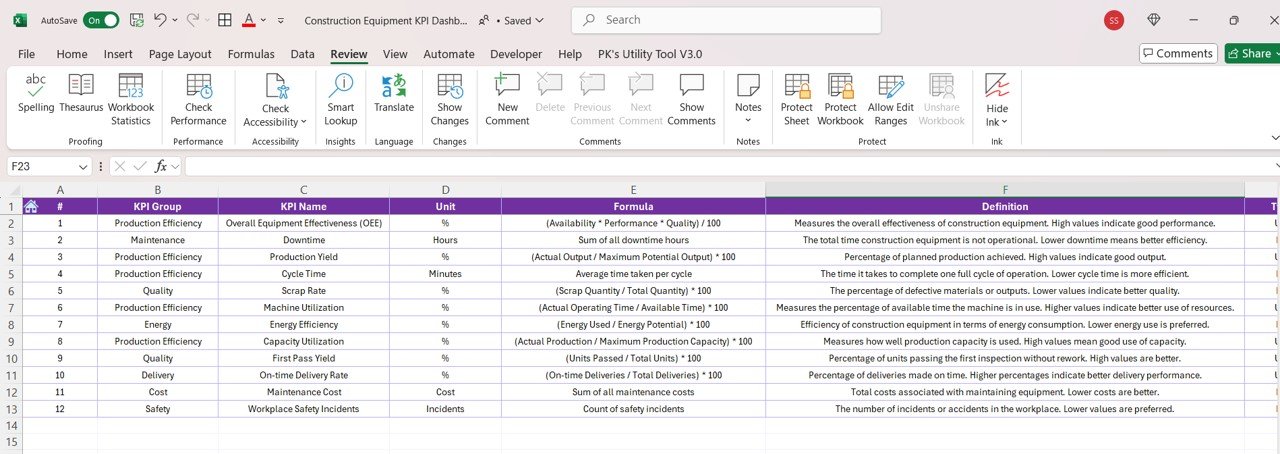
Key Features of the Construction Equipment KPI Dashboard in Excel:
🔧 Equipment Utilization Monitoring
Track the usage of construction equipment, including operating hours, idle time, and efficiency, ensuring that equipment is fully utilized and not sitting idle.
🛠️ Maintenance and Service Tracking
Monitor equipment maintenance schedules, service intervals, and repair costs, helping you avoid unexpected breakdowns and extend the lifespan of your machinery.
⛽ Fuel Consumption and Efficiency
Track fuel consumption for each piece of equipment, helping you identify areas where fuel usage can be optimized and costs can be reduced.
⚡ Downtime and Operational Performance
Monitor downtime due to maintenance, breakdowns, or other issues, allowing you to quickly address problems and minimize delays in construction projects.
📊 Cost Analysis and Budgeting
Track operational costs associated with each piece of equipment, including fuel, maintenance, repairs, and staffing, to ensure cost-effective operations and stay within budget.
🚀 Why You’ll Love the Construction Equipment KPI Dashboard in Excel:
✅ Track Equipment Utilization – Monitor the usage of equipment, ensuring maximum efficiency and reducing unnecessary idle time.
✅ Optimize Maintenance and Service – Track service intervals, repairs, and maintenance schedules to reduce unexpected downtime and repair costs.
✅ Control Fuel Costs – Track fuel consumption and identify opportunities to optimize fuel usage, reducing operational costs.
✅ Reduce Downtime – Monitor downtime due to maintenance or equipment failure, helping you take proactive steps to minimize delays in projects.
✅ Manage Operational Costs – Keep track of equipment-related costs, including fuel, maintenance, and repairs, to ensure that operations stay within budget.
✅ Fully Customizable and Interactive – Fully customizable to suit your specific construction operations, with interactive charts and real-time tracking to make data-driven decisions.
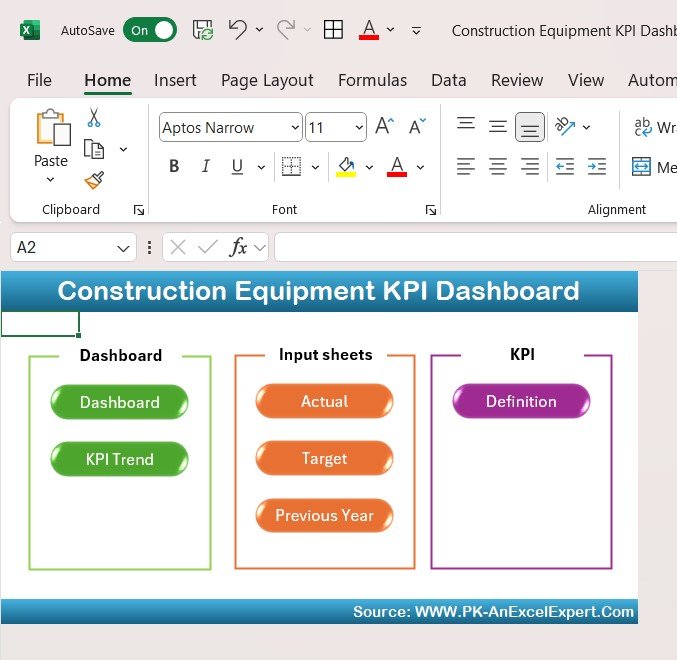
What’s Inside the Construction Equipment KPI Dashboard in Excel:
-
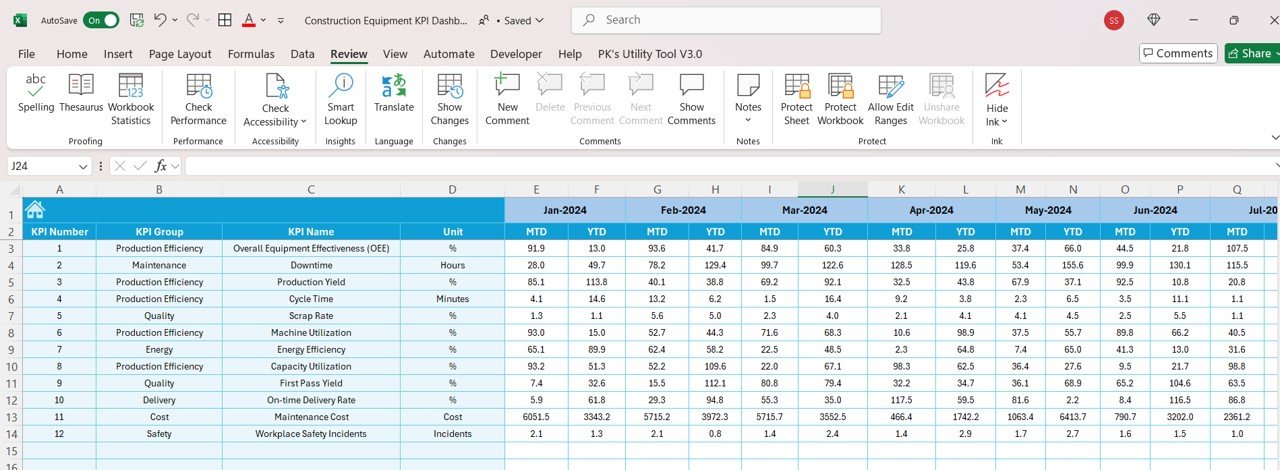
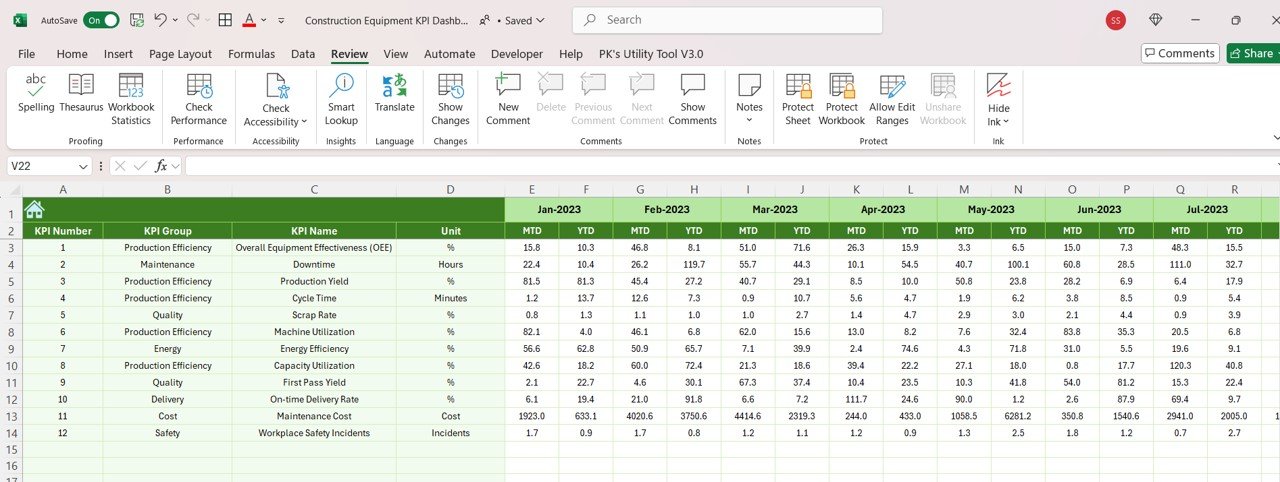
Equipment Utilization: Track operating hours, idle time, and utilization rates for each piece of construction equipment to ensure that assets are being fully utilized.
-
Maintenance and Service Tracking: Monitor scheduled maintenance, repairs, and service intervals to ensure timely upkeep of equipment and avoid breakdowns.
-
Fuel Consumption Monitoring: Track fuel consumption per equipment, helping you optimize fuel usage and reduce fuel costs across your fleet.
-
Downtime Monitoring: Track and analyze downtime due to maintenance, repairs, or breakdowns, helping you reduce delays and improve project timelines.
-
Cost Management: Track costs associated with equipment, including fuel, maintenance, repairs, and staffing, ensuring that your projects stay within budget.
-
Custom Reports: Generate customized reports summarizing equipment performance, maintenance costs, and utilization rates to help improve decision-making.
How to Use the Construction Equipment KPI Dashboard in Excel:
1️⃣ Download the Template – Instantly access your Excel file upon purchase.
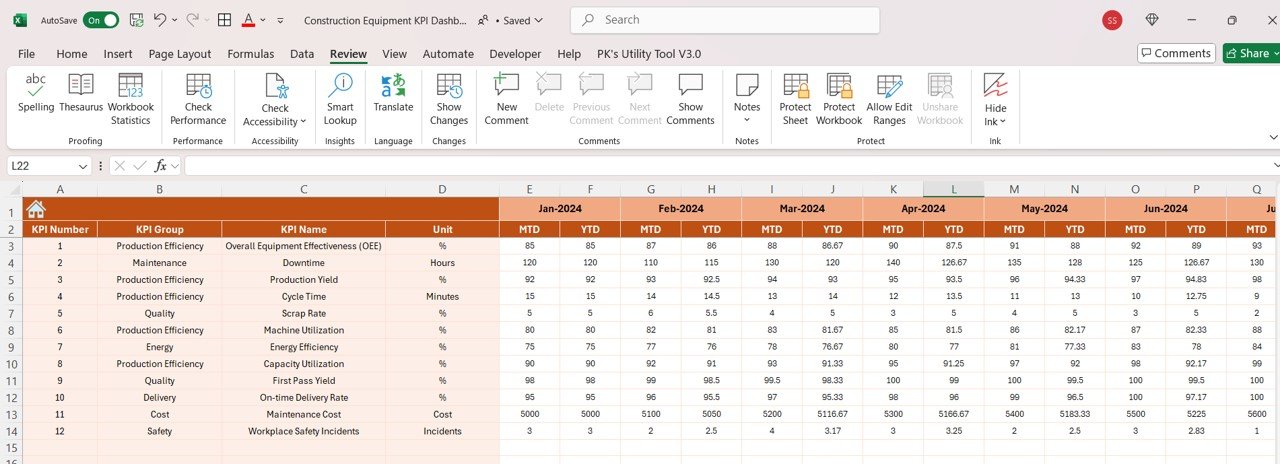
2️⃣ Input Equipment Data – Enter data for equipment usage, fuel consumption, maintenance schedules, and downtime to start tracking KPIs.
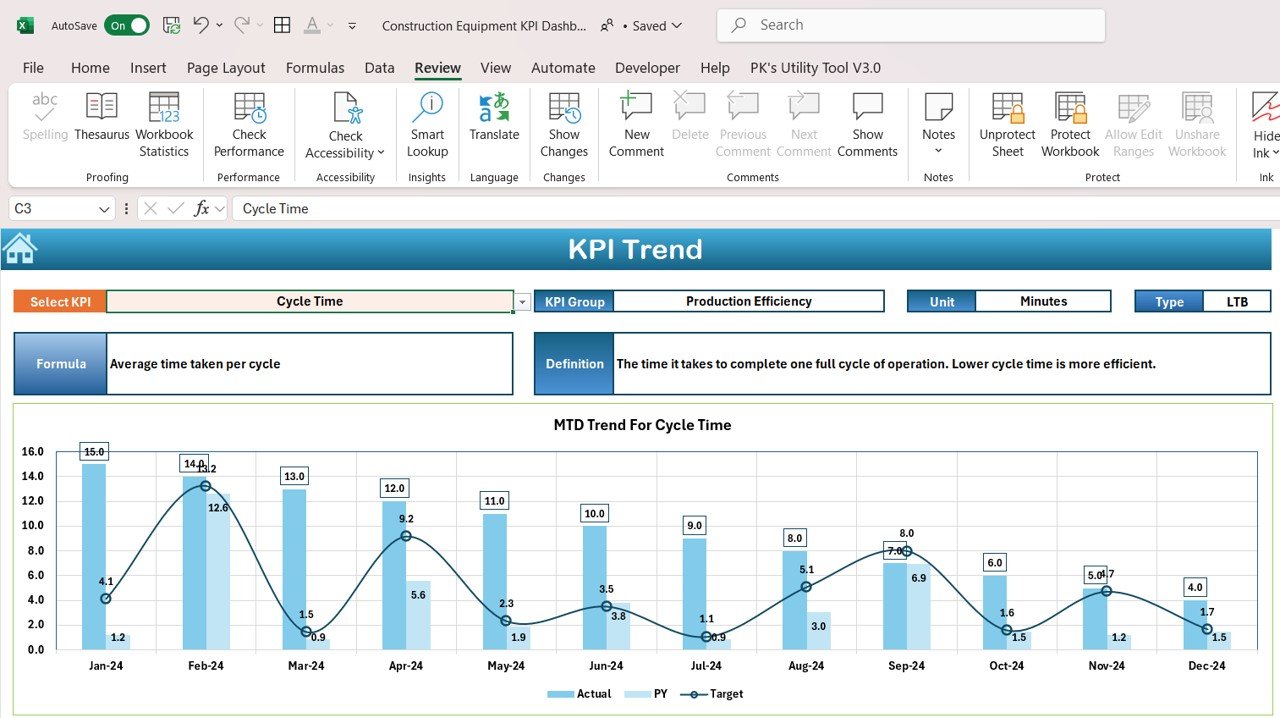
3️⃣ Monitor Key Metrics – Use the dashboard to monitor equipment utilization, fuel efficiency, maintenance, and downtime in real-time.
4️⃣ Analyze Performance Trends – Track trends in equipment performance, including utilization rates, maintenance costs, and fuel consumption, to identify areas for improvement.
5️⃣ Generate Reports – Create detailed reports summarizing equipment performance, costs, and maintenance needs, helping you make informed decisions.
Who Can Benefit from the Construction Equipment KPI Dashboard in Excel:
-
Construction Managers
-
Fleet Operators
-
Project Managers
-
Equipment Maintenance Teams
-
Operations Managers
-
Financial Managers in Construction
-
Small to Large Construction Companies
-
Equipment Rental Companies
The Construction Equipment KPI Dashboard in Excel is the perfect tool for optimizing the performance of your construction equipment fleet. With features that help you monitor equipment usage, track maintenance, and control fuel and operational costs, this dashboard ensures that your construction projects are cost-effective and completed on time.
Click here to read the Detailed blog post
https://www.pk-anexcelexpert.com/construction-equipment-kpi-dashboard-in-excel/
Visit our YouTube channel to learn step-by-step video tutorials
Youtube.com/@PKAnExcelExpert


Reviews
There are no reviews yet.