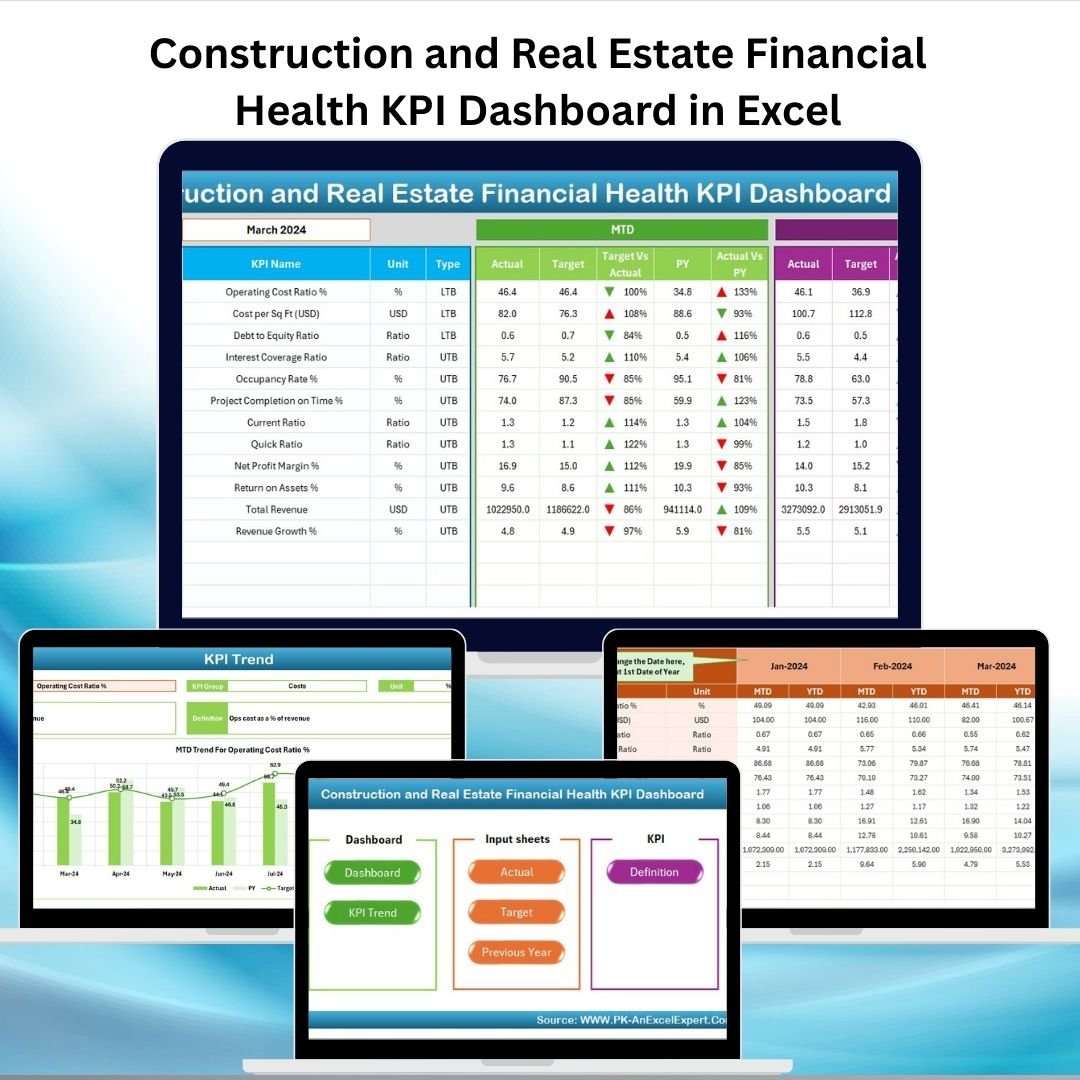

Managing the financial health of construction and real estate projects is one of the most critical aspects of ensuring profitability and sustainability. With multiple projects running simultaneously, it becomes challenging for contractors, developers, and project managers to stay on top of budgets, revenues, and risks. This Construction and Real Estate Financial Health KPI Dashboard in Excel is designed to make that process easier, smarter, and more reliable.
Instead of juggling scattered reports and manual spreadsheets, this ready-to-use Excel template provides a centralized platform to monitor financial KPIs, analyze performance trends, and make data-driven decisions. Whether you’re managing a single project or overseeing a portfolio of real estate developments, this dashboard helps you achieve clarity and confidence in financial planning.
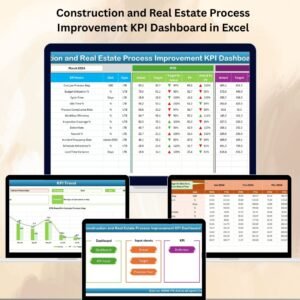
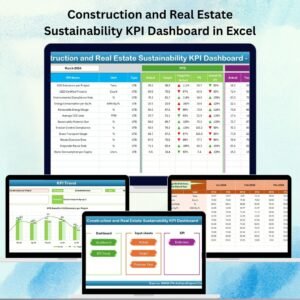
🔑 Key Features of the Construction and Real Estate Financial Health KPI Dashboard
-
📊 All-in-One Dashboard – Track essential KPIs like budget variance, revenue growth, ROI, and profit margins in one file.
-
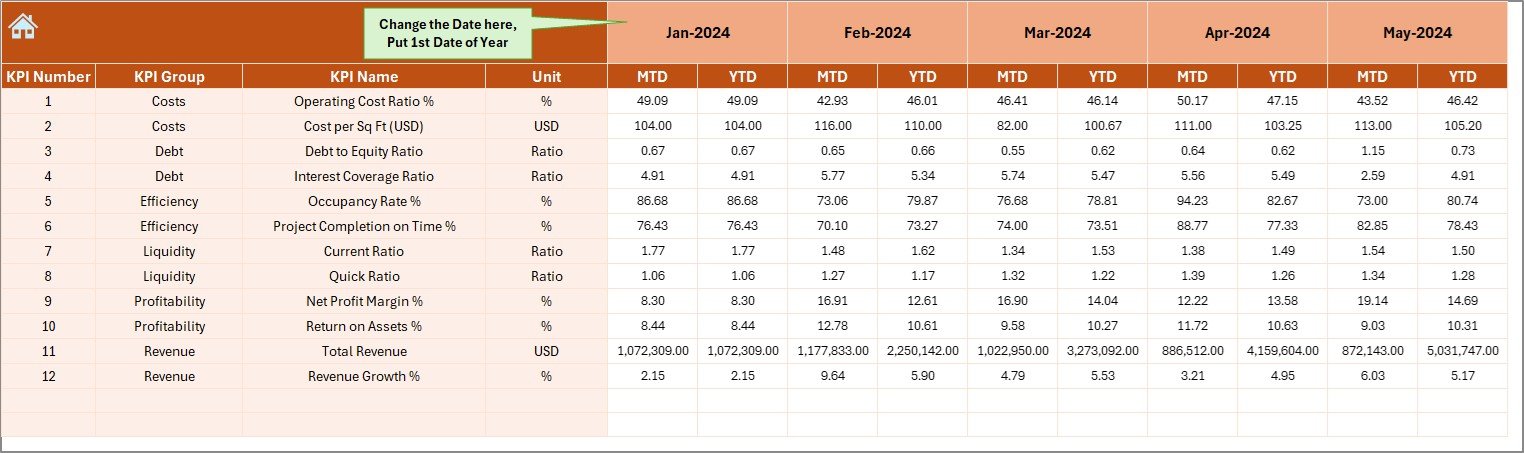
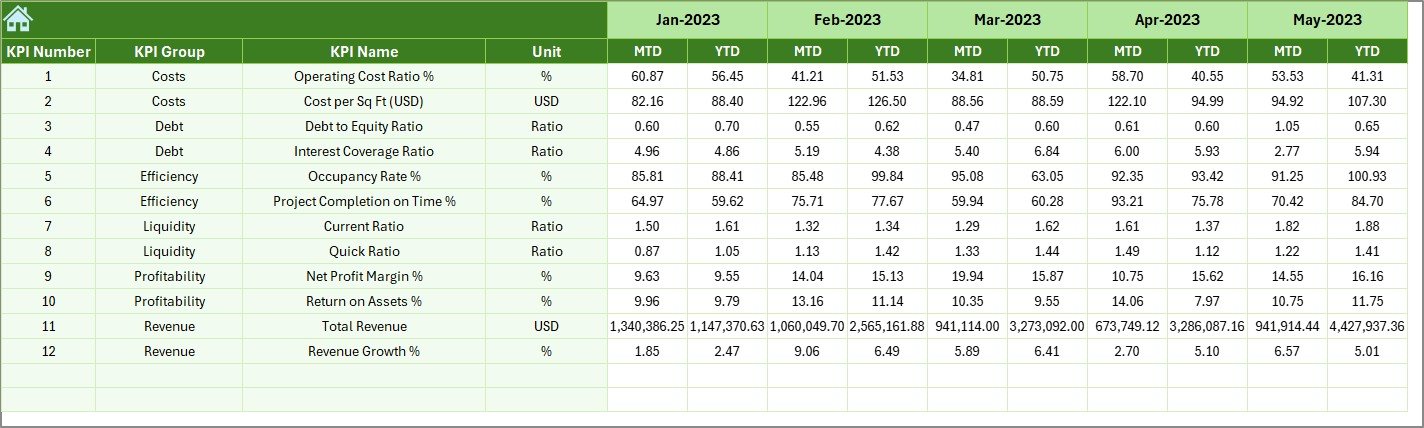
🎯 MTD & YTD Analysis – Compare Month-to-Date and Year-to-Date actuals against targets and previous year’s results.
-
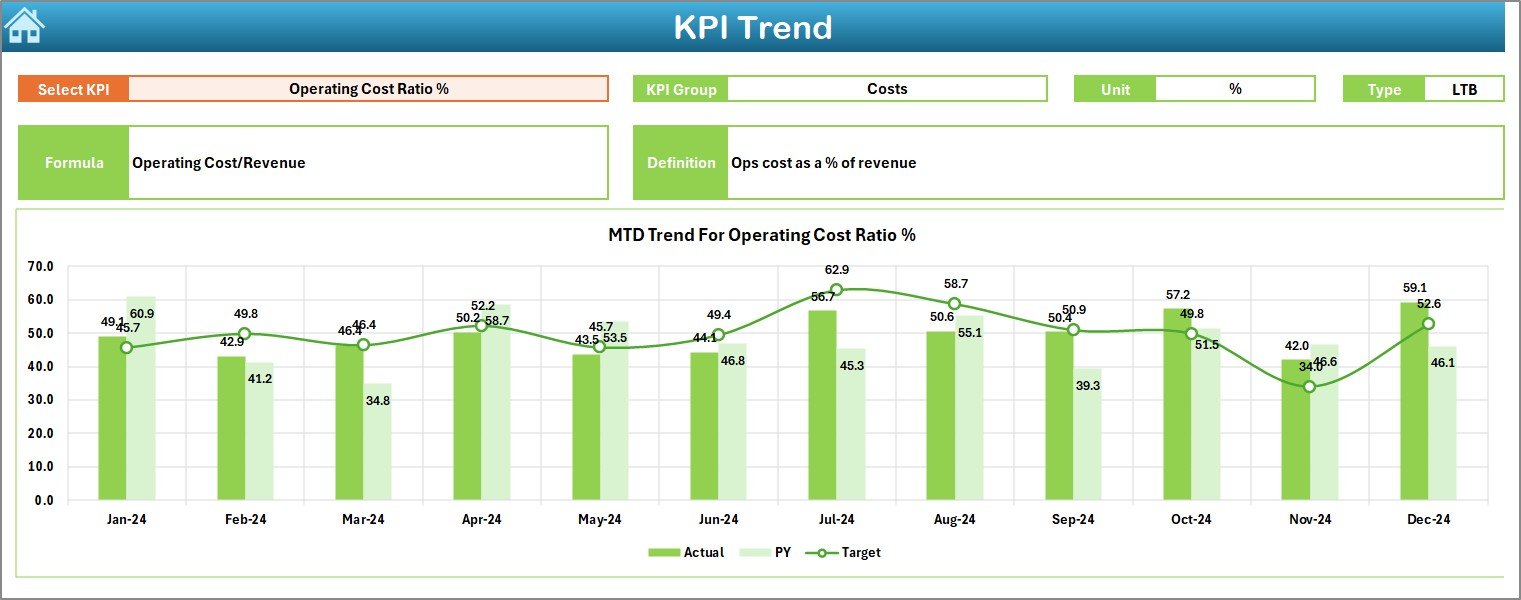
📉 Visual Insights – Charts, conditional formatting, and trend arrows highlight financial risks instantly.
-
⚡ Automated Calculations – Minimize manual errors and save hours of financial reporting time.
-
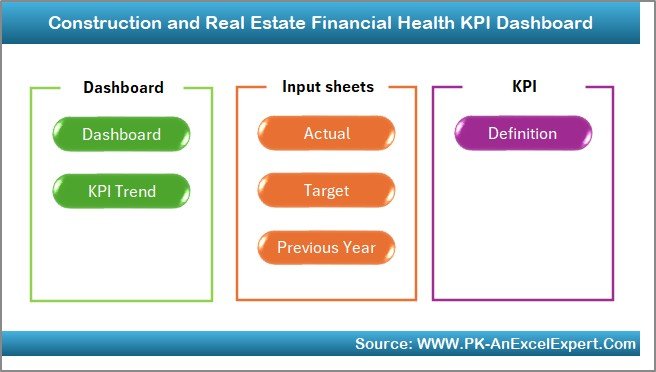
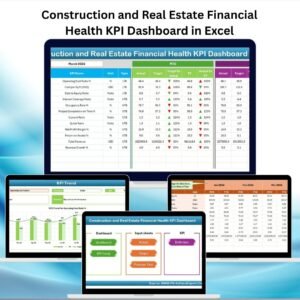
🗂️ Structured Layout – Seven dedicated worksheets (Dashboard, Trends, Actuals, Targets, Previous Year, KPI Definition, and Home) ensure smooth navigation.
-
🔄 Customizable KPIs – Add or modify KPI definitions, formulas, and units to match your unique project needs.
-
🛠️ Benchmark Comparisons – Instantly compare current results with previous year numbers to spot long-term financial patterns.
-
✅ Simple & Effective – Built for practical usage by finance teams, project managers, contractors, and executives.
📦 What’s Inside the Construction and Real Estate Financial Health KPI Dashboard
When you download this template, you’ll get access to seven structured worksheet tabs, each designed for a specific purpose:
-
Home Sheet – Acts as an index page with navigation buttons for easy access.
-
Dashboard Sheet – The central hub for all financial KPIs with MTD & YTD insights.
-
KPI Trend Sheet – Select any KPI to view its movement over time with trend charts.
-
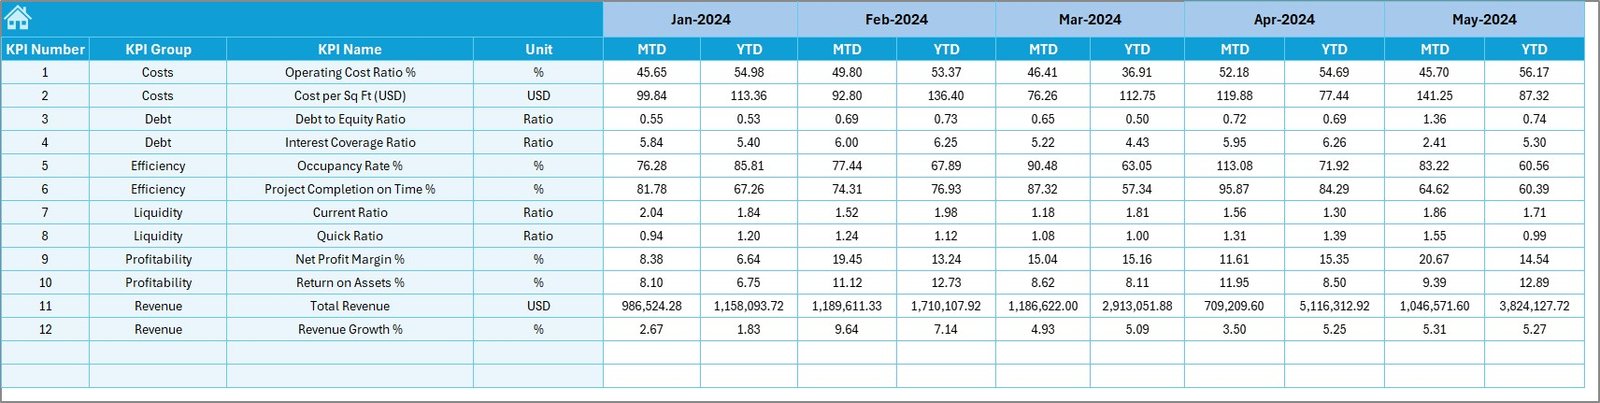
Actual Numbers Input Sheet – Enter real financial data regularly.
-
Target Sheet – Define monthly and yearly benchmarks for accurate performance comparison.
-
Previous Year Numbers Sheet – Store historical financial data for year-over-year tracking.
-
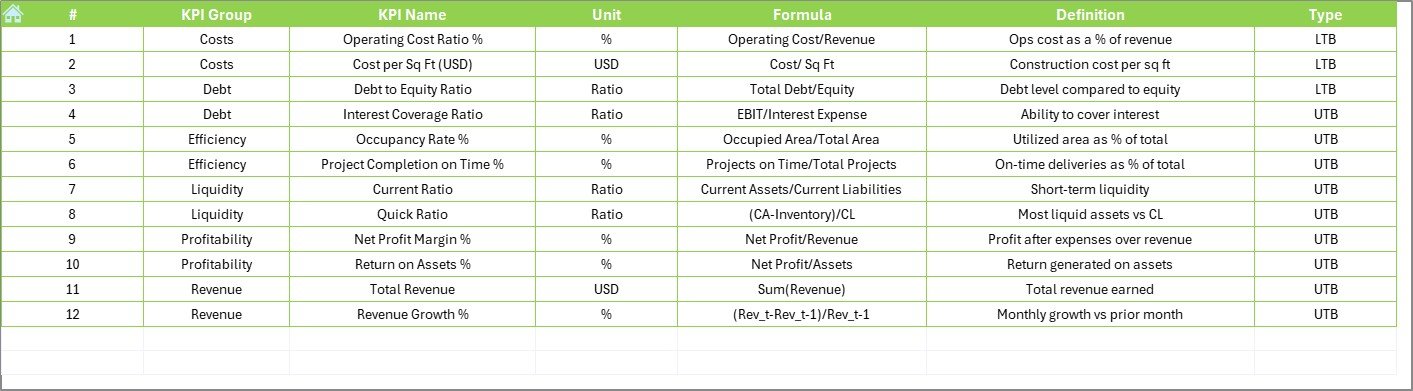
KPI Definition Sheet – Maintain clarity by listing KPI names, formulas, and definitions in one place.
This structure ensures you always know where your data lives and how it connects.
🛠️ How to Use the Construction and Real Estate Financial Health KPI Dashboard
-
Download the Template – Get started right away with this ready-to-use file.
-
Customize KPIs – Add or adjust KPIs relevant to your project or organization.
-
Enter Data – Input your actuals, targets, and previous year’s numbers into dedicated sheets.
-
Analyze Trends – Review the Dashboard and Trend sheets to spot gaps and opportunities.
-
Make Adjustments – Use insights to control costs, boost ROI, and improve profitability.
Even without advanced Excel skills, you’ll find this dashboard user-friendly and highly practical.
👥 Who Can Benefit from This Dashboard?
This KPI dashboard is versatile and ideal for:
-
🏗️ Contractors – Track multiple project budgets at once.
-
🏢 Developers – Monitor ROI and profitability across real estate investments.
-
💼 Finance Teams – Manage cash flows, profit margins, and budget variance with precision.
-
📋 Project Managers – Stay on top of expenses and ensure alignment with targets.
-
👨💼 Executives – Make confident high-level decisions with reliable financial insights.


Reviews
There are no reviews yet.