


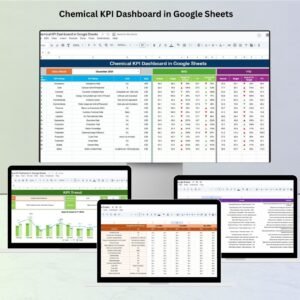
The Chemical KPI Dashboard in Google Sheets is a powerful tool designed to help professionals in the chemical industry track, monitor, and optimize their key performance indicators (KPIs). This dashboard provides real-time insights into production, quality control, resource utilization, and safety compliance, enabling data-driven decision-making for improved operational efficiency.

Key Features of the Chemical KPI Dashboard in Google Sheets
📊 Real-Time Data Visualization
Monitor KPIs: Track critical metrics like production output, yield rates, energy consumption, waste generation, and safety incidents.
Dynamic Charts: Visualize trends and track performance with easy-to-read charts and graphs that highlight key data points.
🔧 Customizable Metrics
Tailor the Dashboard: Customize the dashboard to reflect your unique chemical processes and KPIs.
Adaptable for Different Operations: Whether you’re in manufacturing, quality control, or safety, the dashboard can be adjusted to fit your specific needs.
📅 Interactive and Automated Features
Real-Time Data Integration: Automatically update the dashboard with data from external sources, minimizing manual input and reducing errors.
Interactive Filters: Filter by time period, production line, or other variables to analyze data in detail.
💡 User-Friendly Interface
Easy Navigation: Designed for both technical and non-technical users, the dashboard provides an intuitive experience, making it accessible to all team members.
Visual Analytics: Quickly assess operational performance through visual tools that provide actionable insights.
Benefits of Using the Chemical KPI Dashboard
✅ Improved Decision-Making
Real-time data visualizations help managers and decision-makers analyze trends and make informed choices to optimize operations.
✅ Enhanced Operational Efficiency
By tracking KPIs like production output and resource usage, the dashboard helps identify bottlenecks and inefficiencies, leading to targeted improvements.
✅ Cost Reduction
Monitor resource consumption and waste production to identify areas where cost-saving measures can be implemented.
✅ Regulatory Compliance
Track safety and regulatory compliance KPIs, ensuring adherence to industry standards and reducing risk.
✅ Performance Benchmarking
Benchmark your performance against historical data and industry standards to maintain competitiveness and drive continuous improvement.
Getting Started with Your Chemical KPI Dashboard in Google Sheets
Download the Template: Download the Chemical KPI Dashboard template and save it to your Google Drive for easy access.
Input Your Data: Enter your production, resource, and safety data into the designated sheets for accurate tracking.
Customize Your KPIs: Adjust the dashboard to track the specific KPIs that matter most to your chemical processes.
Monitor Performance: Use the built-in visual tools to analyze your operational trends, identify issues, and evaluate performance.
Take Action: Use the insights from the dashboard to optimize processes, improve efficiency, and ensure regulatory compliance.
By using the Chemical KPI Dashboard in Google Sheets, you can gain valuable insights into your operations, make informed decisions, and optimize your business processes for improved productivity and reduced costs.
Click here to read the Detailed blog post
Chemical KPI Dashboard in Google Sheets
Visit our YouTube channel to learn step-by-step video tutorials
YouTube.com/@NeotechNavigators
Watch the step-by-step video Demo:
What’s Included
- A Chemical KPI Dashboard template for Google Sheets
- Dashboard views for production output, yield rates, energy consumption, waste generation and safety incidents
- Dynamic charts that show trends
- Interactive filters for time period and production line
Compatibility and Requirements
- Works in Google Sheets. You need a free Google account and a web browser.
- Save the template to your Google Drive, then enter your data. Google explains how the charts work in Add and edit a chart or graph.
Frequently Asked Questions
Which KPIs does the dashboard track?
It tracks production output, yield rates, energy consumption, waste generation and safety incidents, along with quality control, resource use and safety compliance.
Can I change the KPIs to fit my own process?
Yes. You can customize the dashboard to reflect your own chemical processes and the KPIs that matter most to you.
Can I filter the data?
Yes. Interactive filters let you view the data by time period, production line or other variables.
Do I need technical skills to use it?
No. The interface is built for technical and non-technical users. You download the template, save it to Google Drive and enter your production, resource and safety data in the data sheets.
Is there an Excel or Power BI version?
Yes. See the Chemical KPI Dashboard in Excel and the Chemical KPI Dashboard in Power BI.
Related Chemical Templates
- Chemical KPI Dashboard in Excel: the same dashboard in Excel
- Chemical KPI Dashboard in Power BI: the Power BI edition
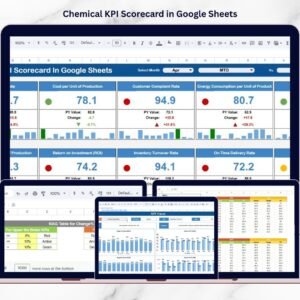
- Chemical KPI Scorecard in Google Sheets: a scorecard view of your chemical KPIs
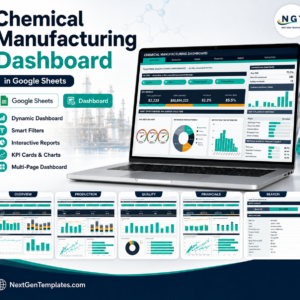
- Chemical Manufacturing Dashboard in Google Sheets: a manufacturing view in Google Sheets
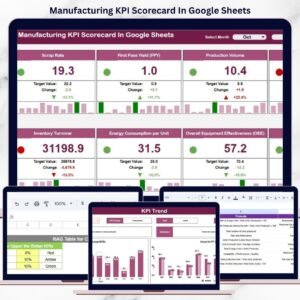
- Manufacturing KPI Scorecard In Google Sheets: a general manufacturing scorecard
Browse all Google Sheets KPI dashboards.

Reviews
There are no reviews yet.