
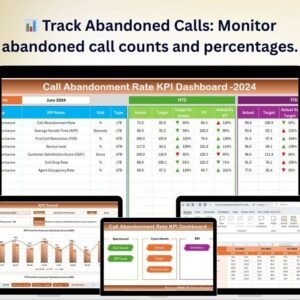
The Call Abandonment Rate KPI Dashboard in Excel is a powerful tool designed to help call centers and customer service teams track and optimize call abandonment rates. This Excel-based dashboard allows you to monitor critical metrics like the number of abandoned calls, the abandonment rate percentage, and the impact of these metrics on customer satisfaction and service efficiency.
By using this dashboard, managers can identify trends, understand the root causes of call abandonment, and implement strategies to reduce abandonment rates. With easy-to-read charts and real-time data updates, this tool provides actionable insights that help improve customer service operations and overall business performance.
Key Features of the Call Abandonment Rate KPI Dashboard in Excel
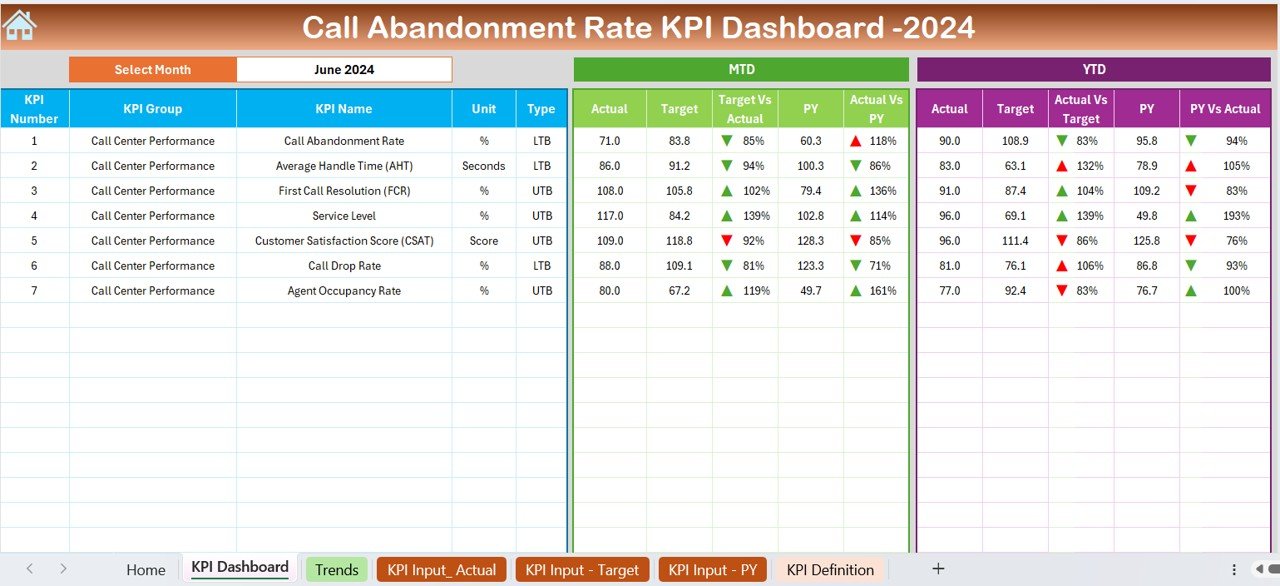
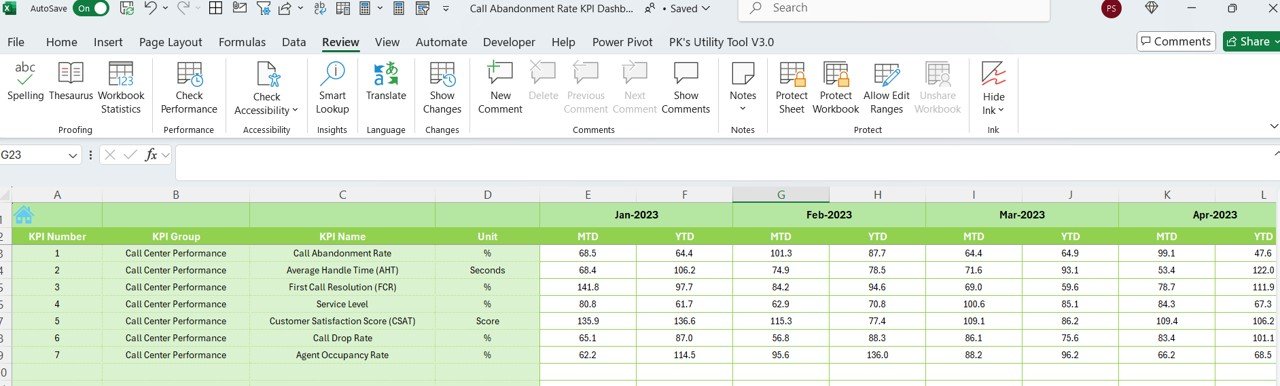
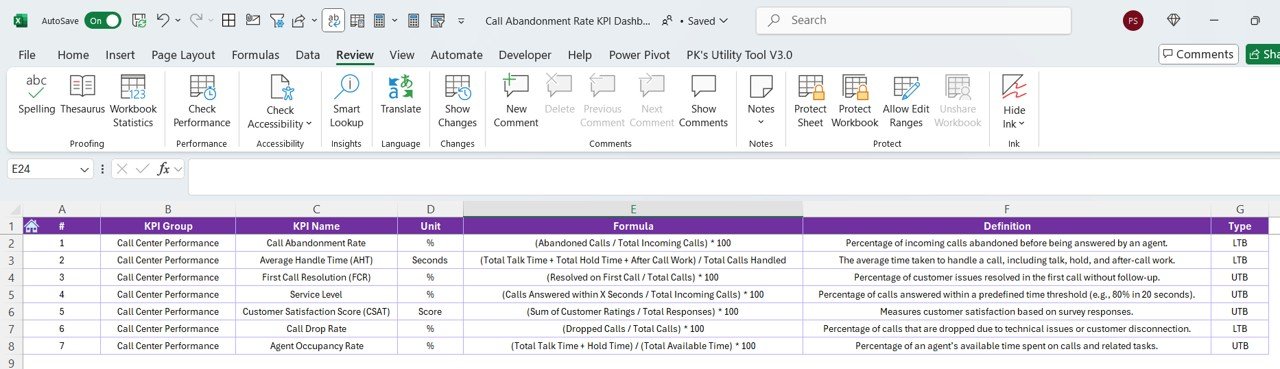
📊 Call Abandonment Rate Tracking
Track the total number of abandoned calls, as well as the percentage of abandoned calls out of the total calls received. Monitor this metric in real-time to identify any increases in call abandonment.
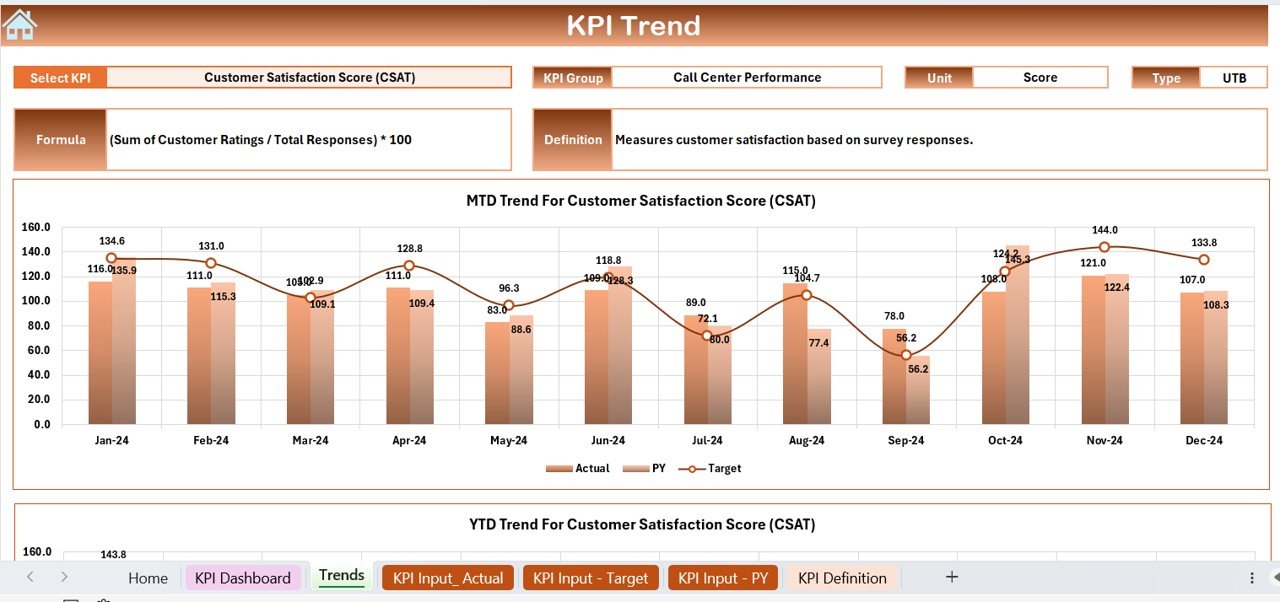
📈 Time-Based Analysis
Analyze abandonment rates over different periods—hourly, daily, weekly, or monthly—to identify peak abandonment times and optimize staffing during high-demand periods.
🔄 Call Flow Monitoring
Gain insight into where calls are being abandoned in the customer service journey. Track which stage of the call (e.g., wait time, IVR, agent transfer) sees the highest rates of abandonment.
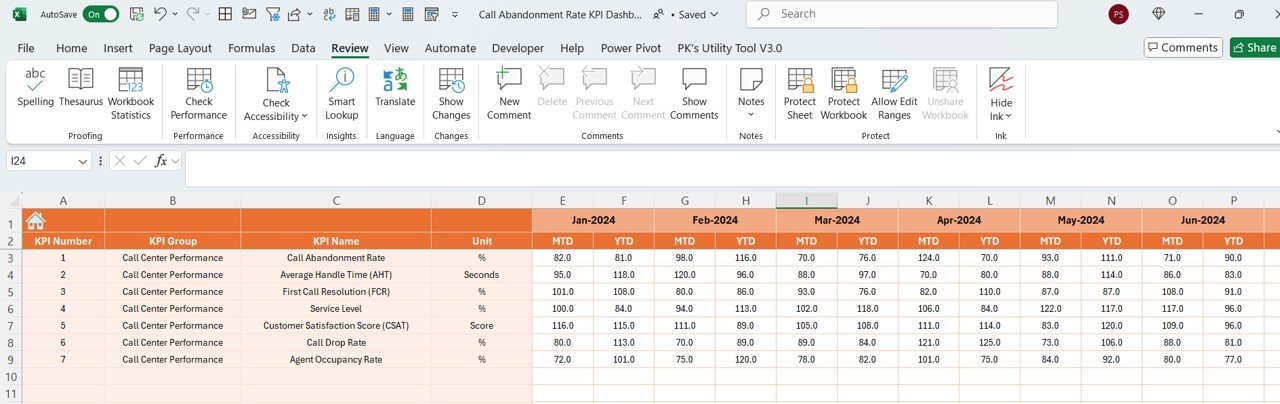
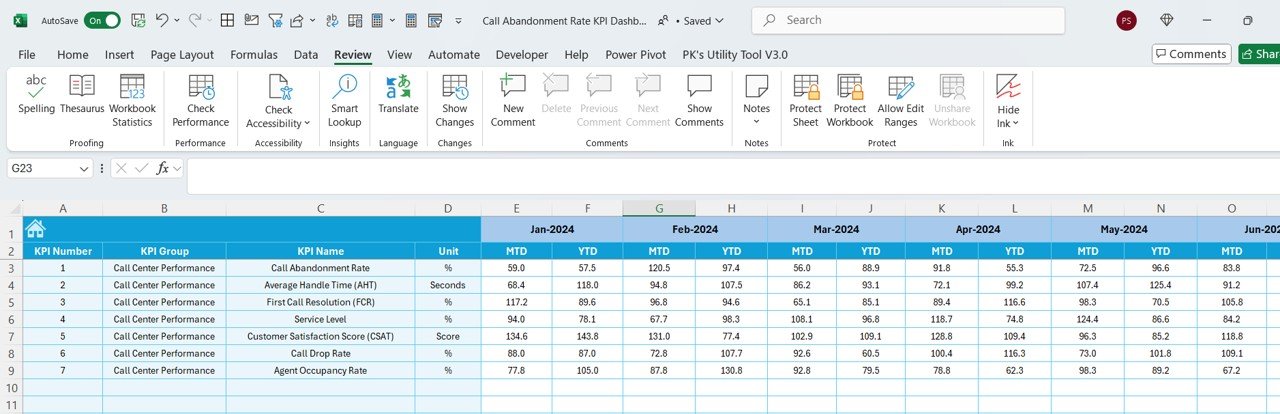
⚙️ Real-Time Data Integration
Integrate real-time data from your call center systems and track abandonment rates instantly. This allows you to make adjustments and optimize service levels on the fly.
📊 Performance Visuals
Use dynamic visual charts and graphs to represent call abandonment data. Visualize trends and compare abandonment rates to other key performance indicators like call volume, average handle time, and service level.
🔑 Customizable Metrics
Customize the dashboard to include the metrics that matter most to your business. Add additional KPIs like call volume, wait time, or average handling time for a comprehensive view of your call center’s performance.
Why You’ll Love the Call Abandonment Rate KPI Dashboard in Excel
✅ Identify and Reduce Call Abandonment
Track abandoned calls and analyze trends to reduce abandonment rates. Improve your service levels by optimizing staffing and reducing wait times.
✅ Improve Customer Experience
Monitor when and why calls are being abandoned to improve customer experience. Ensure that your customers are being served promptly and efficiently.
✅ Optimize Call Center Performance
Use the dashboard’s insights to optimize agent performance, reduce call wait times, and increase overall customer satisfaction.
✅ Data-Driven Decision Making
Make better decisions using data visualizations and actionable insights. Reduce customer frustration and improve service levels with proactive improvements.
✅ Customizable and Scalable
Tailor the dashboard to your specific needs. Whether you’re running a small team or managing a large call center, the dashboard can scale to meet your operational requirements.
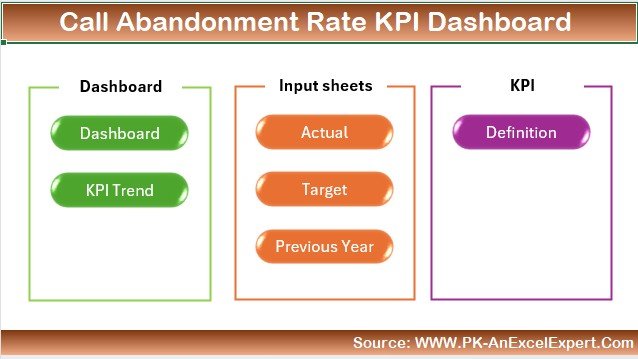
What’s Inside the Call Abandonment Rate KPI Dashboard in Excel?
-
Call Abandonment Rate Tracking: Monitor total abandoned calls and abandonment rates.
-
Time-Based Analysis: Identify peak abandonment periods and optimize staffing.
-
Call Flow Monitoring: Track abandonment across various stages of the call process.
-
Real-Time Data Integration: Get real-time updates for better decision-making.
-
Performance Visuals: Visual charts and graphs for data representation.
-
Customizable Features: Customize the dashboard to fit your KPIs and metrics.
How to Use the Call Abandonment Rate KPI Dashboard in Excel
1️⃣ Download the Template: Access the Call Abandonment Rate KPI Dashboard in Excel instantly.
2️⃣ Integrate Data Sources: Link your call center data sources to the dashboard for real-time updates.
3️⃣ Track Key Metrics: Monitor abandonment rates, call volume, and other key KPIs in real time.
4️⃣ Analyze Trends & Patterns: Use time-based analysis to identify trends and areas for improvement.
5️⃣ Optimize Call Center Operations: Use the insights from the dashboard to optimize staffing, reduce wait times, and improve customer service.
Who Can Benefit from the Call Abandonment Rate KPI Dashboard in Excel?
🔹 Call Center Managers & Supervisors
🔹 Customer Service Teams
🔹 Operations Managers & Directors
🔹 Customer Experience Professionals
🔹 Data Analysts & Business Intelligence Teams
🔹 Small & Medium Enterprises (SMBs)
🔹 Large Enterprises with Customer Service Departments
Track, monitor, and improve your call center performance with the Call Abandonment Rate KPI Dashboard in Excel. Optimize customer service, reduce abandonment, and enhance the overall customer experience.
Click here to read the Detailed blog post
Visit our YouTube channel to learn step-by-step video tutorials
Youtube.com/@PKAnExcelExpert


Reviews
There are no reviews yet.