
⚡ In today’s unpredictable world, business continuity is not optional—it’s essential. Cyberattacks, natural disasters, and system outages can disrupt operations instantly. Without proper monitoring, these events lead to huge financial losses, reputational damage, and compliance risks. That’s why the Business Continuity Dashboard in Power BI is a must-have for modern organizations. 🚀
This interactive dashboard consolidates all continuity metrics—incidents, test results, recovery times, and downtime costs—into one dynamic, visual platform. Unlike static spreadsheets, Power BI empowers leaders with real-time insights, drill-through capabilities, and trend analysis to make smarter, faster decisions.
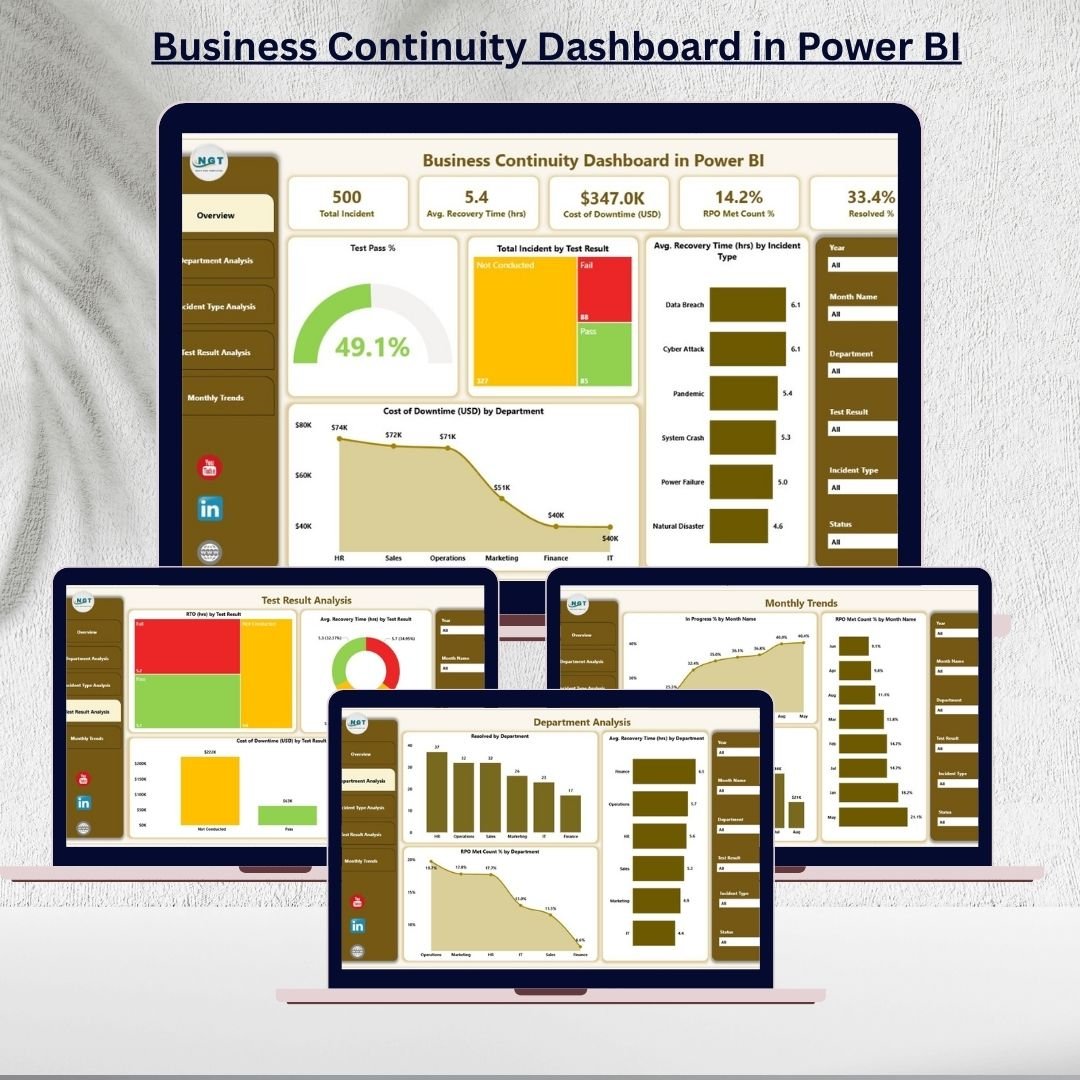
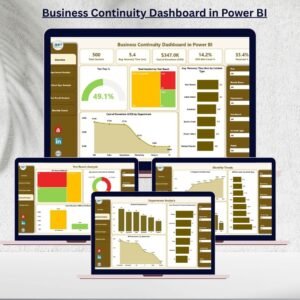
🌟 Key Features of the Business Continuity Dashboard in Power BI
-
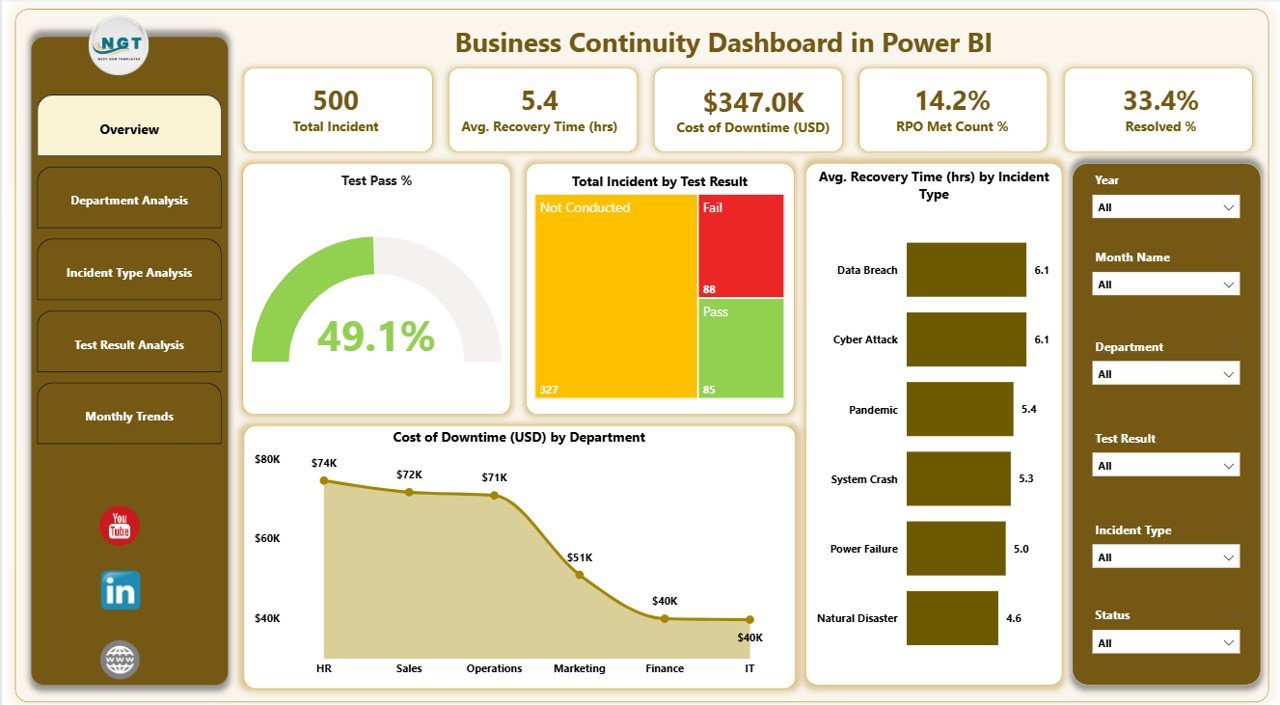
📊 Overview Page – Instant health check of continuity readiness.
-
5 KPI cards: Test Pass %, Incident Count, Average Recovery Time, Downtime Cost, and Resolved %.
-
Charts for Test Results, Incident Costs, and Recovery by Type.
-
-
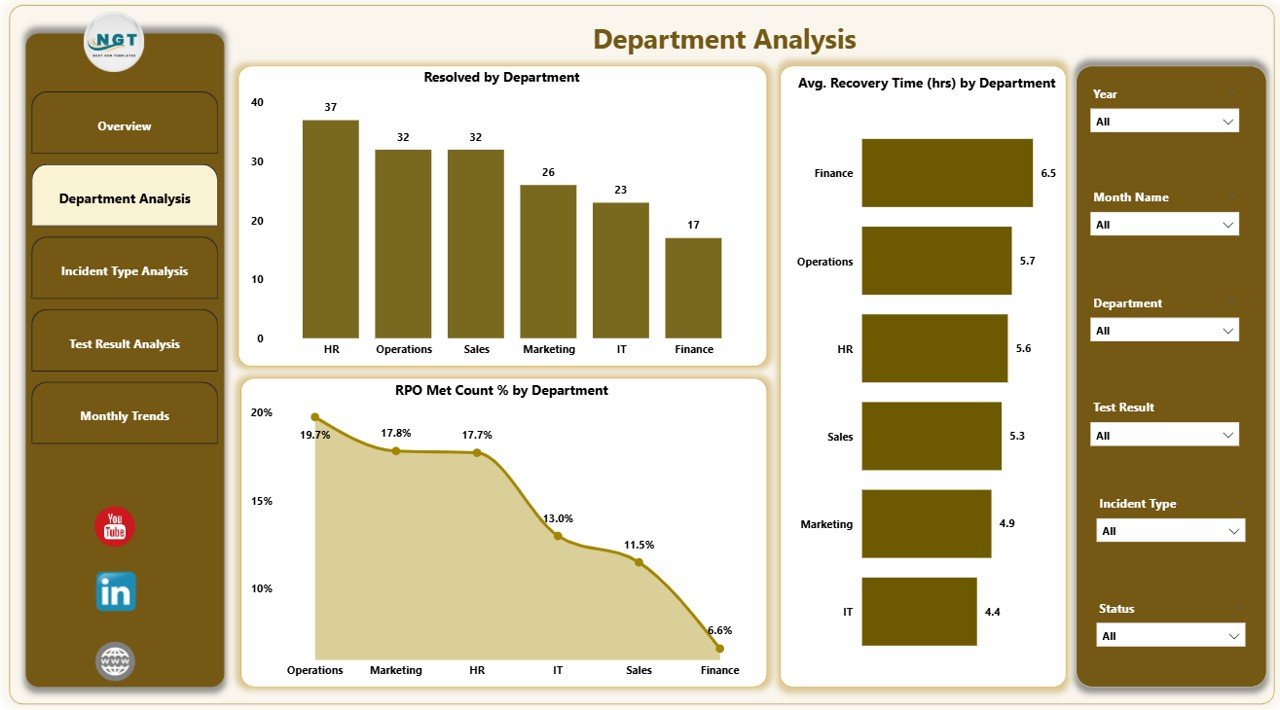
🏢 Department Analysis – Compare resilience across units.
-
Track Resolved Cases, Average Recovery Time, and RPO Met % by Department.
-
Spot weak departments and allocate resources effectively.
-
-
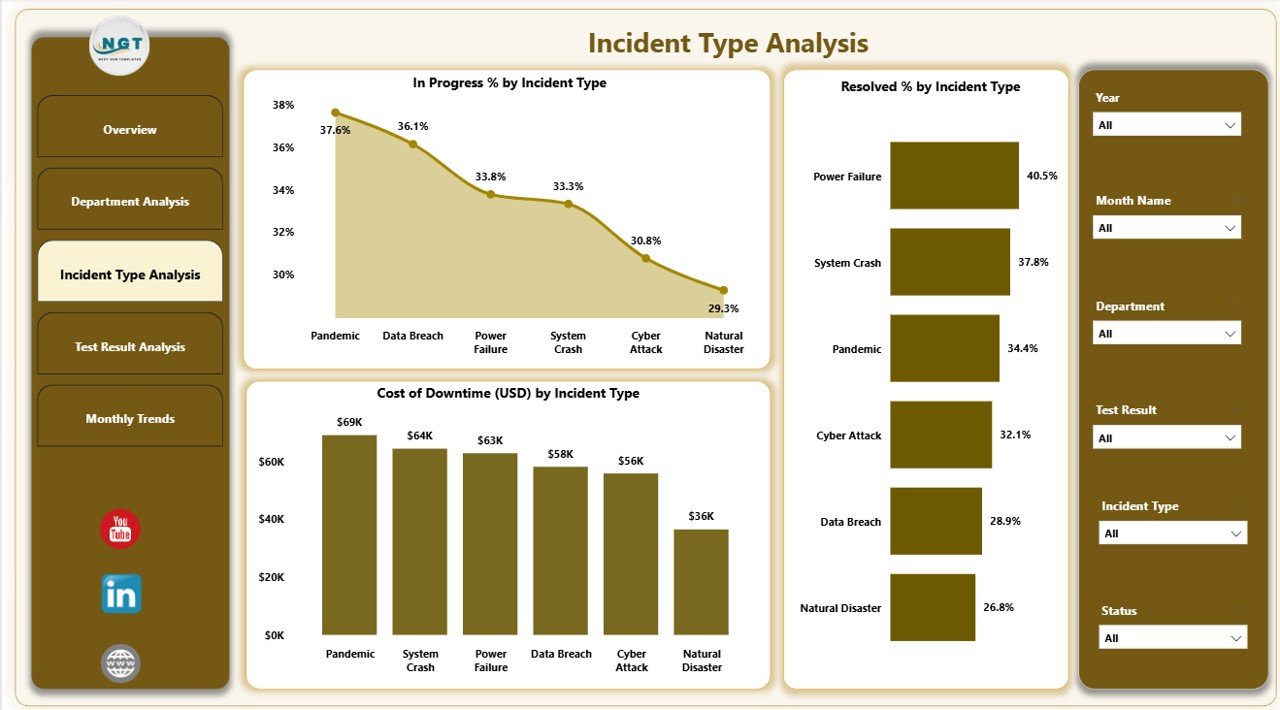
⚠️ Incident Type Analysis – Understand risk categories.
-
View In Progress %, Resolved %, and Cost of Downtime by incident type (e.g., cyberattacks, outages).
-
Identify high-risk incident categories.
-
-
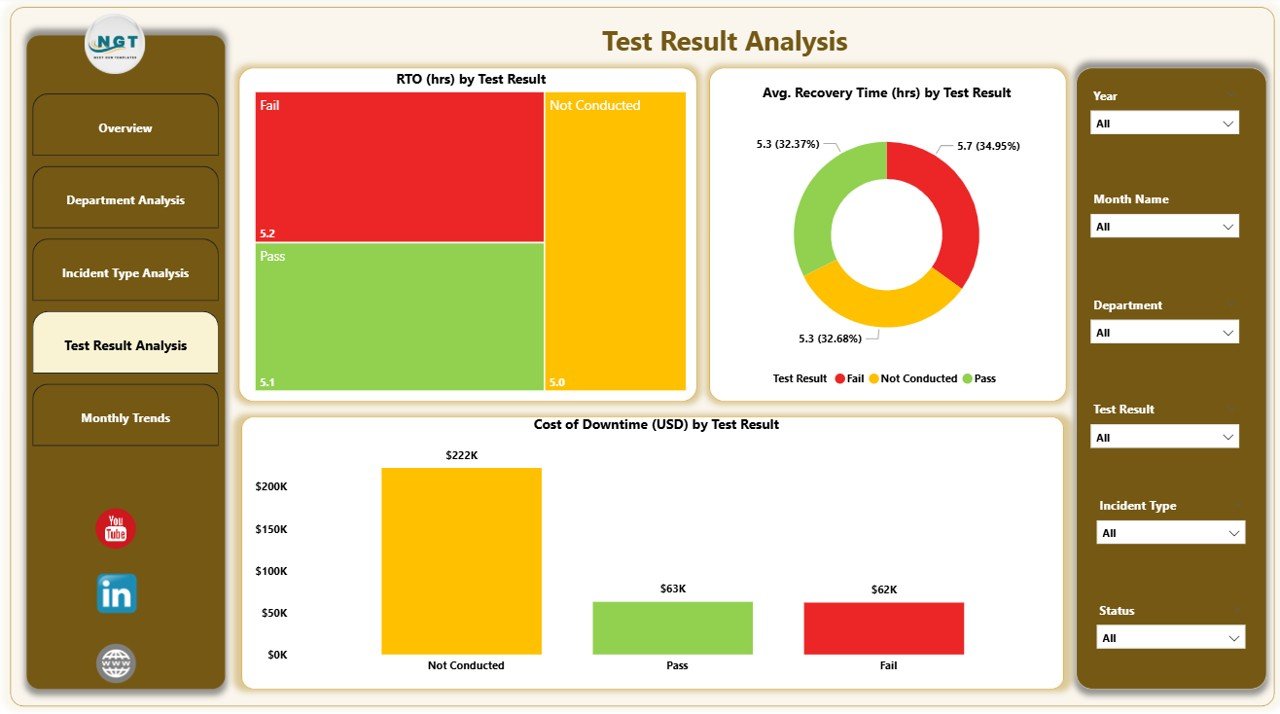
✅ Test Result Analysis – Evaluate continuity test outcomes.
-
Charts for RTO vs Test Results, Recovery Time by Result, and Downtime Costs.
-
Ensure RPO/RTO compliance across departments.
-
-
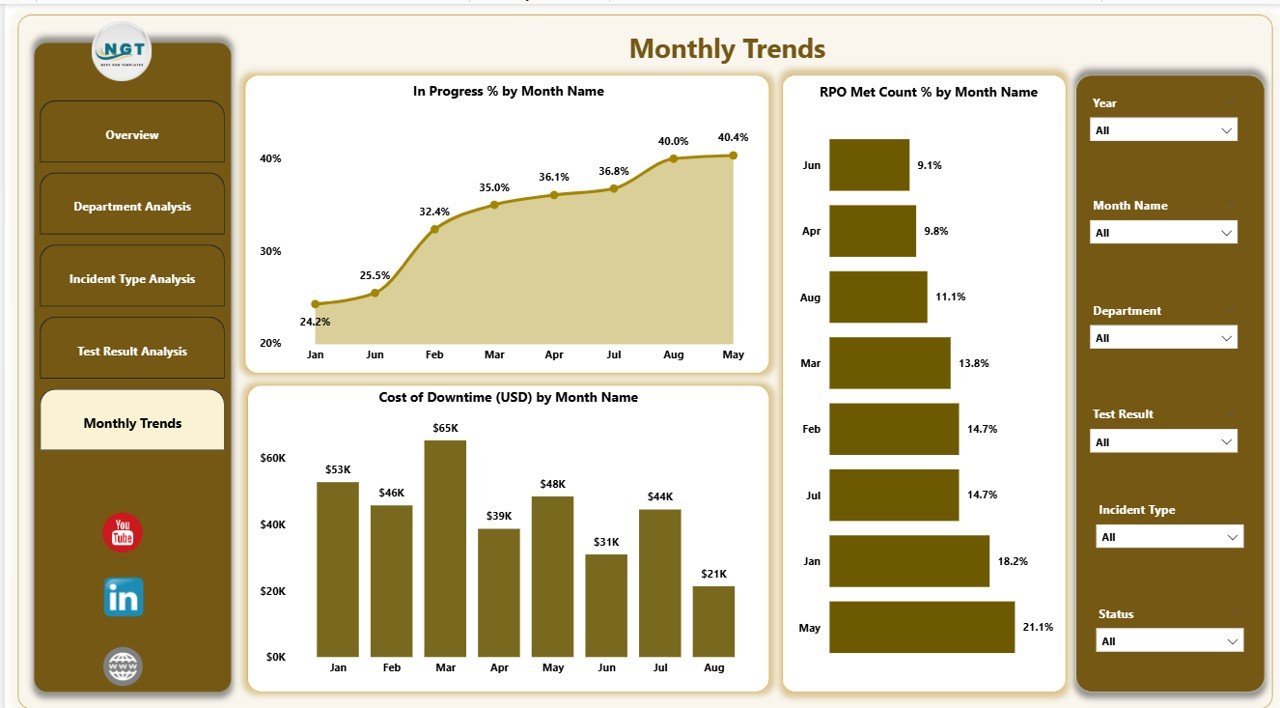
📅 Monthly Trends – Monitor performance over time.
-
Track In Progress %, RPO Met %, and Downtime Cost by Month.
-
Identify recurring weaknesses and seasonal patterns.
-
📦 What’s Inside the Dashboard
When you download the Business Continuity Dashboard in Power BI, you get:
-
✅ A ready-to-use Power BI file (.pbix) with 5 analytical pages.
-
✅ KPI visuals, slicers, and drill-throughs for deep analysis.
-
✅ Integration with Excel-based data sources for simple updates.
-
✅ Transparent KPI definitions (RTO, RPO, Test Pass %, Resolution %).
-
✅ Interactive charts for department, incident type, and monthly views.
-
✅ Scalable design—works for both small businesses and large enterprises.
🛠 How to Use the Business Continuity Dashboard
-
Update Data Sources – Enter incident details, recovery metrics, and test results into Excel.
-
Refresh Power BI – Instantly see updated KPIs and visuals.
-
Analyze Pages – Start with the Overview, then drill down into Department, Incident, Test, and Trends.
-
Apply Filters – Slice data by month, department, or incident type.
-
Share Insights – Export dashboards to PDF, PowerPoint, or share via Power BI Service.
💡 Designed for ease-of-use—no coding or advanced skills required.
👥 Who Can Benefit from This Dashboard?
The Business Continuity Dashboard in Power BI is perfect for:
-
🧑💼 Executives & CFOs – Monitor downtime costs and resilience.
-
👨💻 IT Teams – Track system failures, outages, and incident resolution.
-
📊 Continuity Managers – Ensure RPO/RTO compliance and test success.
-
🏢 Department Heads – Compare performance across business units.
-
🔒 Compliance Officers – Provide audit-ready continuity evidence.
Whether you manage a small business or a global enterprise, this dashboard is built to protect operations and drive resilience.
✅ Advantages of Business Continuity Dashboard in Power BI
-
Centralized Monitoring – All incidents and tests in one place.
-
Real-Time Insights – Live updates from Excel or integrated systems.
-
Faster Decisions – Visual KPIs and charts highlight risks instantly.
-
Financial Tracking – Measure downtime costs by department & type.
-
Compliance Support – Reliable audit-ready test performance data.
-
Enhanced Accountability – Departments are measured on recovery metrics.
-
Time-Saving – Replaces manual reporting with automated dashboards.


Reviews
There are no reviews yet.