The Bug Resolution KPI Dashboard in Excel is a comprehensive and powerful tool designed to help software development teams efficiently track, manage, and resolve bugs. Whether you are part of a development team, QA team, or a project manager overseeing software quality, this dashboard provides key insights into your bug resolution process. It helps you monitor bug trends, track the time spent on bug fixing, measure bug resolution effectiveness, and optimize your bug management process for better quality control.
By using this Excel-based dashboard, you can gain full visibility into bug status, severity, response times, and resolution effectiveness. With its detailed visualizations and easy-to-use interface, you can identify bottlenecks, evaluate performance, and take corrective actions to improve your software development lifecycle.
Key Features of the Bug Resolution KPI Dashboard in Excel
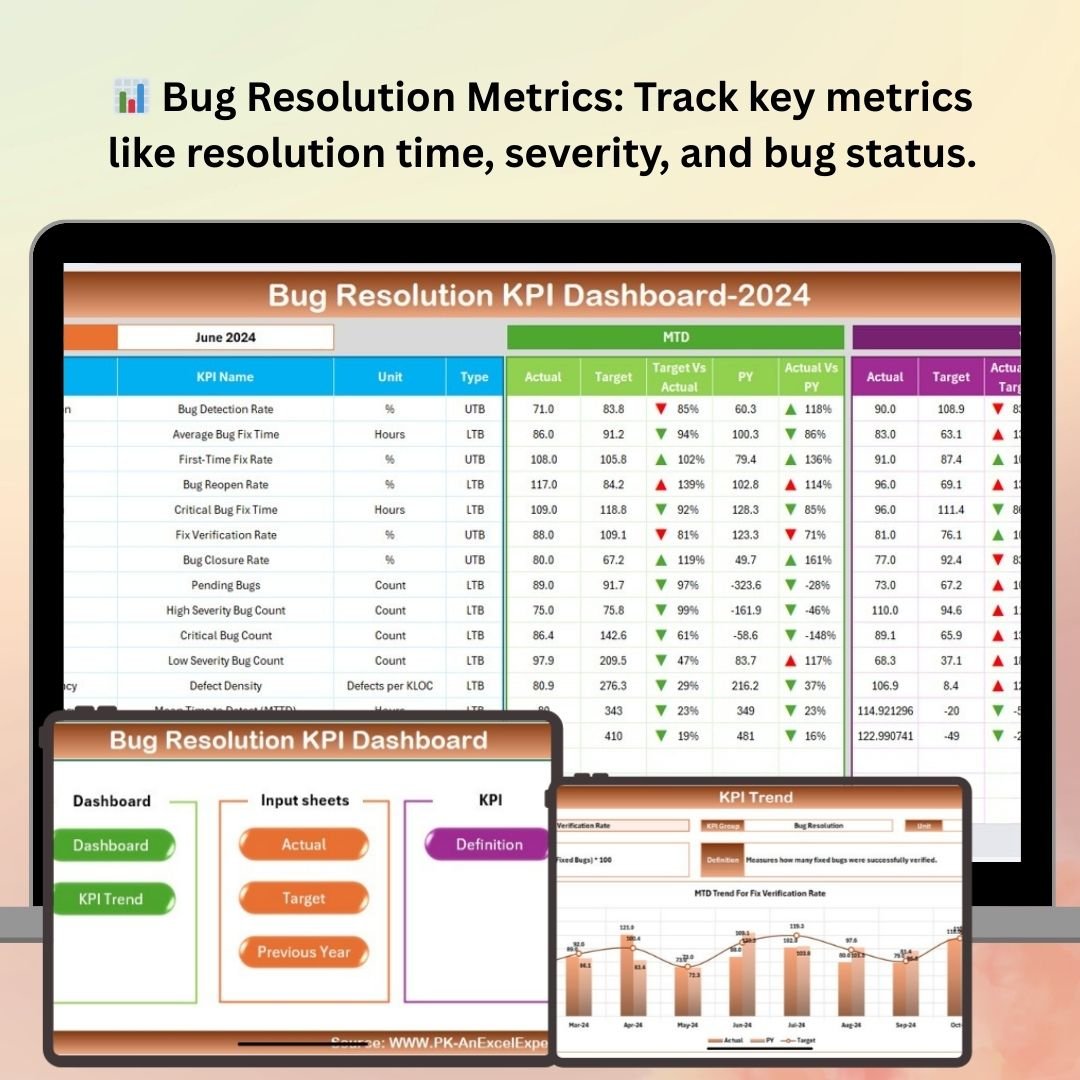
📊 Bug Resolution Metrics Tracking
Track key bug resolution metrics such as time to resolve, bug severity, and the number of open/closed bugs. This allows you to evaluate the efficiency of your bug resolution process.
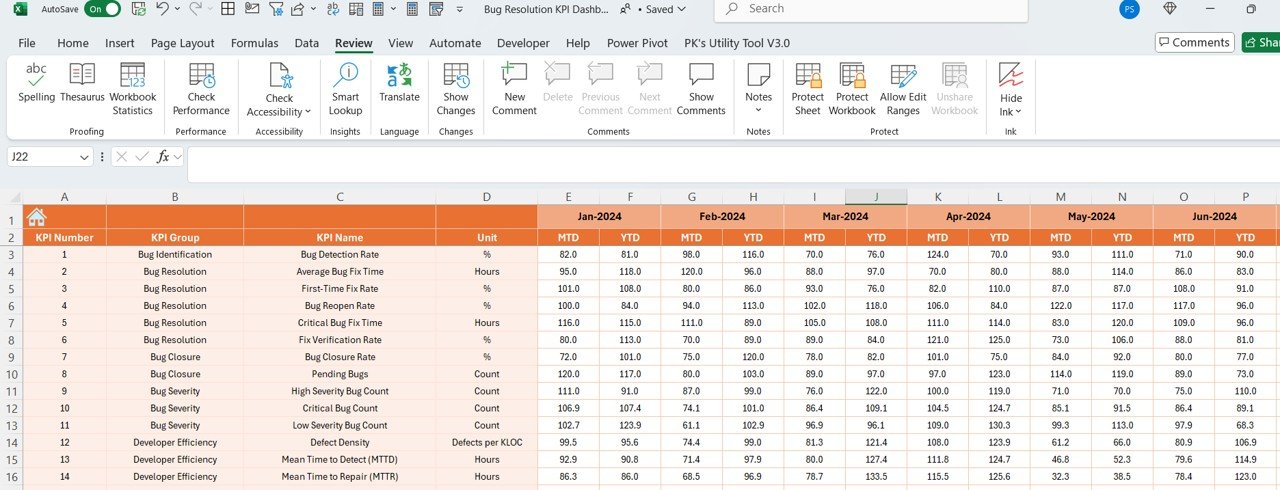
📈 Time-Based Tracking
Monitor bug resolution performance over different time periods (daily, weekly, or monthly) to identify trends and patterns. This helps you understand the efficiency of your development and QA teams.
📝 Bug Severity Classification
Classify bugs based on their severity, ensuring that critical issues are prioritized for resolution. Monitor high-severity bugs separately to ensure they are addressed quickly.
📉 Bug Resolution Efficiency
Evaluate the time taken to resolve bugs and the number of bugs fixed within specific timeframes. This helps identify areas where processes can be optimized and efficiency can be improved.
⚙️ Customizable KPIs
Customize the dashboard to track additional KPIs that are important to your team, such as the number of recurring bugs, defect density, or team-specific performance indicators.
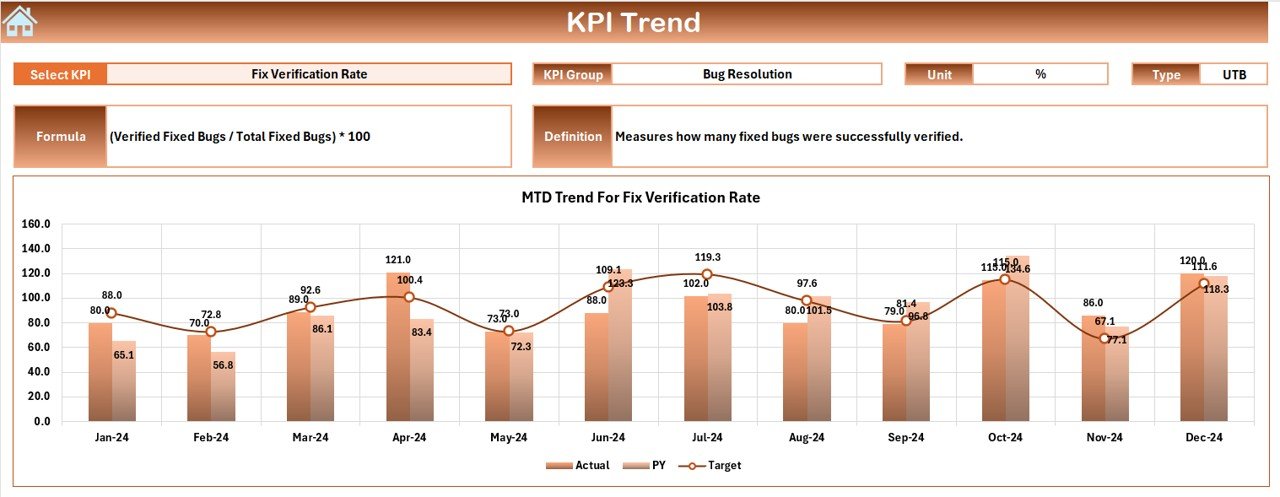
📊 Data Visualization
Get clear, easy-to-understand visualizations such as bar charts, pie charts, and trend graphs that provide instant insights into bug resolution performance and team effectiveness.
Why You’ll Love the Bug Resolution KPI Dashboard in Excel
✅ Gain Full Visibility into Bug Resolution
Track every aspect of your bug resolution process, including bug severity, time to resolve, and overall resolution efficiency.
✅ Identify Bottlenecks & Optimize Workflow
With time-based tracking and detailed performance metrics, easily identify bottlenecks and inefficiencies in your bug resolution process.
✅ Prioritize Critical Bugs
Classify and prioritize bugs based on severity, ensuring that your team addresses the most critical issues first, improving the quality and reliability of your software.
✅ Make Data-Driven Decisions
Leverage performance data to make informed decisions that drive improvements in your bug resolution process, enhance team productivity, and ensure higher-quality releases.
✅ Customizable to Your Needs
Tailor the dashboard to suit your team’s specific requirements. Add new KPIs, adjust classifications, and adapt the dashboard to reflect your bug resolution needs.
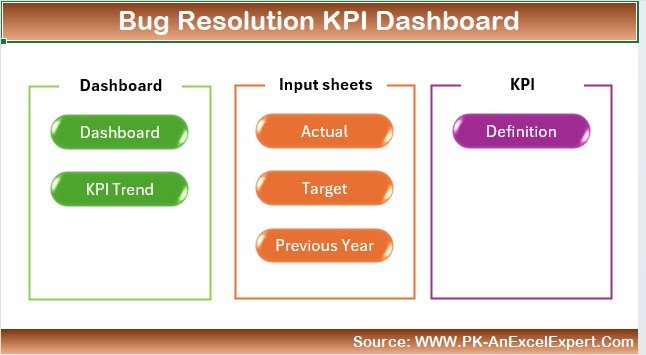
What’s Inside the Bug Resolution KPI Dashboard in Excel?
-
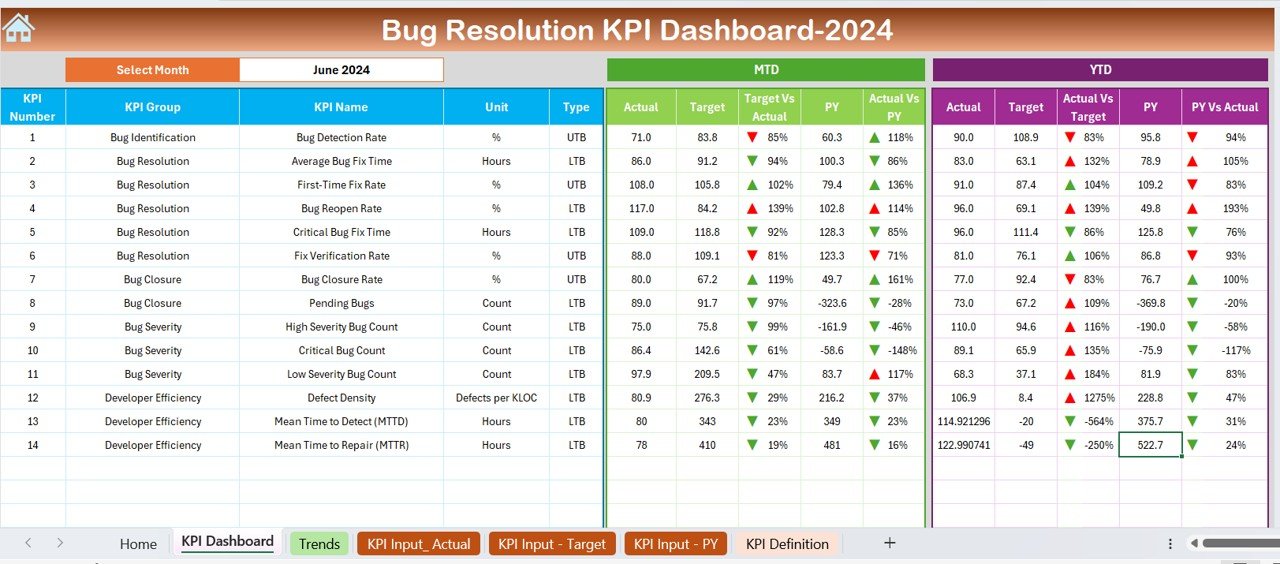
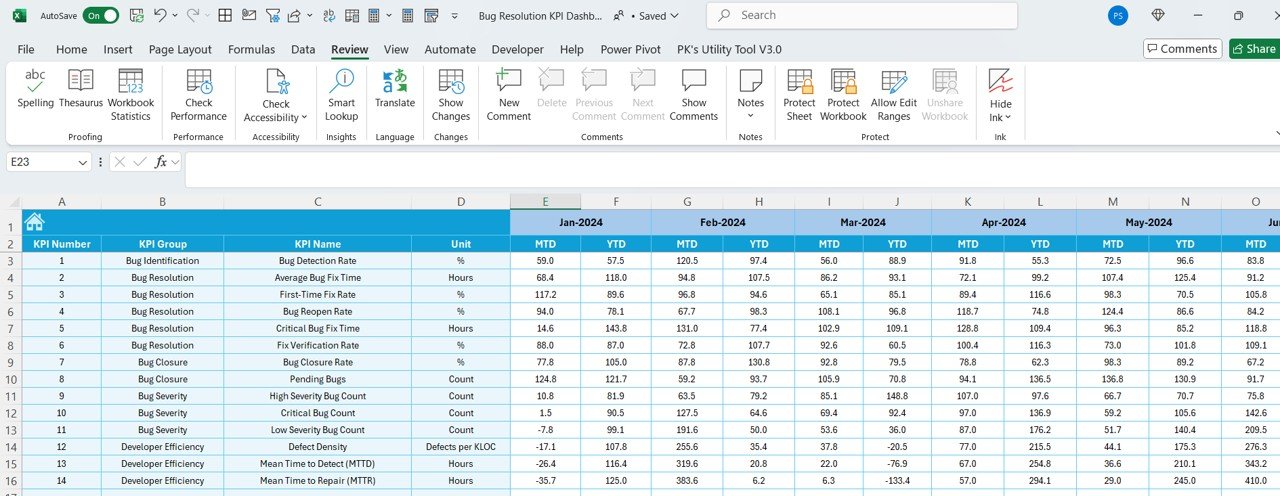
Bug Resolution Metrics Tracking: Monitor metrics like time to resolve, bug severity, and open/closed bugs.
-
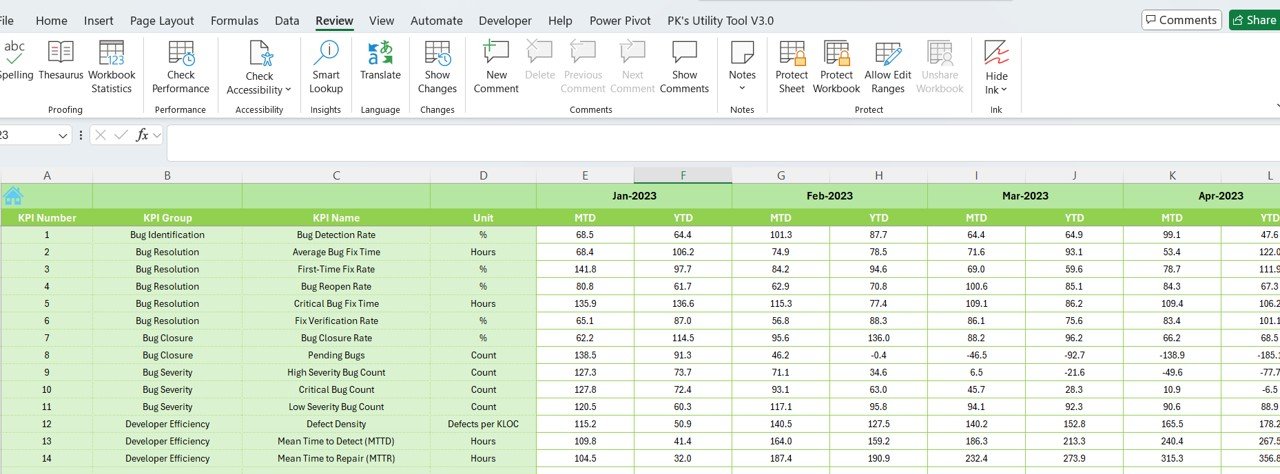
Time-Based Tracking: Analyze performance over various time periods to identify trends.
-
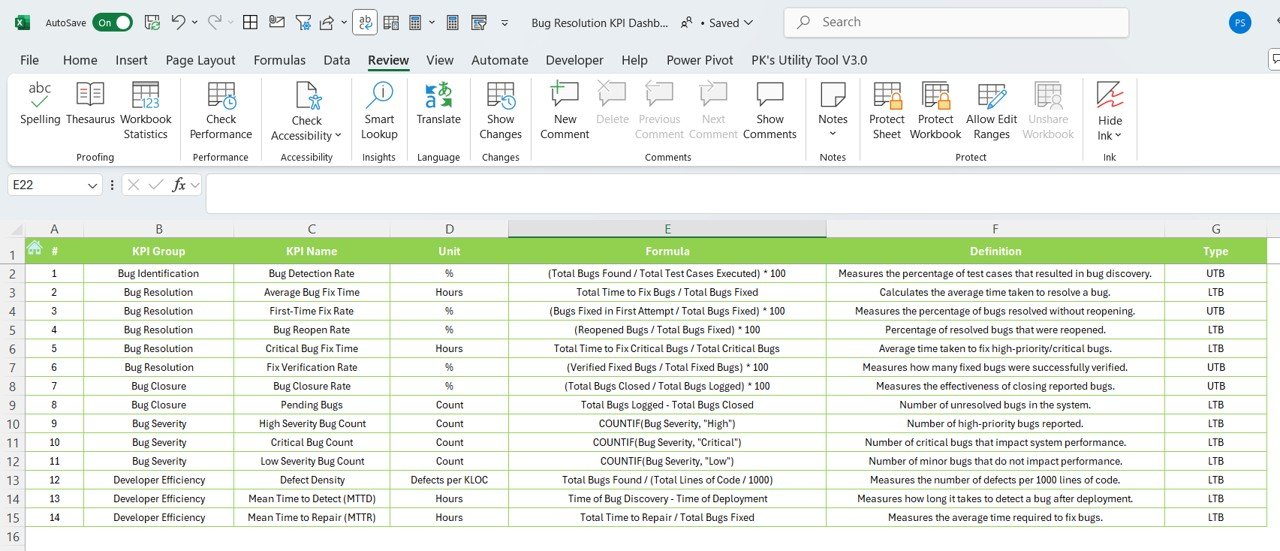
Bug Severity Classification: Prioritize bugs based on their severity for faster resolution.
-
Bug Resolution Efficiency: Track how effectively bugs are resolved within specific timeframes.
-
Customizable KPIs: Add custom KPIs to meet your specific bug resolution objectives.
-
Data Visualizations: Visualize performance metrics with clear and easy-to-understand charts.
How to Use the Bug Resolution KPI Dashboard in Excel
1️⃣ Download the Template: Get access to the Bug Resolution KPI Dashboard in Excel instantly.
2️⃣ Input Bug Data: Enter bug resolution details such as severity, resolution time, and status.
3️⃣ Track Resolution Metrics: Monitor key metrics like time to resolve, severity, and performance trends.
4️⃣ Classify Bugs by Severity: Use the severity classification to prioritize bugs.
5️⃣ Generate Reports & Analyze Trends: Use time-based analysis to track progress and identify areas for improvement.
Who Can Benefit from the Bug Resolution KPI Dashboard in Excel?
🔹 Software Development Teams
🔹 Quality Assurance (QA) Teams
🔹 Project Managers & Team Leads
🔹 IT & Technical Support Teams
🔹 Software Engineers & Developers
🔹 Businesses & Organizations Using Custom Software
🔹 Companies Looking to Improve Software Quality
Ensure efficient bug resolution and optimize your software development process with the Bug Resolution KPI Dashboard in Excel. Track and manage bugs, improve response times, and increase software quality—all in one dashboard.
Click here to read the Detailed blog post
Visit our YouTube channel to learn step-by-step video tutorials
Youtube.com/@PKAnExcelExpert


Reviews
There are no reviews yet.