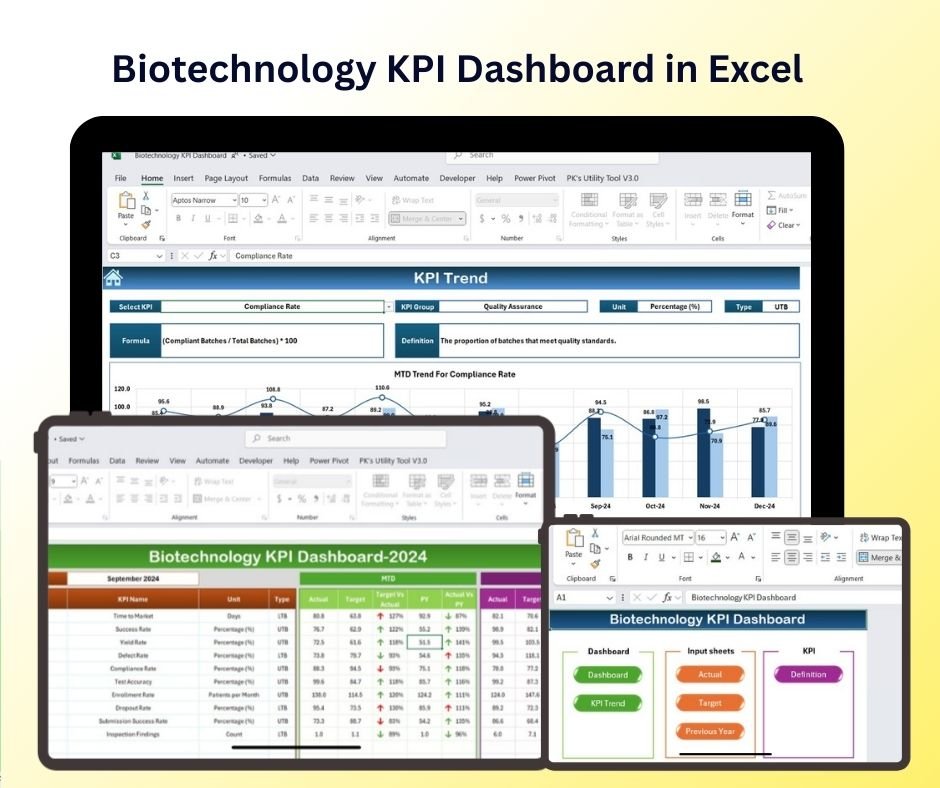
The Biotechnology KPI Dashboard in Excel is an essential tool for biotechnology companies to track, analyze, and optimize their key performance indicators (KPIs). Whether you are managing research and development (R&D) efforts, monitoring production processes, or tracking compliance and regulatory standards, this dashboard provides a comprehensive and real-time overview of the most crucial metrics in the biotechnology industry.
With customizable features, real-time updates, and visual charts, this Excel-based dashboard helps biotech professionals, managers, and business owners make data-driven decisions, streamline operations, and ensure that their R&D projects, manufacturing processes, and product launches stay on track and meet industry standards.
Key Features of the Biotechnology KPI Dashboard in Excel:
📊 Comprehensive KPI Tracking
Track critical KPIs such as R&D performance, production efficiency, regulatory compliance, cost management, and product yield—all in one dashboard.
📈 Real-Time Monitoring
Monitor the performance of R&D projects, production processes, and regulatory compliance in real time, ensuring your biotechnology business stays aligned with its objectives.
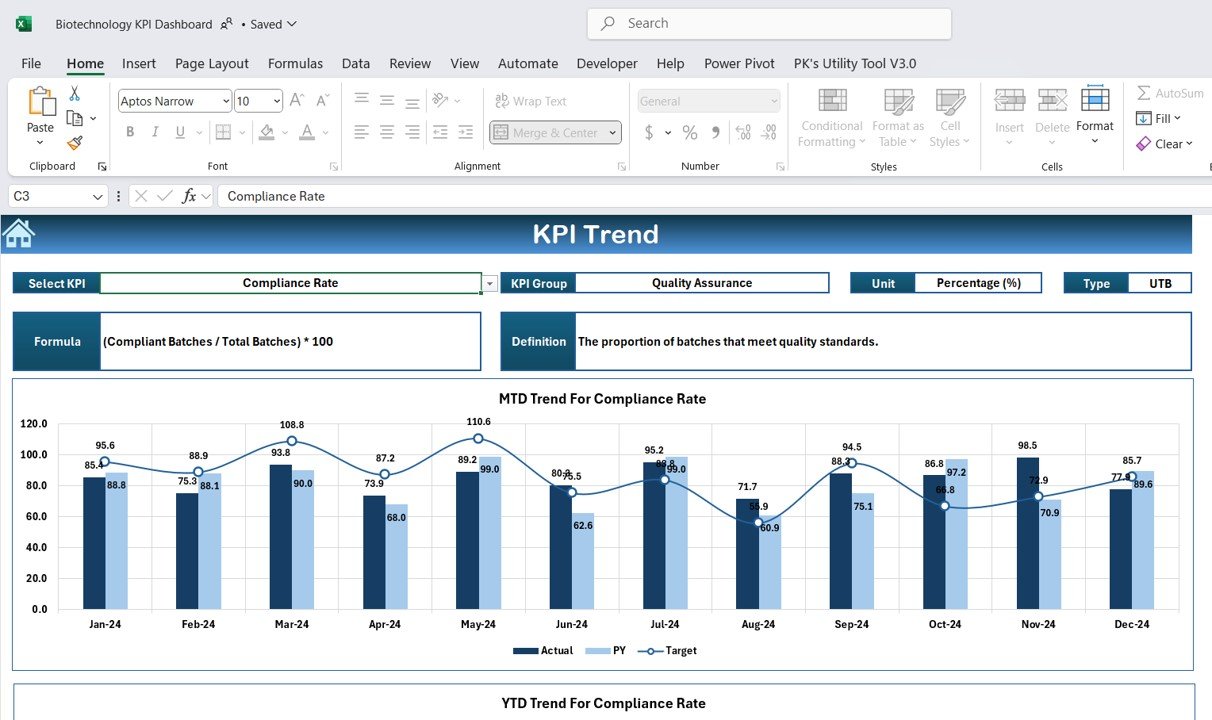
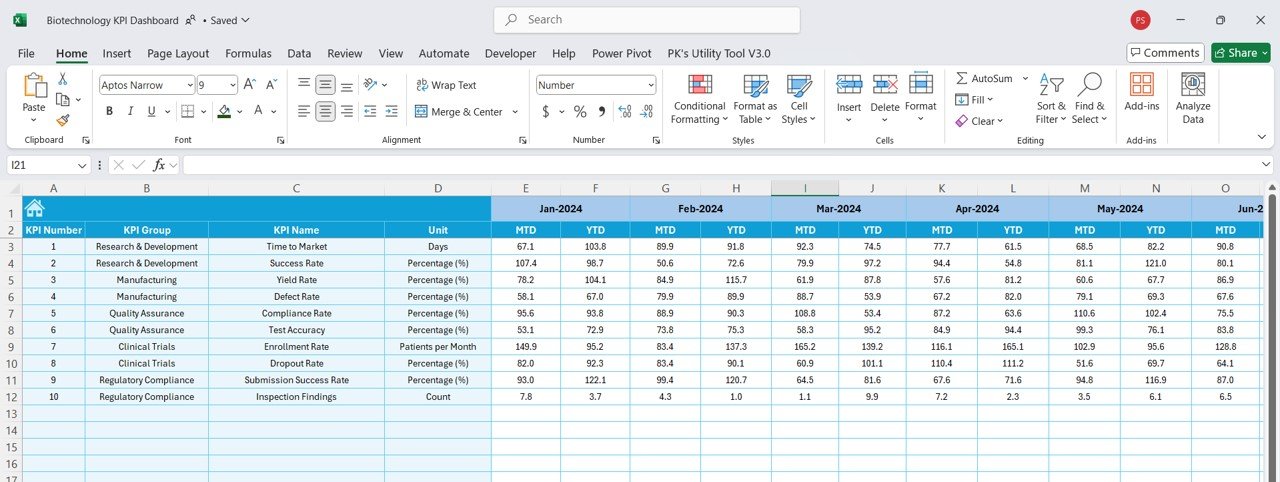
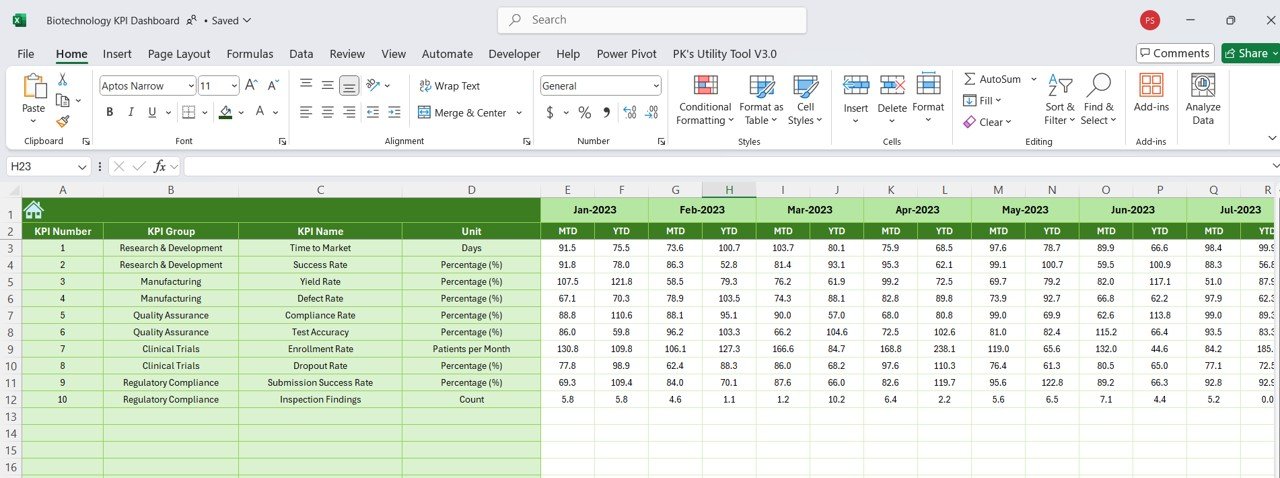
📅 Month-to-Date (MTD) and Year-to-Date (YTD) Performance
Track performance over various periods, comparing current data to previous months and years, to analyze trends and identify growth opportunities.
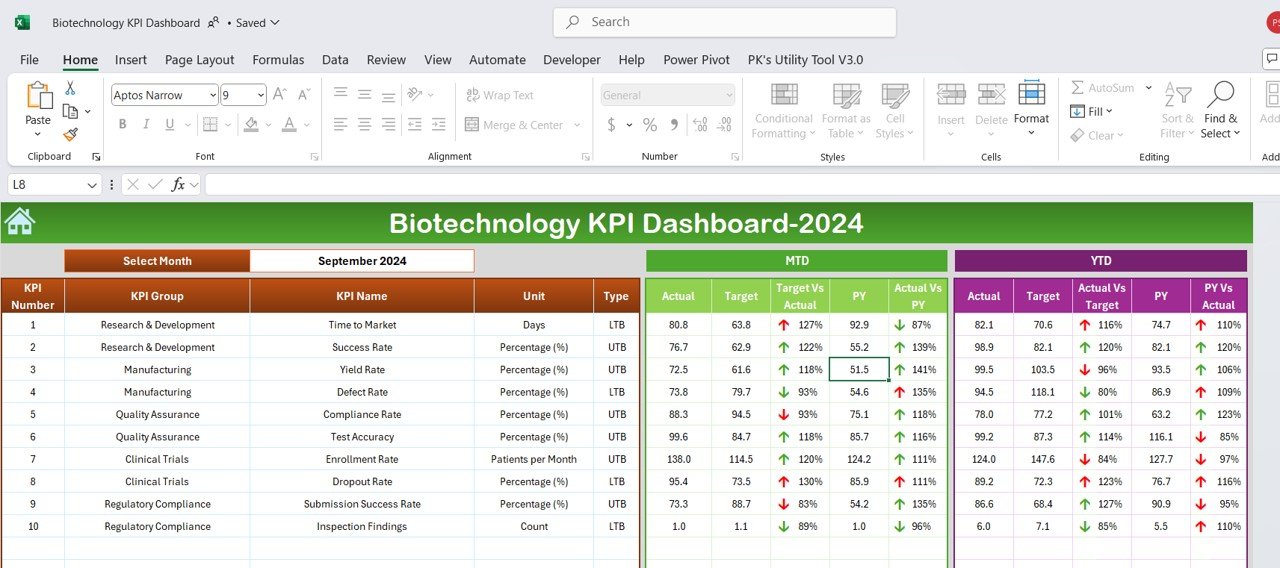
🎯 Goal Setting and Performance Comparison
Set specific targets for each KPI and compare actual performance against these targets, ensuring your biotechnology operations remain efficient and effective.
🛠 Customizable Inputs
Easily input your data such as R&D progress, production costs, product quality, and regulatory compliance metrics, while customizing the dashboard to fit your specific business needs.
🔔 Conditional Formatting Alerts
Receive color-coded alerts for underperforming areas such as low R&D output, production delays, or missed compliance standards, enabling your team to act quickly.
🔬 R&D and Production Insights
Track the progress of R&D projects, product development, and manufacturing performance to ensure that your biotechnology products are delivered on time, meet quality standards, and achieve the desired results.
🚀 Why You’ll Love the Biotechnology KPI Dashboard in Excel:
✅ Track R&D Progress – Monitor the development of biotechnology products, ensuring that key milestones are met and projects stay on schedule.
✅ Optimize Production Processes – Track the efficiency of production processes and ensure that product yield and quality are optimized.
✅ Ensure Regulatory Compliance – Stay on top of industry regulations and compliance requirements to avoid delays and penalties.
✅ Improve Cost Management – Track R&D costs, production costs, and other expenses to ensure that your biotechnology projects are cost-effective.
✅ User-Friendly Interface – Designed for ease of use, this dashboard allows professionals with limited technical skills to input data, track performance, and interpret results.
✅ Fully Customizable – Tailor the dashboard to your biotechnology company’s unique needs, whether you are tracking R&D, manufacturing, or regulatory performance.
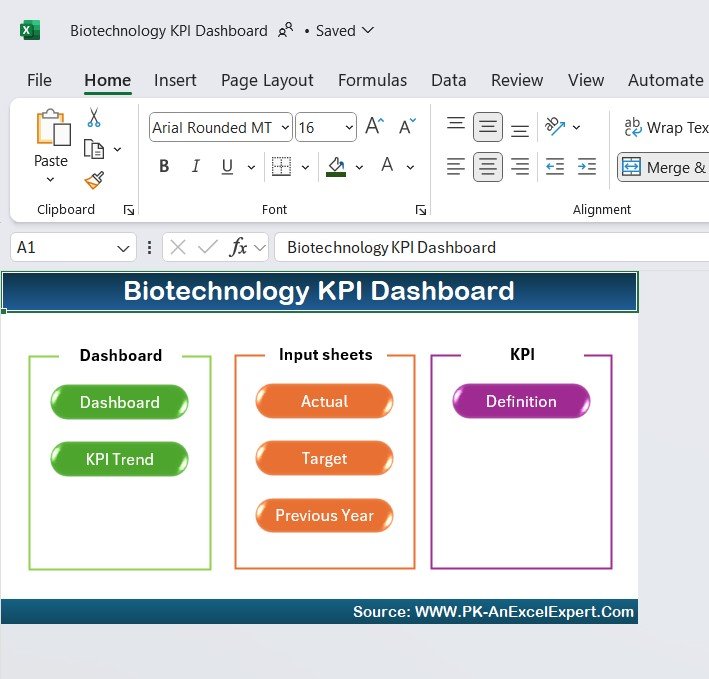
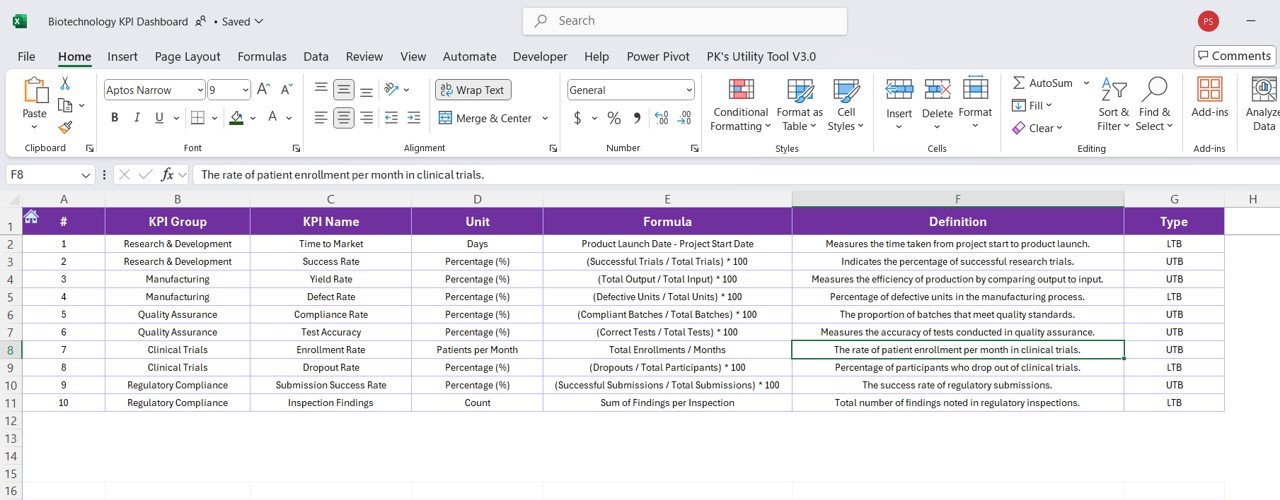
What’s Inside the Biotechnology KPI Dashboard in Excel:
- R&D Performance KPI: Track progress in your research and development projects, including completion of milestones, testing results, and new product innovations.
- Production Efficiency KPI: Measure the efficiency of your biotechnology production processes, including production volume, yield, and waste reduction.
- Regulatory Compliance KPI: Monitor compliance with industry regulations such as FDA or EMA guidelines to ensure your products meet safety and quality standards.
- Cost Management KPI: Track costs associated with R&D, production, and product testing to ensure that budgets are adhered to and that projects remain cost-effective.
- Product Yield KPI: Track the yield of biotechnology products, such as pharmaceutical drugs or bio-engineered products, ensuring that production meets demand.
- Time-to-Market KPI: Measure how quickly new biotechnology products reach the market, helping you optimize product development timelines.
How to Use the Biotechnology KPI Dashboard in Excel:
1️⃣ Download the Template – Get instant access to the Excel dashboard upon purchase.
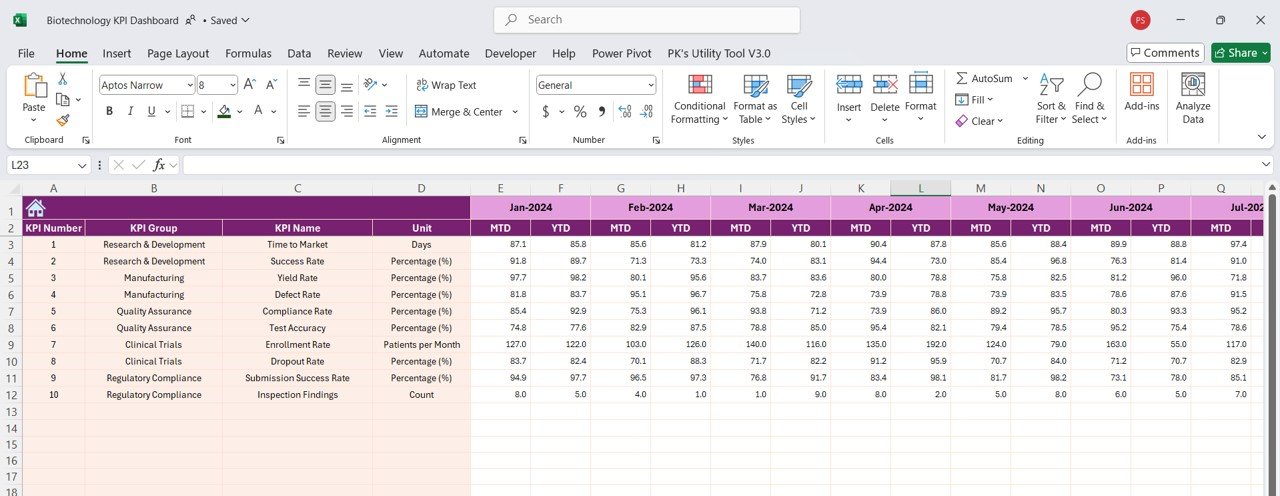
2️⃣ Input Your Data – Enter your R&D progress, production data, compliance reports, and cost information into the pre-designed fields.
3️⃣ Set Targets – Define your KPIs for R&D, production, compliance, and cost management to guide your biotechnology business.
4️⃣ Monitor Progress – Track your KPIs in real-time to ensure that your biotechnology projects are on track.
5️⃣ Generate Reports – Use the dashboard to generate detailed reports for management reviews, regulatory submissions, or team meetings.
Who Can Benefit from the Biotechnology KPI Dashboard in Excel:
- R&D Managers
- Production Managers
- Biotechnology Business Owners
- Compliance Officers
- Regulatory Affairs Managers
- Financial Analysts
- Product Managers
- Lab Directors
The Biotechnology KPI Dashboard in Excel is the perfect tool for any biotechnology company looking to optimize R&D, manufacturing, and regulatory compliance to achieve business success.
Click here to read the Detailed blog post
https://www.pk-anexcelexpert.com/biotechnology-kpi-dashboard-in-excel/
Visit our YouTube channel to learn step-by-step video tutorials
Youtube.com/@PKAnExcelExpert


Reviews
There are no reviews yet.