The ATM Network KPI Dashboard in Excel is a powerful tool designed to help banks, financial institutions, and ATM operators efficiently track and analyze key performance indicators (KPIs) related to ATM networks. This Excel-based dashboard provides an intuitive way to monitor metrics such as transaction volumes, uptime, cash replenishment, and maintenance schedules, ensuring that your ATM network operates efficiently and meets customer needs.
By using this dashboard, you can gain valuable insights into the health of your ATM network, identify performance gaps, optimize resource allocation, and reduce downtime. The user-friendly interface and customizable features make it an essential tool for managing large-scale ATM networks and improving overall operational efficiency.
Key Features of the ATM Network KPI Dashboard in Excel
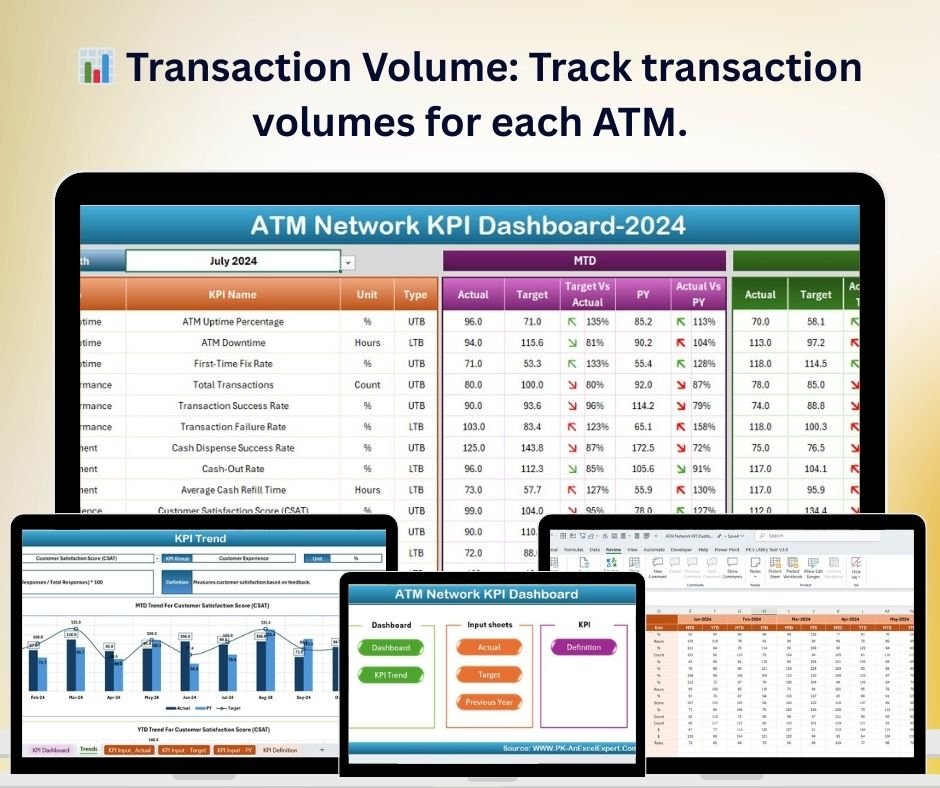
📊 Transaction Volume Tracking
Monitor the number of transactions processed by each ATM. Track daily, weekly, and monthly volumes to identify trends and optimize ATM placement and servicing.
🔧 Uptime & Downtime Monitoring
Track the uptime and downtime of each ATM machine. Use this data to minimize service disruptions, improve machine availability, and ensure customer satisfaction.
💵 Cash Replenishment Tracking
Monitor cash replenishment schedules and ensure that ATMs are stocked with the required cash levels. Track cash usage and optimize replenishment timing to avoid cash shortages.
⚙️ Maintenance & Service Tracking
Track ATM maintenance activities, including scheduled servicing, repairs, and issue resolution. Use this feature to reduce machine downtime and ensure consistent ATM performance.
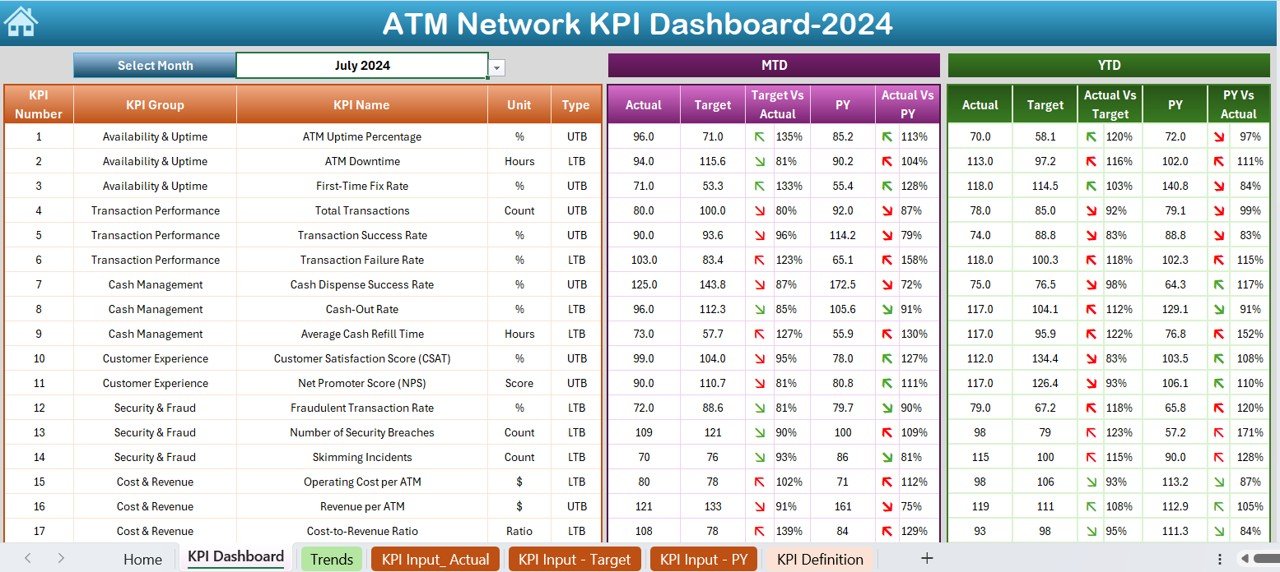
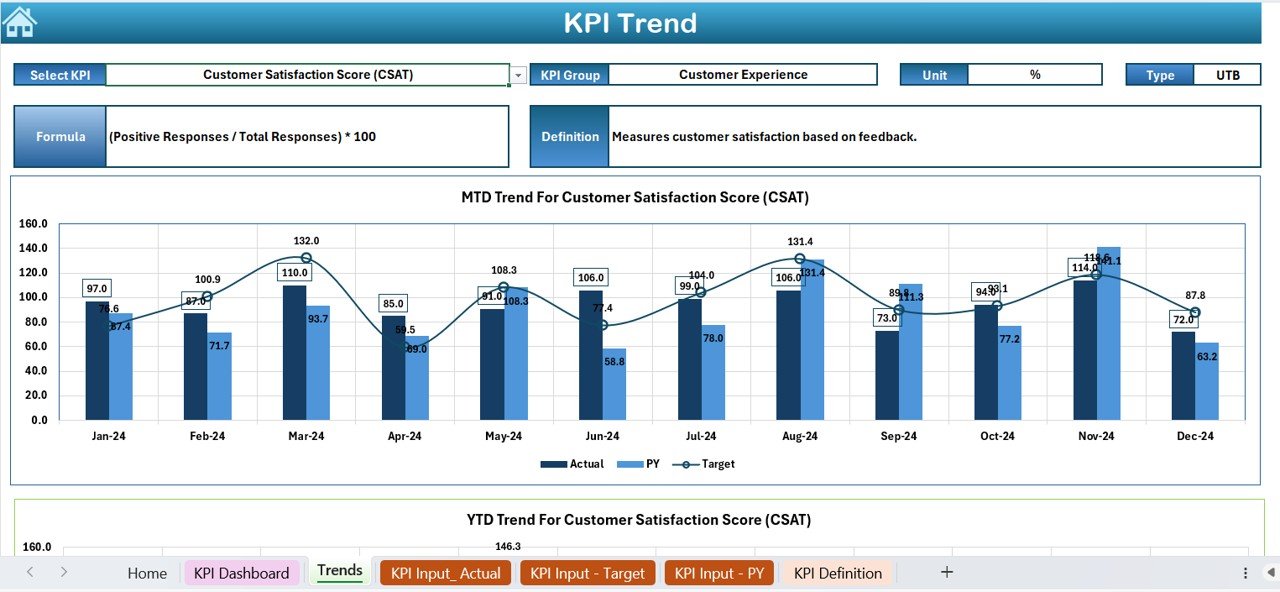
📈 Performance Analysis & Reporting
Analyze key performance metrics such as transaction volume, machine uptime, and service response time. Generate reports to track overall ATM network performance and identify areas for improvement.
⚙️ Customizable & Scalable
The dashboard is fully customizable, allowing you to add or modify KPIs that are specific to your ATM network. It’s scalable to meet the needs of small networks or large-scale operations.
Why You’ll Love the ATM Network KPI Dashboard in Excel
✅ Track ATM Performance in Real-Time
Monitor transaction volumes, uptime, and maintenance schedules to ensure your ATMs are performing optimally. Use real-time data to quickly address issues and improve service levels.
✅ Minimize Downtime & Optimize Availability
Track ATM downtime and identify common service issues to reduce machine downtime and improve availability, ensuring customers always have access to your ATMs.
✅ Enhance Cash Management & Replenishment
Monitor cash usage across your ATM network to optimize cash replenishment schedules. Ensure that ATMs are stocked with enough cash to meet demand and reduce cash-out situations.
✅ Improve Maintenance & Service Efficiency
Track maintenance and service requests to ensure timely resolution of issues and improve the overall health of your ATM machines. Prevent costly repairs by proactively addressing issues before they escalate.
✅ Data-Driven Decision Making
Leverage the insights from the dashboard to make data-driven decisions about ATM network management. Identify trends, optimize resources, and enhance customer satisfaction.
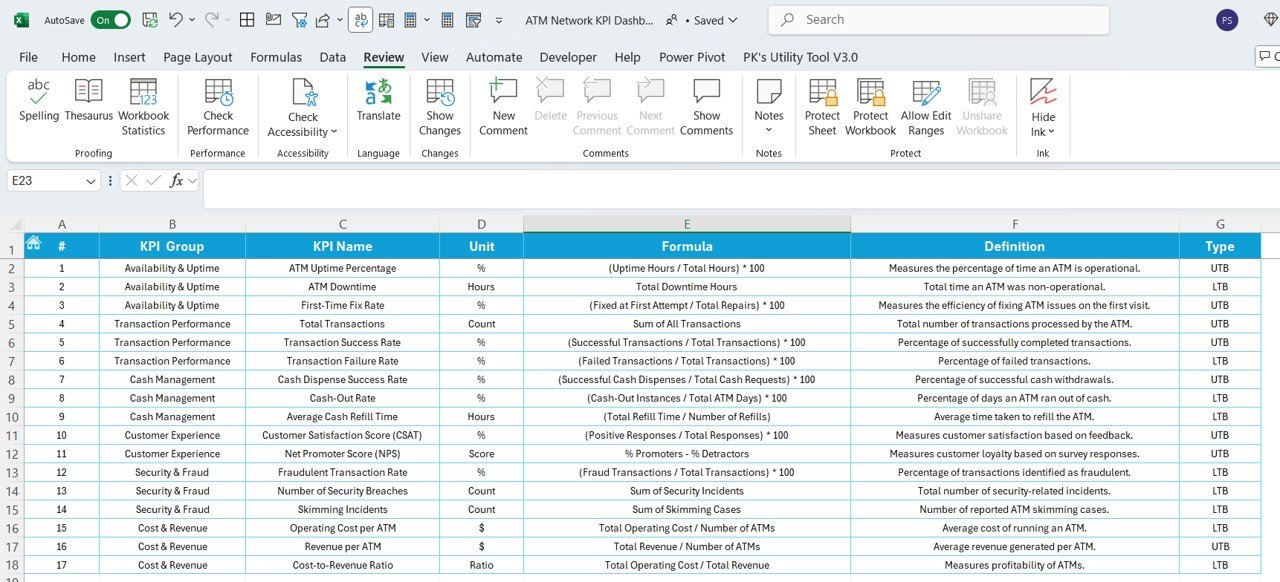
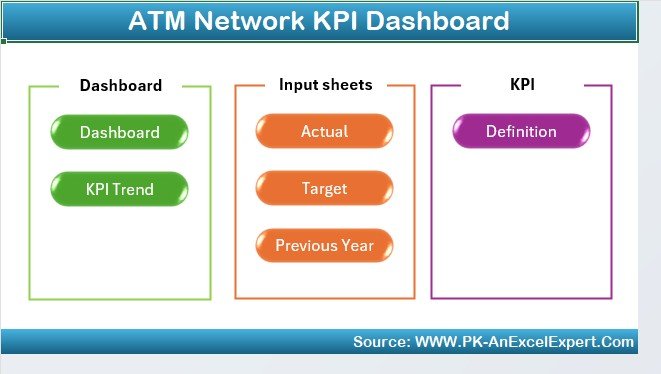
What’s Inside the ATM Network KPI Dashboard in Excel?
-
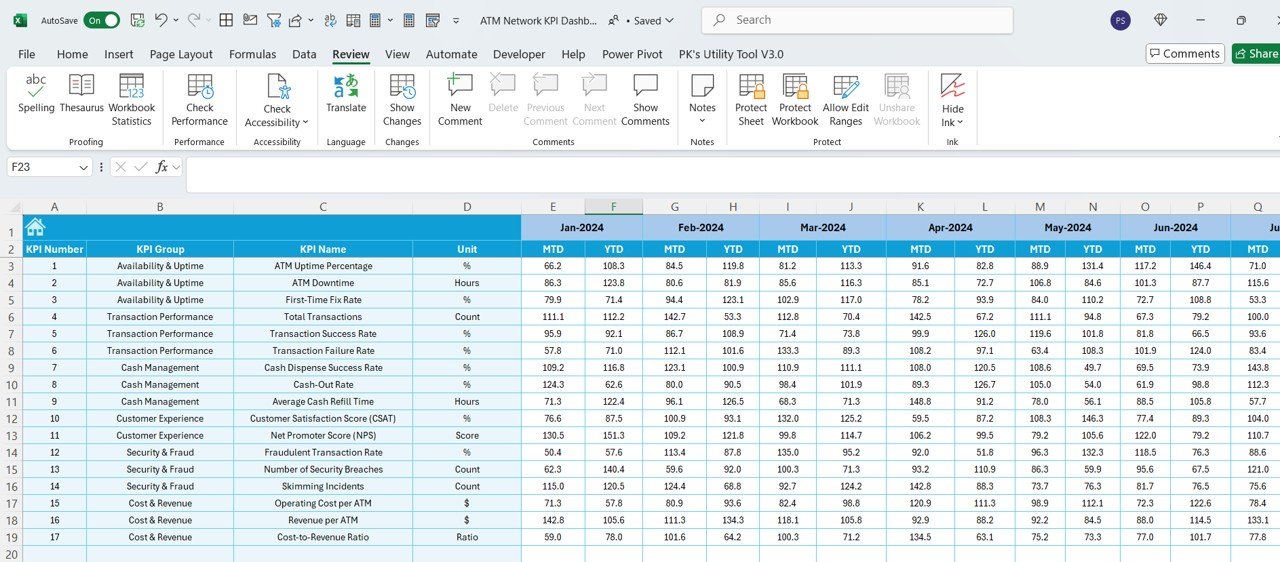
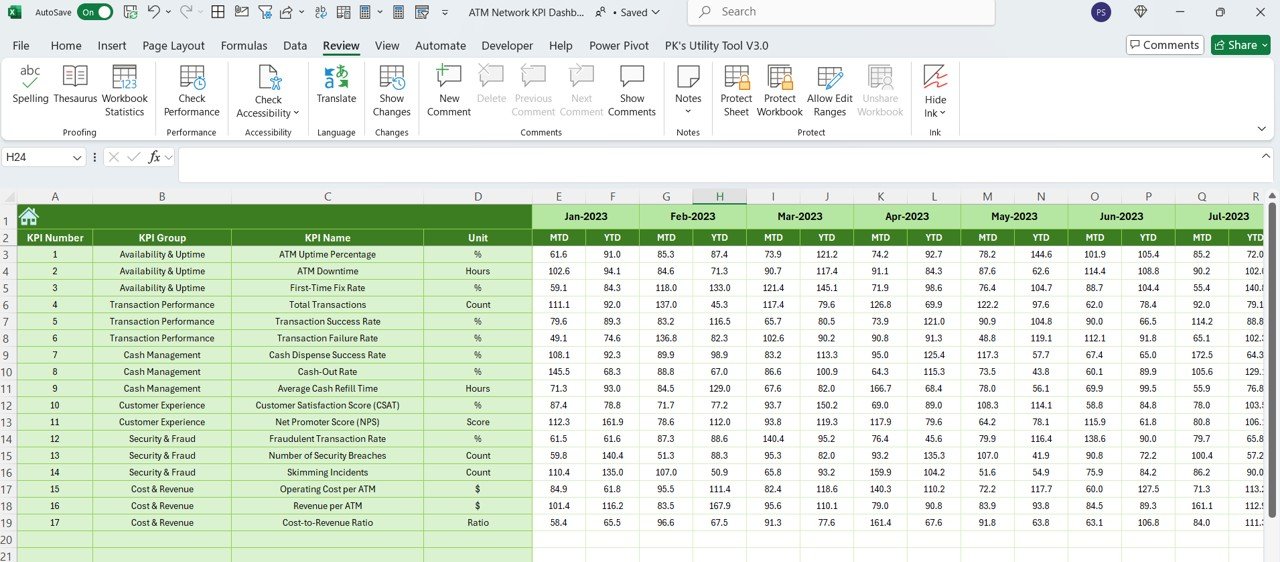
Transaction Volume Tracking: Track the number of transactions processed by each ATM.
-
Uptime & Downtime Monitoring: Monitor machine availability and downtime for each ATM.
-
Cash Replenishment Tracking: Ensure ATMs are stocked with the appropriate cash.
-
Maintenance & Service Tracking: Track scheduled maintenance and repairs for each ATM.
-
Performance Reporting & Analytics: Analyze ATM performance and generate reports.
-
Customizable Features: Tailor the dashboard to track additional KPIs or metrics as needed.
How to Use the ATM Network KPI Dashboard in Excel
1️⃣ Download the Template: Get instant access to the ATM Network KPI Dashboard in Excel.
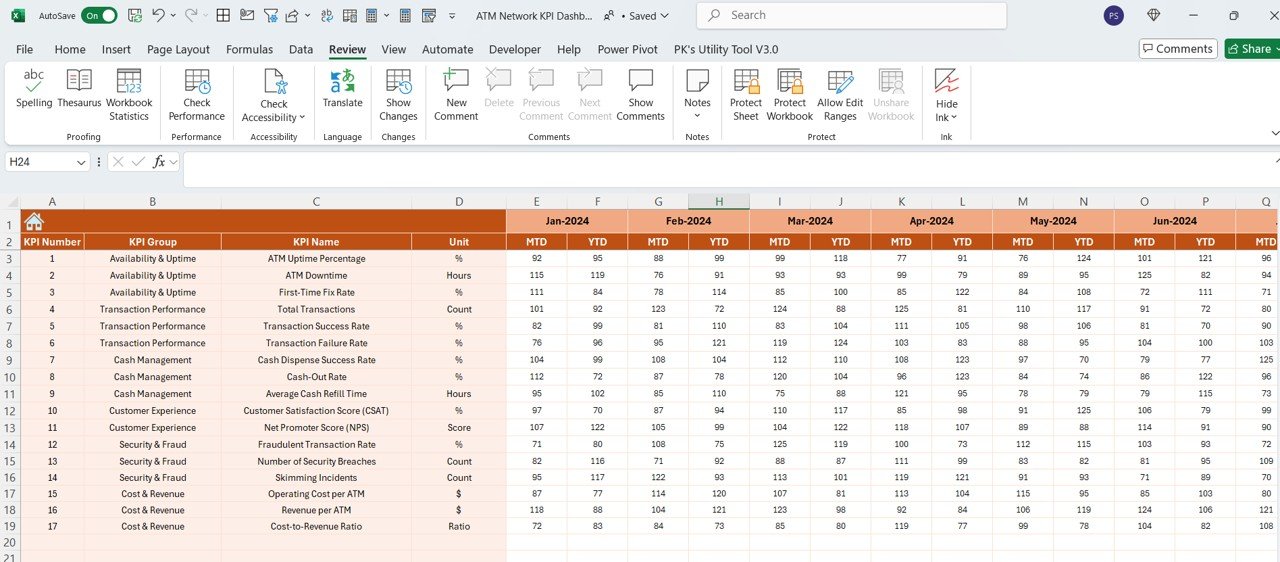
2️⃣ Input Data: Enter data for each ATM, such as transaction volume, uptime, and cash levels.
3️⃣ Track KPIs: Monitor key metrics like transaction volumes, cash replenishment, and maintenance status.
4️⃣ Analyze Data & Performance: Use the dashboard to track trends, identify bottlenecks, and improve performance.
5️⃣ Optimize Operations: Use the insights to optimize ATM placement, cash management, and maintenance scheduling.
Who Can Benefit from the ATM Network KPI Dashboard in Excel?
🔹 ATM Operators & Managers
🔹 Financial Institutions & Banks
🔹 ATM Service Providers
🔹 Operations & Maintenance Teams
🔹 Business Analysts & Data Analysts
🔹 Large-Scale ATM Network Operators
🔹 Customer Experience & Service Teams
Ensure that your ATM network runs smoothly, efficiently, and profitably with the ATM Network KPI Dashboard in Excel. Optimize transaction volumes, reduce downtime, and streamline cash management and maintenance processes with this powerful tool.
Click here to read the Detailed blog post
Visit our YouTube channel to learn step-by-step video tutorials
Youtube.com/@PKAnExcelExpert


Reviews
There are no reviews yet.