Managing business assets efficiently is critical for financial planning, operational readiness, and long-term cost control. Whether your organization handles machinery, IT equipment, office assets, or field resources, you must track asset usage, condition, depreciation, and book value accurately. Emails and simple spreadsheets often fall short. That’s why the Asset Utilization & Status Dashboard in Google Sheets is the perfect solution for modern asset management teams.Asset Utilization & Status Dashboard in Google Sheets
This ready-to-use dashboard gives you real-time visibility into your asset inventory, vendor reliability, location-based distribution, department-level usage, and monthly value trends—all in one clean, interactive workspace. Designed for finance teams, operations managers, facility departments, and asset controllers, this dashboard transforms scattered asset records into a structured and visual system that supports faster and smarter decision-making.Asset Utilization & Status Dashboard in Google Sheets
✨ Key Features of the Asset Utilization & Status Dashboard in Google Sheets
📊 1. Complete Asset Visibility
Gain instant clarity of your entire asset ecosystem. View total assets, active counts, depreciation, warranty status, net book value, and cost breakdowns—all updated automatically when you edit your data.Asset Utilization & Status Dashboard in Google Sheets
💰 2. Financial Insight & Depreciation Tracking
Monitor depreciation trends, book value changes, and asset aging over time. This helps your finance team stay audit-ready and make accurate budget decisions.Asset Utilization & Status Dashboard in Google Sheets
📍 3. Department & Location Analysis
Analyze how assets are distributed across departments and locations. Identify high-consumption departments, low-performing regions, and areas that need replacement or upgrades.
🤝 4. Vendor Performance Analytics
Compare vendors based on warranty status, depreciation, asset cost, and inactive counts. This helps you evaluate vendor quality and negotiate better procurement deals.
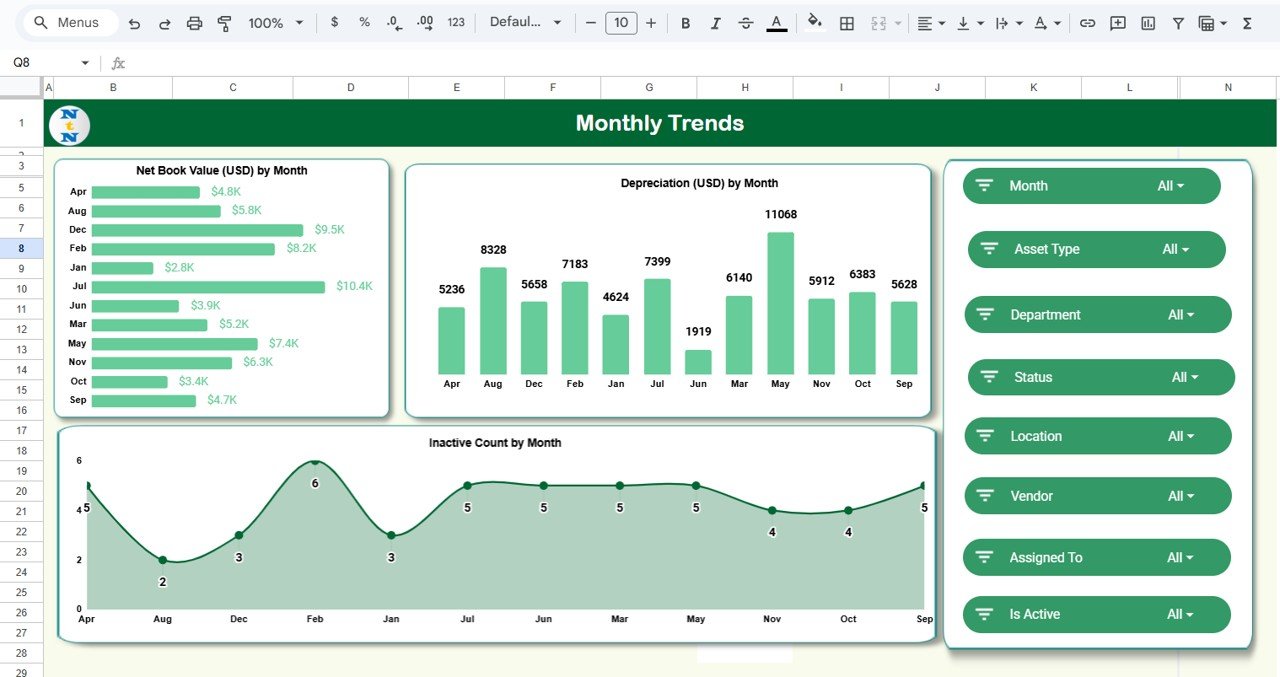
📈 5. Monthly Trend Visualization
Track how net book value, depreciation, and inactive counts fluctuate each month. These insights help organizations understand seasonal variations and plan upcoming asset investments.
📦 What’s Inside the Asset Utilization & Status Dashboard in Google Sheets
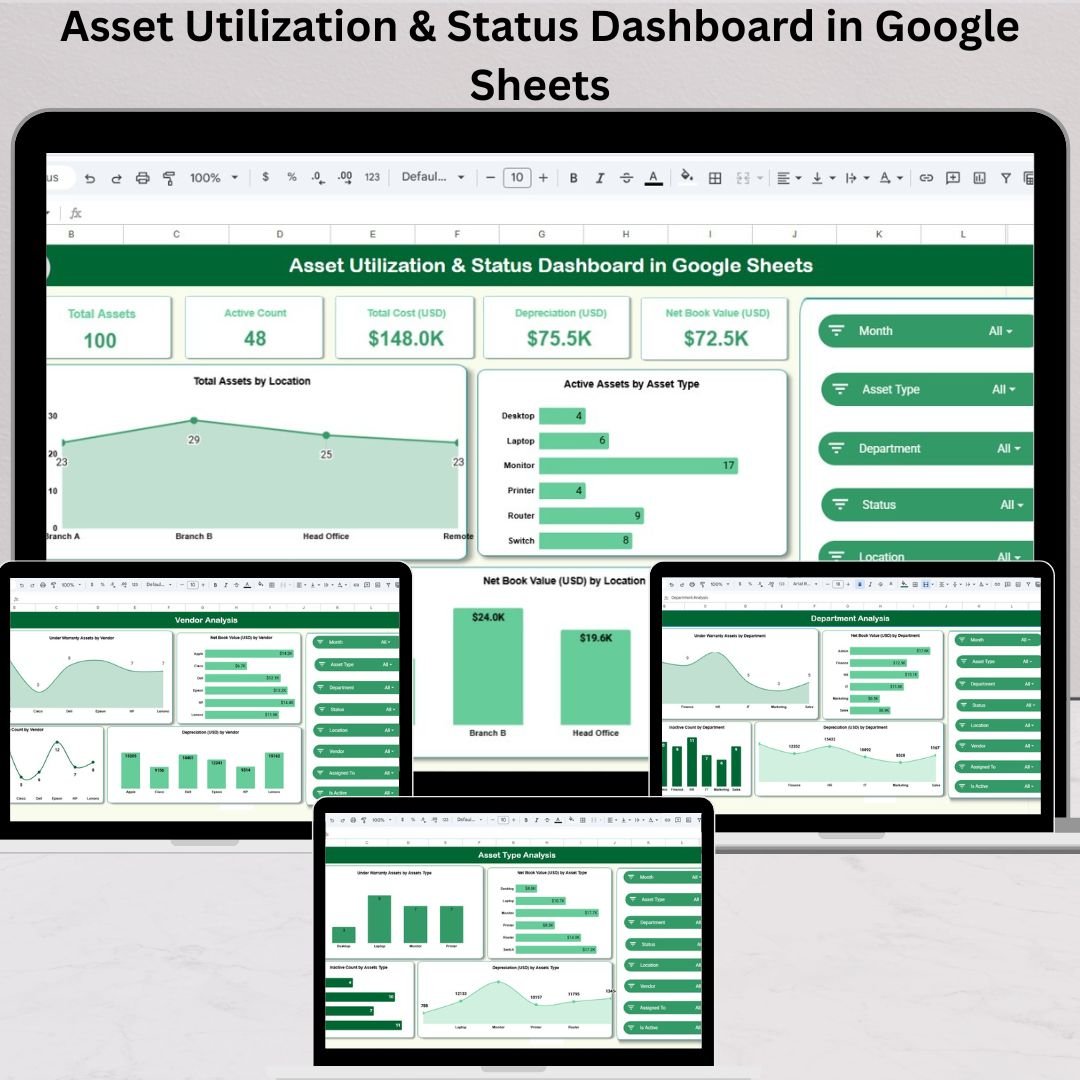
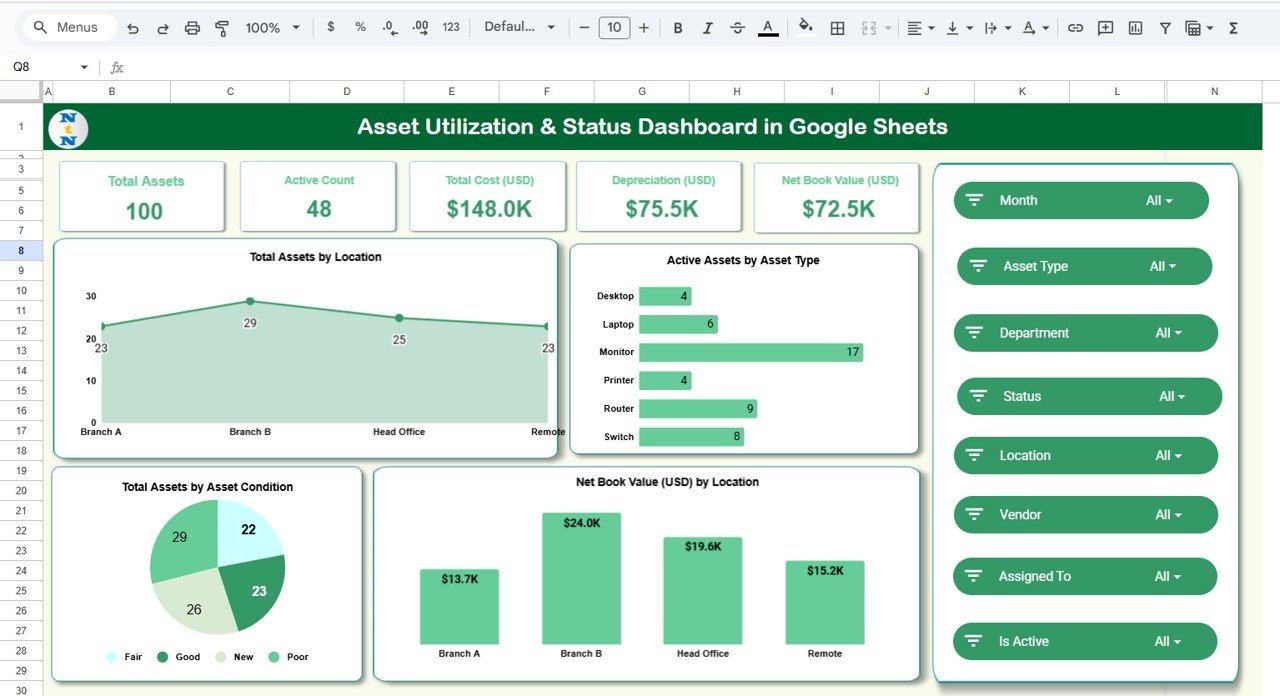
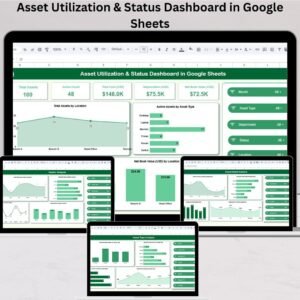
📊 1. Overview Sheet – Main Dashboard
This sheet shows a complete summary of asset performance.
Dashboard Cards:
-
Total Assets
-
Active Count
-
Total Cost (USD)
-
Depreciation (USD)
-
Net Book Value (USD)
Dashboard Charts:
-
Active Assets by Asset Type
-
Total Assets by Location
-
Net Book Value by Location
-
Total Assets by Asset Condition
These visuals help you quickly identify asset concentration, value distribution, and condition across the organization.
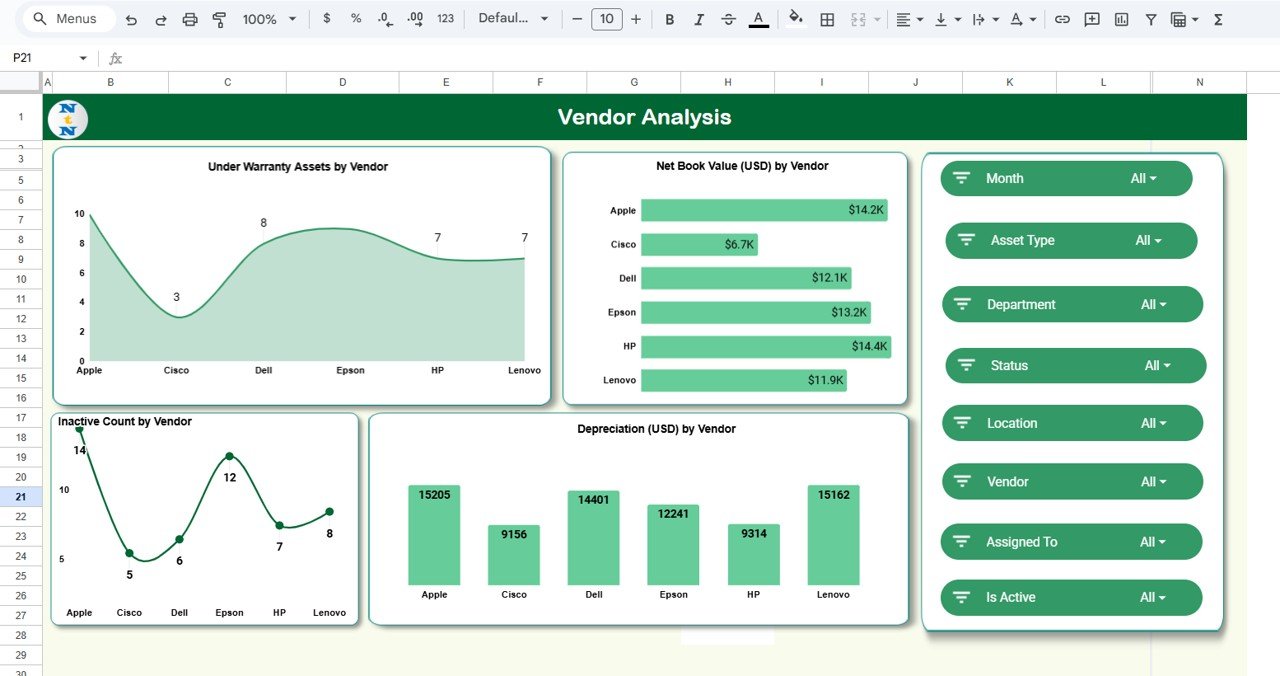
🤝 2. Vendor Analysis Sheet – Supplier Performance Insights
This section allows you to compare asset performance by vendor through charts such as:
-
Under Warranty Assets by Vendor
-
Net Book Value by Vendor
-
Depreciation by Vendor
-
Inactive Count by Vendor
It highlights supplier reliability and helps you choose vendors who deliver long-lasting and high-performance assets.
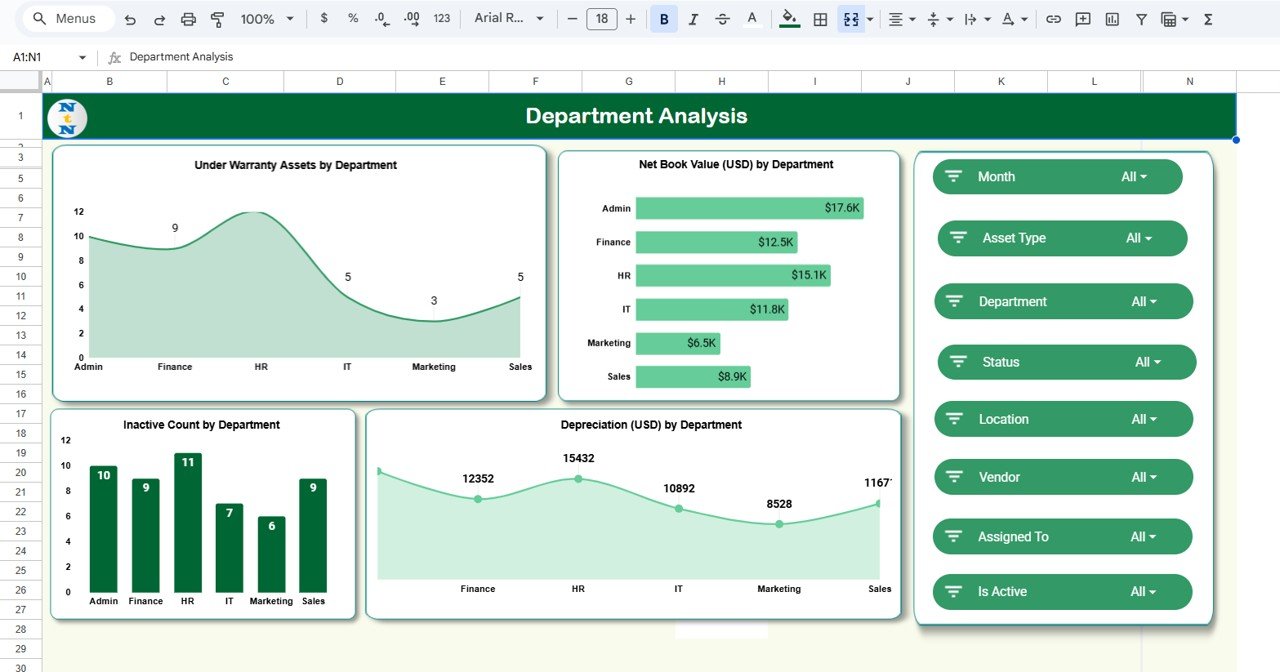
🏢 3. Department Analysis Sheet – Team-wise Usage
Track asset distribution and consumption across departments with charts for:
-
Under Warranty Assets
-
Net Book Value
-
Depreciation
-
Inactive Count
This helps operational teams plan replacements, upgrades, and maintenance more effectively.
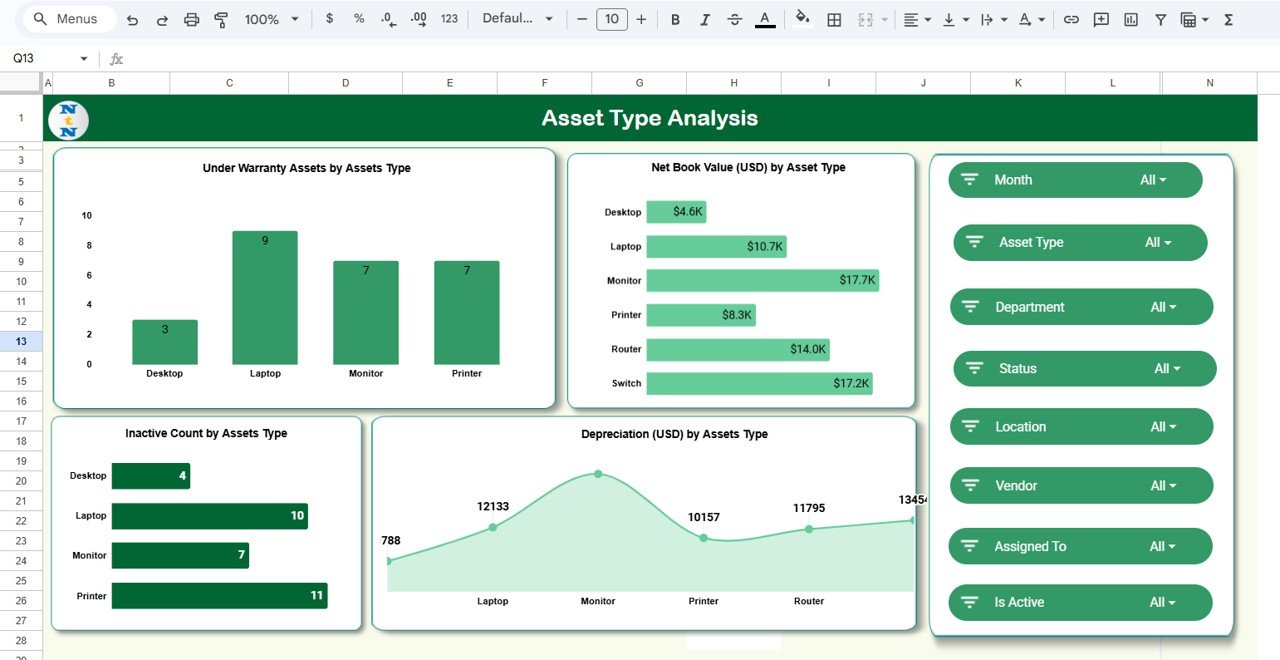
📂 4. Asset Type Analysis – Category Performance
This sheet analyzes asset utilization based on category. Charts include:
-
Under Warranty Assets by Asset Type
-
Net Book Value by Asset Type
-
Depreciation by Asset Type
-
Inactive Count by Asset Type
It helps identify high-value assets, aging categories, and items needing disposal or repair.
📅 5. Monthly Trends Sheet – Value Over Time
Track monthly changes through charts that display:
-
Net Book Value by Month
-
Depreciation by Month
-
Inactive Count by Month
These insights support long-term planning and budget forecasting.
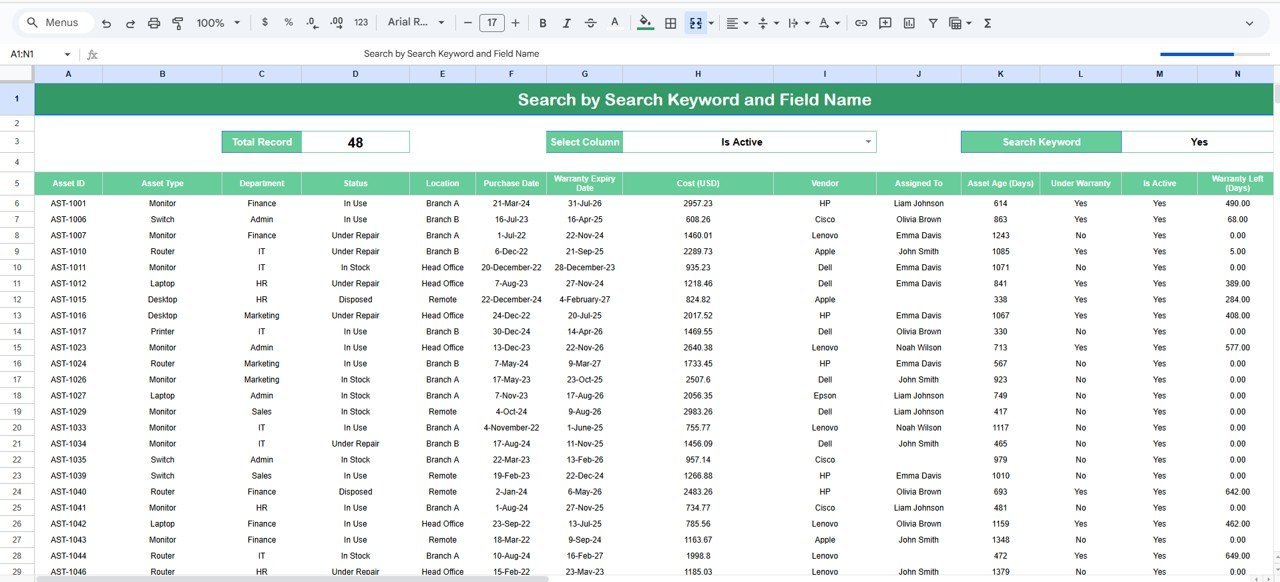
🔍 6. Search Sheet – Instant Asset Lookup
Search by keyword or select a field such as Asset ID, Department, Vendor, Location, Condition, or Status. This feature saves time and eliminates manual scanning across large data sets.
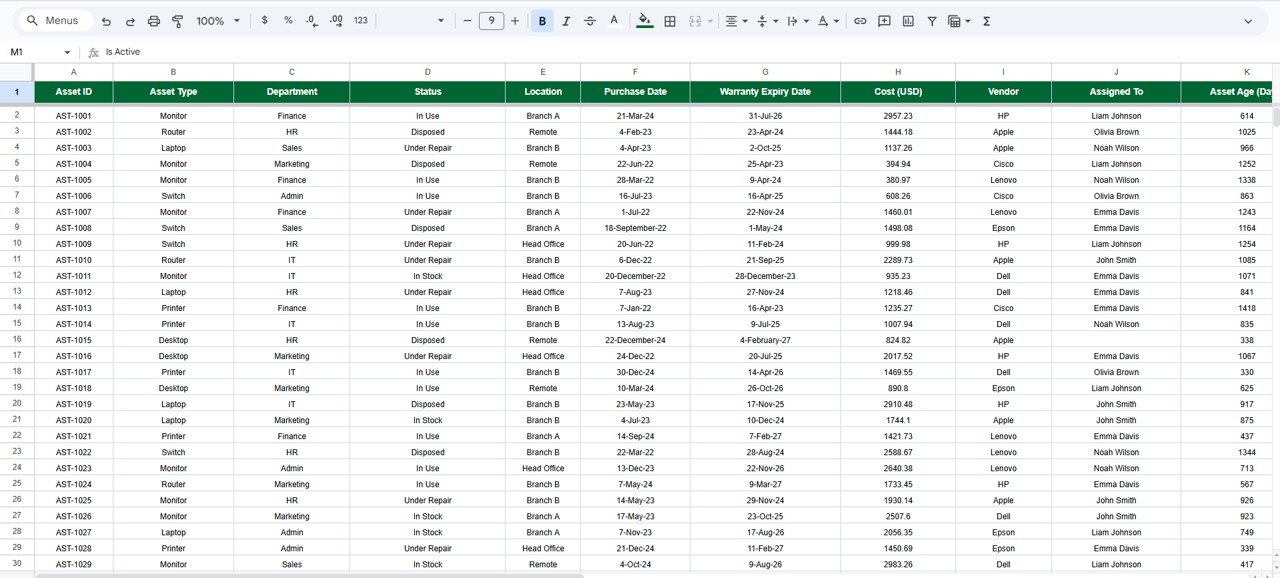
📝 7. Data Sheet – Master Database
This sheet stores complete asset information including:
-
Asset ID
-
Asset Type
-
Vendor
-
Department
-
Location
-
Purchase Date
-
Cost
-
Depreciation
-
Warranty Expiry
-
Condition
-
Status
-
Net Book Value
All dashboards and charts automatically update using this data.
🎯 Who Can Benefit from This Asset Utilization & Status Dashboard in Google Sheets
🏢 Facility Managers
Track asset conditions, usage, and maintenance needs easily.
💼 Finance & Accounting Teams
Monitor cost, depreciation, and book value for accurate reporting.
👨💻 IT & Operations Teams
Understand asset distribution and optimize resource allocation.
🏭 Manufacturing & Industrial Teams
Analyze equipment performance, vendor reliability, and asset lifecycle.
📦 Procurement Teams
Compare vendors and plan purchases strategically.


Reviews
There are no reviews yet.