
Managing an animal shelter effectively requires constant visibility into operations, from adoptions and medical checkups to volunteer contributions. The Animal Shelter KPI Dashboard in Google Sheets is a ready-to-use, fully customizable solution designed to track, analyze, and optimize every aspect of shelter performance — all within one interactive spreadsheet. 🐕🐈✨
Built for shelter managers, veterinarians, and volunteers, this dashboard simplifies complex reporting by bringing real-time insights and trend analysis to your fingertips. With visual dashboards, clear KPI definitions, and automated comparisons, it enables data-driven decisions to improve animal welfare and operational efficiency.
🔑 Key Features of the Animal Shelter KPI Dashboard
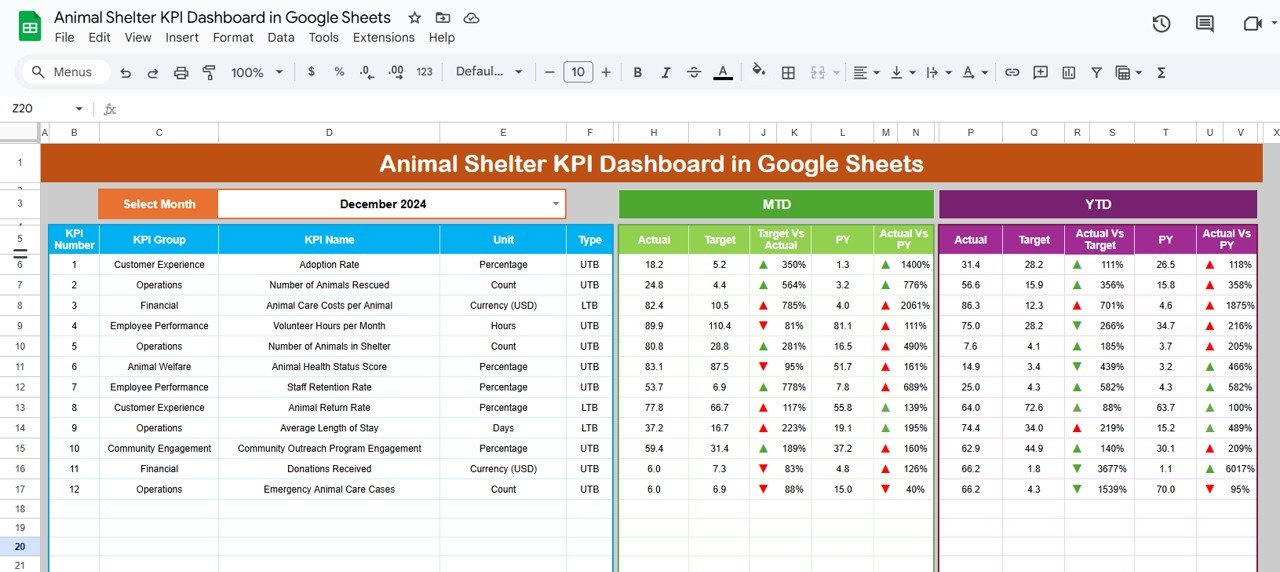
📋 1. Dashboard Sheet Tab
This is the heart of the tool — your one-stop view for performance tracking.
-
Month Selector (D3): Pick any month to instantly view updated metrics.
-
MTD (Month-to-Date) KPIs: Shows Actual vs Target vs Previous Year data with color-coded arrows 📈📉
-
YTD (Year-to-Date) KPIs: Aggregated results across the year for big-picture visibility.
-
KPIs Tracked: Adoptions, Intake, Volunteer Hours, Medical Checks, and more.
Visual cues make it easy to see which metrics are improving and which need attention.
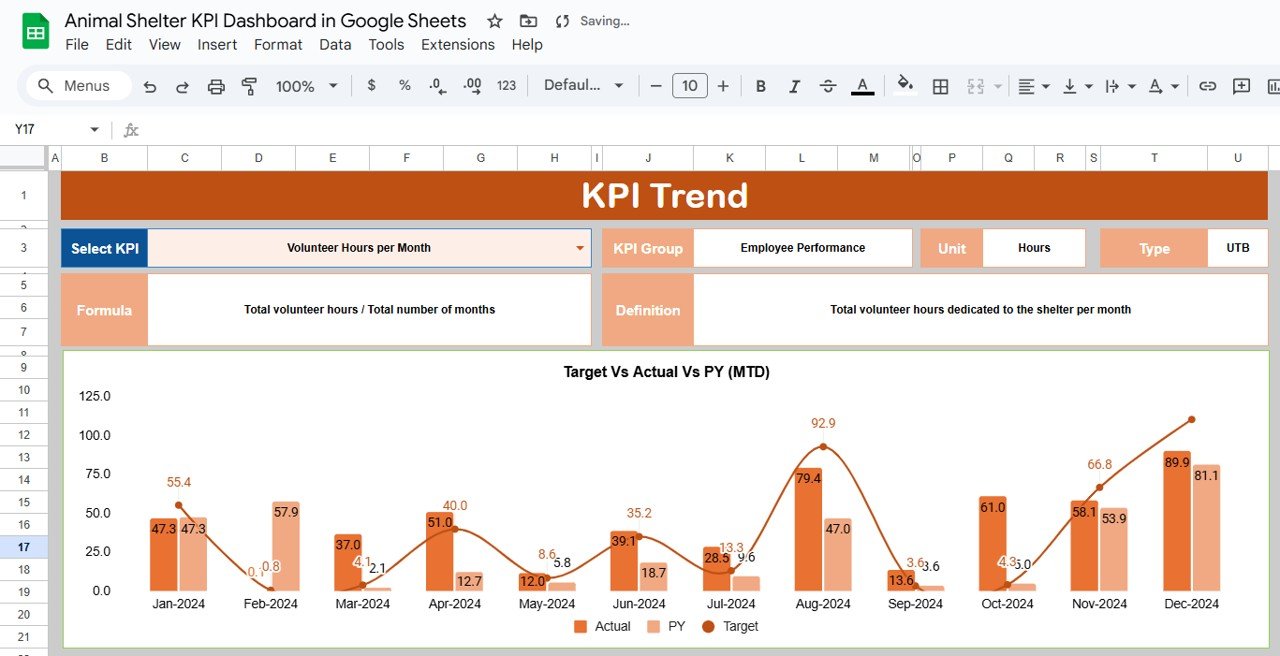
📈 2. KPI Trend Sheet Tab
Drill deeper into individual KPI performance.
-
Choose a KPI from the dropdown (C3) to view detailed trends 📊
-
Displays KPI Group, Unit, Formula, and Type (UTB or LTB)
-
View historical trends over months to identify progress or concerns
Perfect for analyzing adoption trends, volunteer growth, or medical compliance rates.
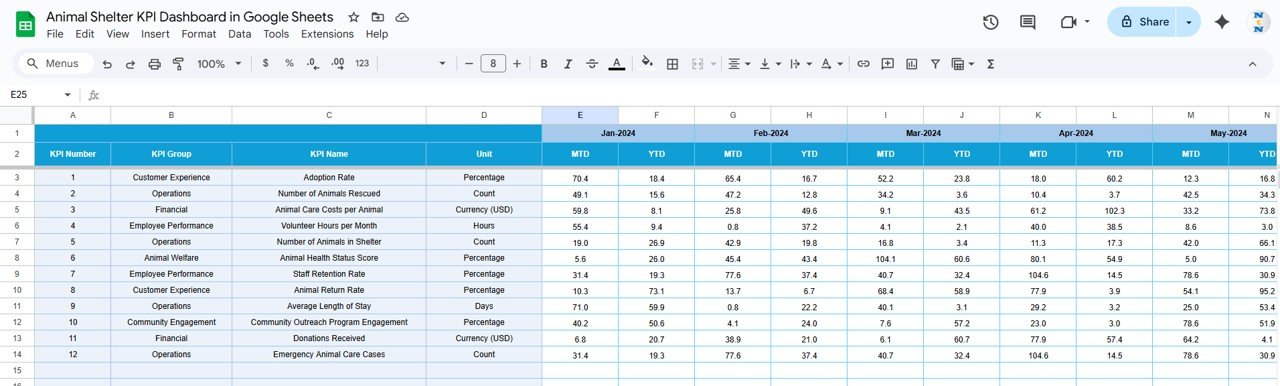
📑 3. Actual Numbers Sheet Tab
Keep your data fresh and accurate.
-
Record monthly actuals for each KPI (MTD & YTD)
-
Update the first month of the year dynamically (E1)
-
Reflects changes instantly across all sheets
Real-time data entry = real-time results.
🎯 4. Target Sheet Tab
Set measurable goals for your shelter.
-
Input MTD and YTD targets for each KPI
-
Compare actual results with targets side-by-side
-
Identify performance gaps and improvement areas
This helps shelters stay aligned with annual objectives.
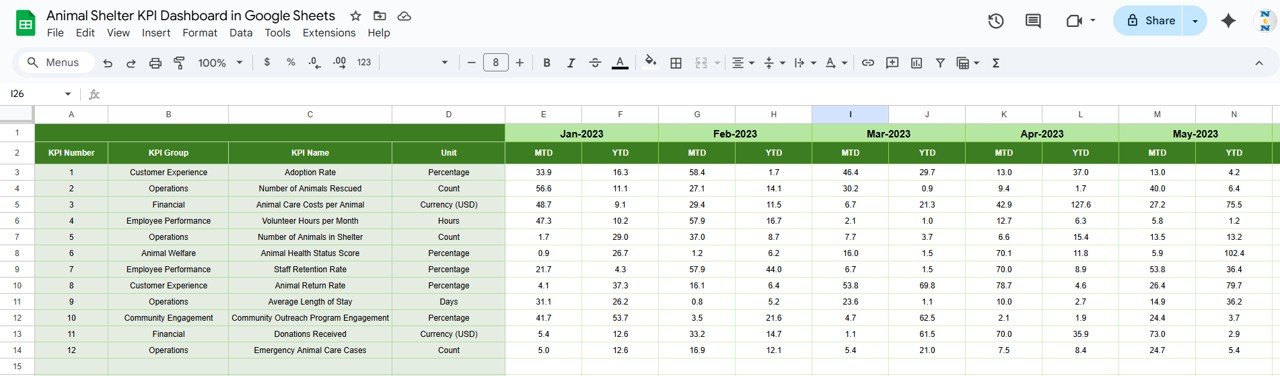
📆 5. Previous Year Numbers Sheet Tab
Keep historical context for smarter planning.
-
Log previous year’s results for comparison
-
Spot seasonal adoption patterns and intake spikes
-
Review YoY growth easily with visual indicators
Historical analysis made simple.
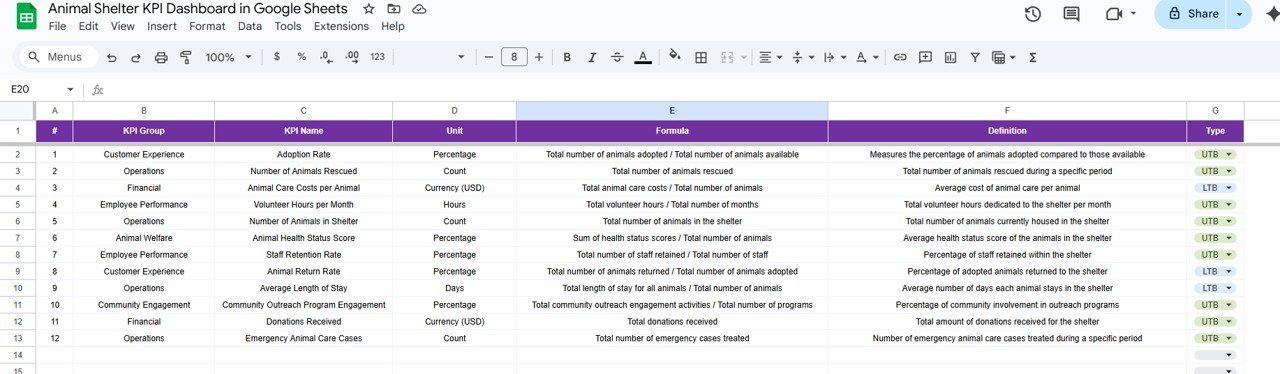
📘 6. KPI Definition Sheet Tab
Maintain transparency across your metrics.
-
Record each KPI’s Name, Group, Unit, Formula, and Definition
-
Define KPI Type: UTB (Upper-the-Better) or LTB (Lower-the-Better)
-
Keeps reporting consistent across staff and volunteers
A perfect reference point for training new employees or volunteers.
🐕 Example KPIs You Can Track
-
🏠 Total Adoptions (UTB): Animals adopted into new homes
-
🐾 Intake Count (UTB): Total animals received
-
❤️ Medical Check Compliance (UTB): % of animals medically cleared
-
🙌 Volunteer Hours (UTB): Total hours contributed
-
🔁 Return Rate (LTB): Percentage of animals returned post-adoption
-
⭐ Satisfaction Score (UTB): Adopter or volunteer feedback rating
Each KPI includes a unit, formula, and performance type for clarity.
📦 What’s Inside the Dashboard
✅ Interactive Dashboard Sheet – Visual KPI overview
✅ Trend Analysis Tab – In-depth metric evaluation
✅ Data Entry Tabs – For Actual, Target, and Previous Year data
✅ KPI Definition Sheet – Clear documentation for reference
✅ Auto-Updating Charts & Indicators – Real-time results
✅ Pre-Filled Example Data – Start exploring immediately
🧑💼 Who Can Benefit
🎯 Shelter Managers – Oversee operations and performance trends
🎯 Veterinary Teams – Monitor animal health and medical compliance
🎯 Volunteers & Coordinators – Track hours and engagement
🎯 Nonprofit Boards – Review outcomes and impact reports
🎯 Grant Managers – Use clean data for reporting and funding proposals
🧪 How to Use the Animal Shelter KPI Dashboard
-
Input Data: Enter monthly figures in Actual, Target, and Previous Year sheets.
-
Select Month: Use the dropdown on the Dashboard tab for instant updates.
-
Analyze Trends: Open the KPI Trend tab to review performance over time.
-
Compare Results: Check Target vs Actual and Year-over-Year improvements.
-
Share Insights: Collaborate with your team through Google Sheets sharing.
💡 Within minutes, you’ll transform how your shelter tracks performance and drives improvements.
🌟 Why Choose This Dashboard
-
🧾 All-in-one KPI management for animal shelters
-
📊 Real-time visuals for faster decision-making
-
🕵️ Transparent data tracking with clear definitions
-
🐾 Customizable structure for any shelter size or focus
-
🌍 Collaborative access for staff and volunteers
-
💡 Data-driven planning for better animal outcomes
The Animal Shelter KPI Dashboard in Google Sheets is your ultimate solution for tracking success, improving processes, and maximizing your impact — one paw at a time. 🐾❤️
🔗 Click here to read the Detailed blog post
Watch the step-by-step video Demo:


Reviews
There are no reviews yet.