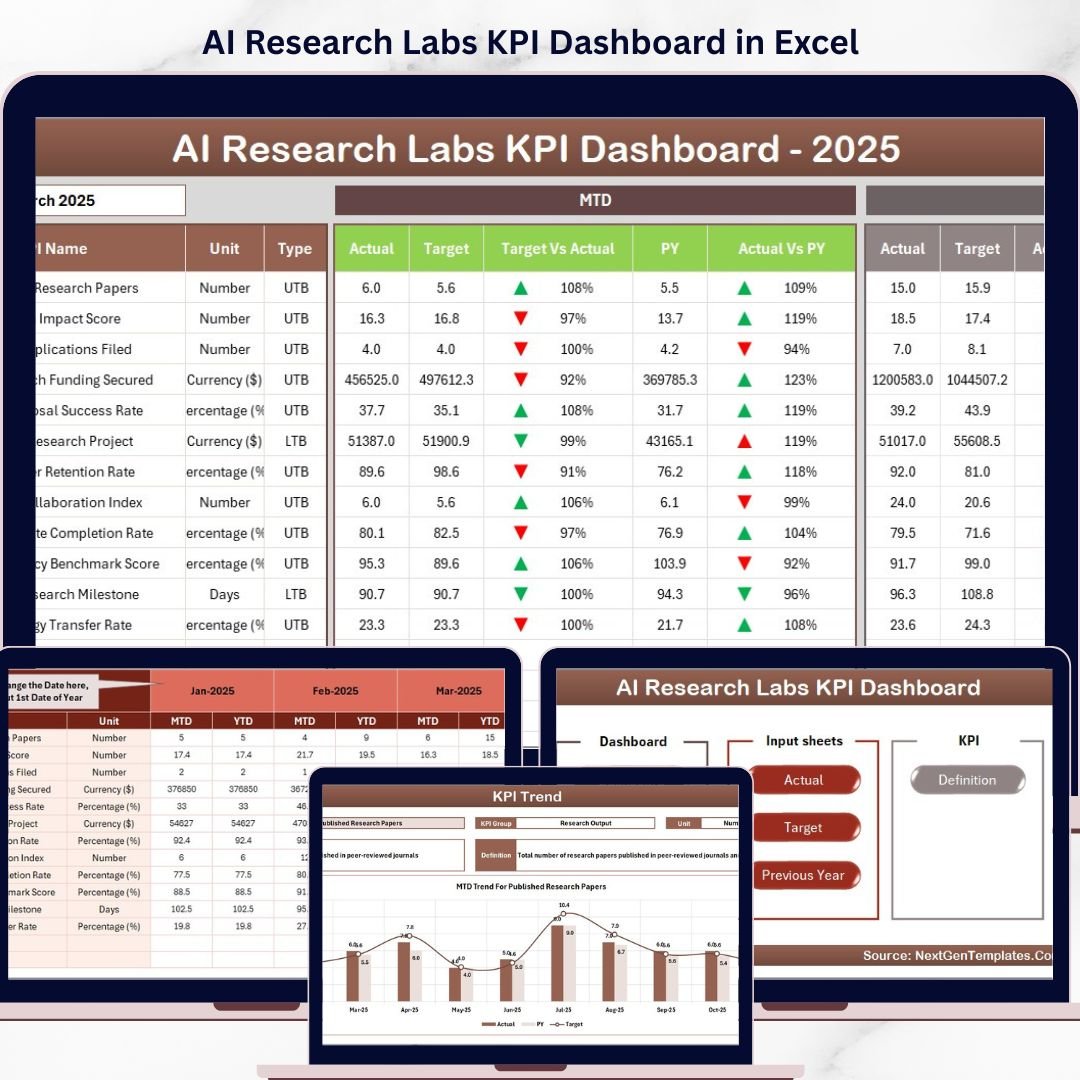
Key Features of AI Research Labs KPI Dashboard
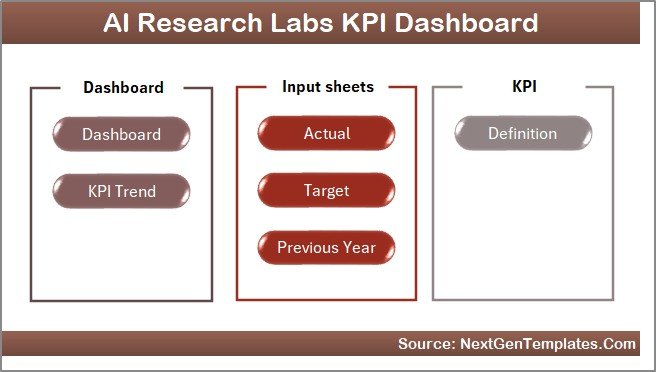
The AI Research Labs KPI Dashboard is a comprehensive, user-friendly digital tool designed to help research teams and lab managers track, analyze, and optimize their key performance indicators efficiently. This advanced dashboard features 7 intuitive worksheets, each tailored to provide detailed insights into your lab’s performance metrics. The Home sheet acts as a central navigation hub with 6 quick-access buttons, ensuring seamless movement across the dashboard.
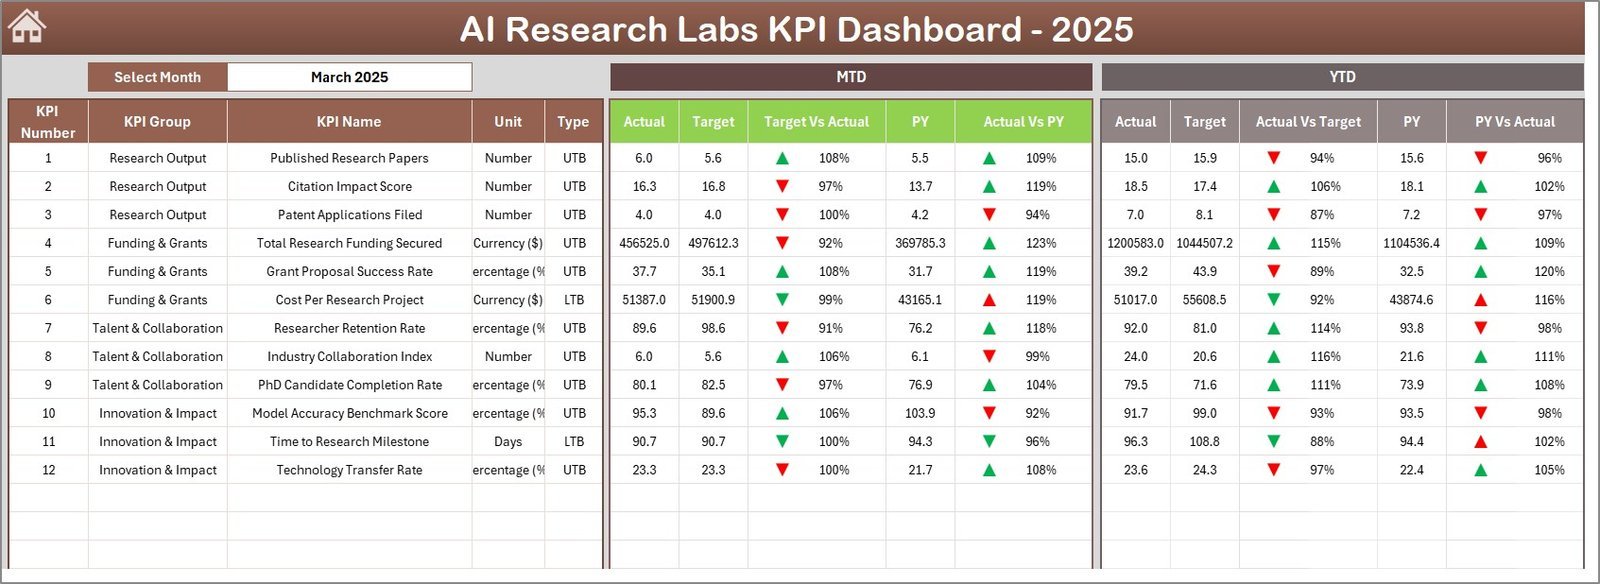
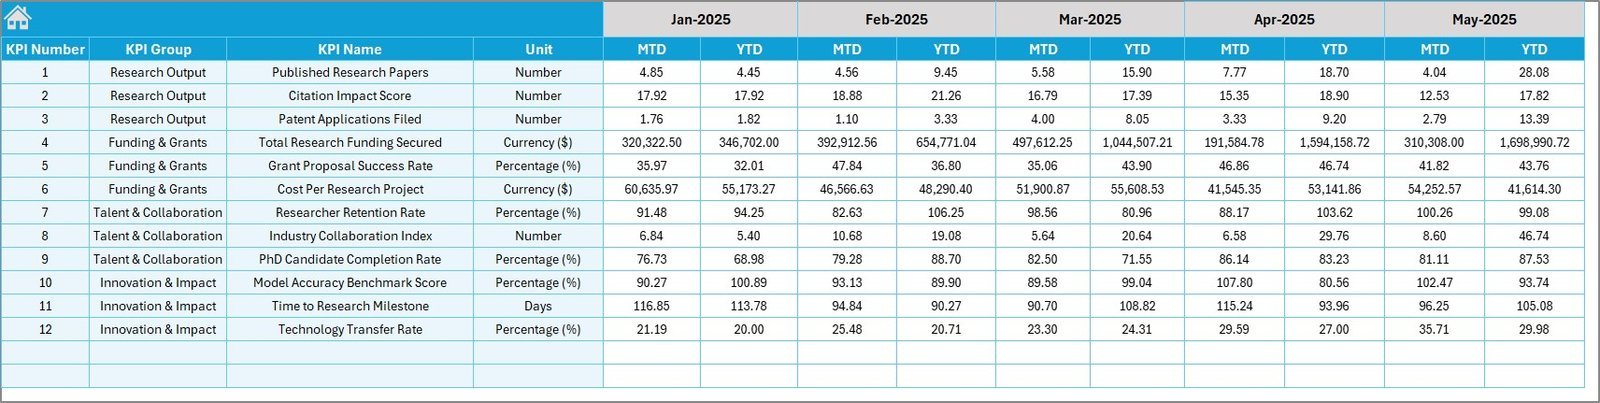
The main Dashboard sheet offers dynamic monthly data visualization, allowing you to select any month via a drop-down menu and instantly view Month-to-Date (MTD) actual figures, targets, previous year comparisons, and Year-to-Date (YTD) summaries. Conditional formatting with up/down arrows highlights performance trends against targets and historical data, making it easy to identify areas of success or concern at a glance.
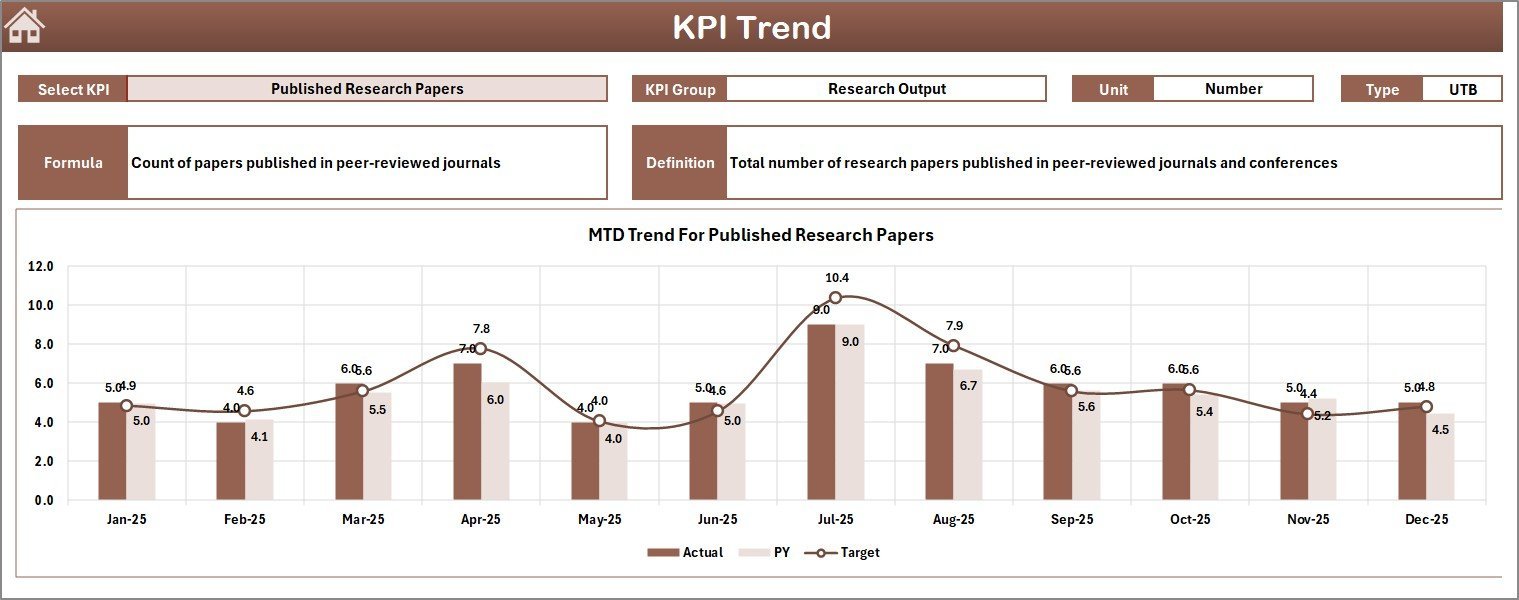
The KPI Trend sheet provides detailed trend analysis for individual KPIs. Select any KPI from the drop-down list to reveal its group classification, measurement unit, formula, and definition. It also displays visually engaging MTD and YTD trend charts comparing actual performance, targets, and previous year data to help you monitor progress over time.
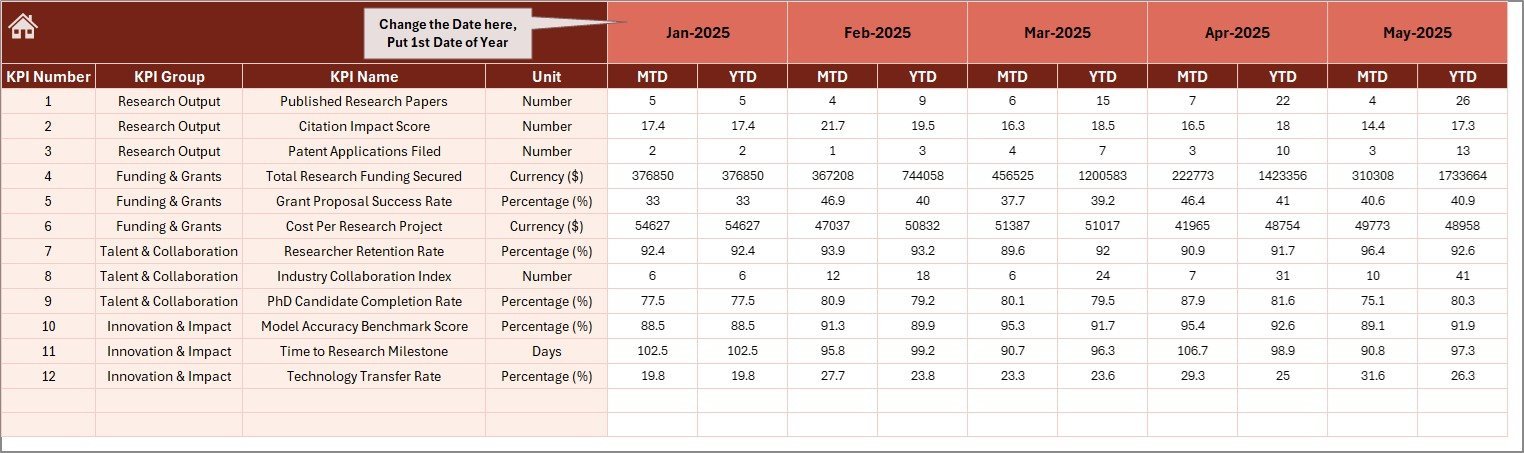
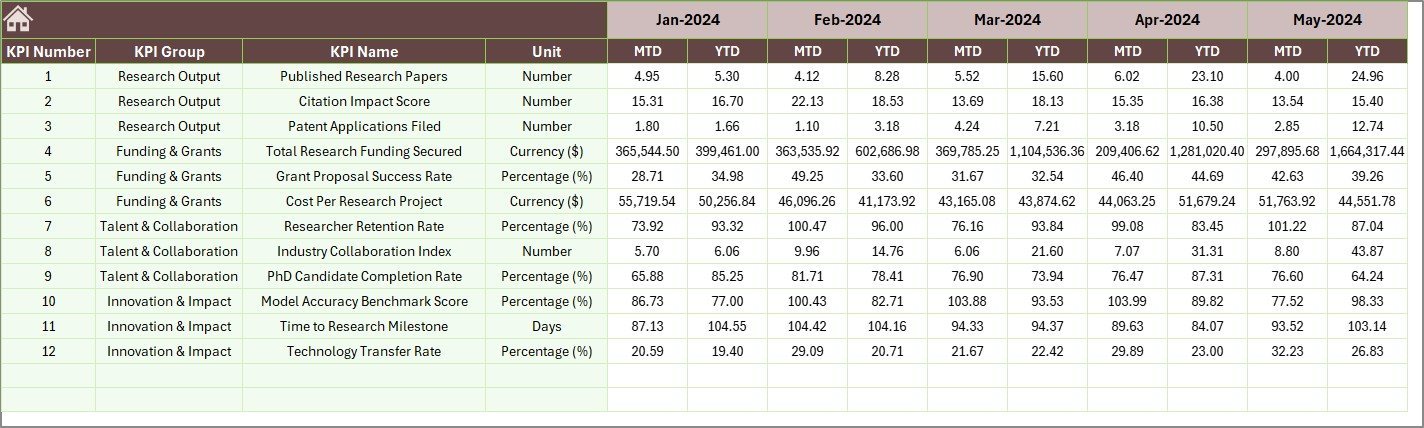
Input sheets for Actual Numbers, Target Numbers, and Previous Year Numbers make data entry straightforward and organized. You can easily update your performance data for each KPI monthly, ensuring your dashboard always reflects the most current information.
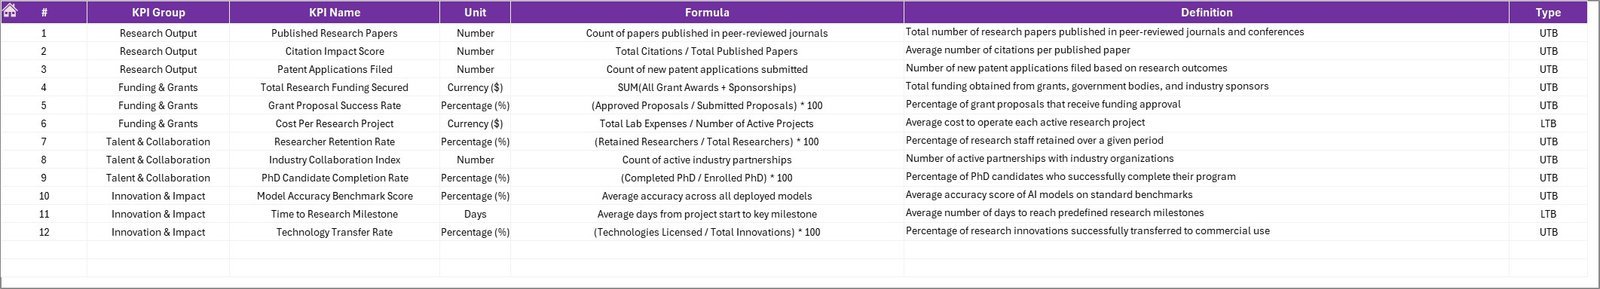
The KPI Definition sheet acts as your KPI encyclopedia – here you define each KPI’s name, group, unit, formula, and type (whether “Lower the Better” or “Upper the Better”), providing clear context for all your metrics.
What’s Inside the AI Research Labs KPI Dashboard
- 🏠 Home Sheet: Central navigation page with six clickable buttons for quick access to all dashboard sections.
- 📊 Dashboard Sheet: Dynamic month-wise KPI visualization with conditional formatting and comparative metrics.
- 📈 KPI Trend Sheet: Trend charts and detailed KPI data for in-depth performance tracking.
- ✏️ Actual Numbers Input Sheet: Easy input of monthly and YTD actual performance data.
- 🎯 Target Number Input Sheet: Simple interface to set and update monthly and YTD target goals.
- 📅 Previous Year Number Input Sheet: Archive previous year’s data for comparison and trend analysis.
- 📚 KPI Definition Sheet: Detailed definitions, formulas, and classifications to clarify each KPI’s purpose.
How to Use the AI Research Labs KPI Dashboard
Start by entering your baseline data in the Actual Numbers Input, Target Number Input, and Previous Year Number sheets. Use the KPI Definition Sheet to add or customize KPIs relevant to your lab’s specific goals. Navigate easily using the Home sheet buttons to monitor real-time performance metrics in the Dashboard sheet. Select any month to instantly update all KPI figures and trend charts.
Analyze trends on the KPI Trend sheet to identify areas needing attention or improvement, supported by visual charts that highlight deviations from targets or past performance. The dashboard’s conditional formatting enables quick interpretation of results, helping you make data-driven decisions to enhance operational efficiency and research outcomes.
Who Can Benefit from This AI Research Labs KPI Dashboard
- 🔬 Research Lab Managers: Gain clear insights into lab productivity and performance metrics to drive improvements.
- 🤖 AI Development Teams: Track progress and efficiency of AI projects with data-driven KPIs.
- 📊 Data Analysts: Leverage comprehensive data visualization for better reporting and analysis.
- 📈 Project Leads: Monitor monthly and yearly targets to ensure timely project completion.
- 🏢 Institutional Decision-Makers: Access transparent KPI data to support strategic planning and resource allocation.
- 🧪 Quality Control Teams: Identify bottlenecks and optimize processes using trend insights.
- 📅 Performance Review Committees: Utilize detailed comparisons with previous years to assess growth and challenges.
Click here to read the Detailed blog post.
Visit our YouTube channel to learn step-by-step video tutorials


Reviews
There are no reviews yet.