

The best mining KPI dashboard template for most mines in 2026 is the Mining KPI Dashboard in Excel ($12.99): it shows production, cost per ton, equipment utilization, safety and ore grade as month-to-date and year-to-date actuals against target and previous year. For site-by-site operations analysis, the Mining Operations Dashboard in Excel ($17.99) is the stronger pick. Four more ranked options follow.
Last updated: October 2026
Key takeaways
- Best overall mining KPI dashboard: the Mining KPI Dashboard in Excel at $12.99, with MTD and YTD actual vs target vs previous-year comparisons.
- Best for operations analysis: the Mining Operations Dashboard in Excel at $17.99, with 5 pages, 15+ pivot charts and slicers for mine site, mineral type, mining method and shift.
- Best value: the Mining KPI Dashboard in Google Sheets at $9.99, shareable with every site manager in a browser.
- All templates are one-time purchases from $9.99 to $17.99; mining analytics software is usually licensed on a quoted annual basis.
- Metals businesses downstream of the mine are covered too: steel and metals plants and precious-metals producers each get a dedicated KPI dashboard.
Mining and metals templates compared
| Template | Format | Best For | Price |
|---|---|---|---|
| Mining KPI Dashboard | Excel | Best overall: monthly MTD/YTD review against target and last year | $12.99 |
| Mining KPI Dashboard | Google Sheets | Best value: shared, browser-based KPI review across sites | $9.99 |
| Mining KPI Dashboard | Power BI | Production, equipment, workforce and environmental KPIs in Power BI | $11.99 |
| Mining Operations Dashboard | Excel | Tons, revenue, cost, profit and safety by site, mineral and shift | $17.99 |
| Mining Operations Dashboard | Power BI | The operations view for larger data sets and on-screen reviews | $17.99 |
| Mining Dashboard | Excel | Cost, profitability, equipment downtime and ESG (CO₂, waste, water) | $13.99 |
| Mining Safety KPI Dashboard | Excel | Safety managers: accident frequency, LTI rate, audits and training | $12.99 |
| Steel & Metals KPI Dashboard | Excel | Steel mills, foundries and metal processors | $14.99 |
| Precious Metals KPI Dashboard | Excel | Gold, silver, platinum and palladium producers, refiners and traders | $14.99 |
How we picked these mining templates
We searched the full NextGenTemplates catalogue of Excel, Google Sheets and Power BI products for mining, mineral, ore, steel, metals and precious-metals tools, which returned more than 20 paid templates. We kept the six that a mine manager, site superintendent, safety lead or metals plant controller would actually open every month, and listed the other formats of the same tools in the table above.
Every pick had to track genuine mining or metals measures (tons, grade, cost per ton, downtime, incident rates, refining yield), work from a real data or actuals sheet, and be editable without a consultant. We dropped retail and store-operations dashboards from an early shortlist because they matched “operations” but not the industry. Prices are the current one-time list prices on each product page. For the safety-rate definitions behind the KPIs we follow the U.S. Mine Safety and Health Administration (MSHA) data and reports.
Why mining and metals teams need a KPI dashboard
Most mine sites already produce plenty of data: the dispatch system logs loads and cycle times, the plant records throughput and recovery, maintenance has its work orders, and the safety officer keeps an incident register. The problem is that the monthly management report still gets assembled by hand from four or five exports, usually by an engineer who would rather be in the pit.
The software answer is a mining analytics platform or a full BI build. Products in that space, such as fleet management suites, mine-planning packages and operational reporting tools, are powerful but are licensed per site or per seat on quoted annual contracts and need an implementation project. For a junior miner, a quarry, a contract miner or a single-site operation, that is hard to justify just to see production against plan.
A mining KPI dashboard template sits on top of the data you already export. It does not replace dispatch or mine planning; it turns those numbers into one page that answers the questions the general manager asks every month: are we on tonnage, what is cost per ton doing, which equipment is losing hours, and is the safety trend improving. For $9.99 to $17.99, once.
The 6 best mining and metals templates for 2026
1. Mining KPI Dashboard in Excel: best overall
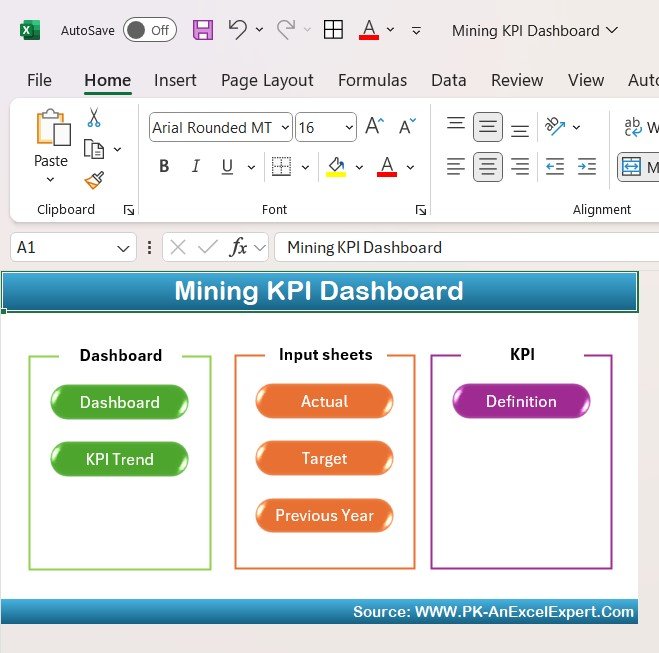
This is the template to use for the monthly performance review, which is why it ranks first. Instead of charting raw transactions, it compares every KPI three ways: actual against target, actual against previous year, and month-to-date against year-to-date. Pick a month from the dropdown and the whole dashboard updates.
Who it is for: mine managers, general managers, operations superintendents and site finance controllers who report a fixed KPI set to head office or a board.
- A Home sheet with navigation buttons to the Dashboard, KPI Trend and data input sheets.
- A Dashboard sheet with MTD and YTD actual, target and previous-year values, and up/down arrows from conditional formatting.
- A KPI Trend sheet: choose any KPI from a dropdown to see its MTD and YTD trend charts.
- Example KPIs include production output (tons), cost per ton, equipment utilization rate, safety incidents, energy consumption and ore grade percentage.
Concrete uses: show that YTD production is 4% behind target while cost per ton is on plan, so the gap is volume, not efficiency; spot that ore grade has slipped three months running before it shows up in metal sold; and replace a 20-slide monthly pack with one sheet. Price: $12.99. Get the Mining KPI Dashboard in Excel →
Also available as the Mining KPI Dashboard in Google Sheets ($9.99, our best-value pick) and the Mining KPI Dashboard in Power BI ($11.99).
Best for: the monthly management review against plan and last year.
2. Mining Operations Dashboard in Excel
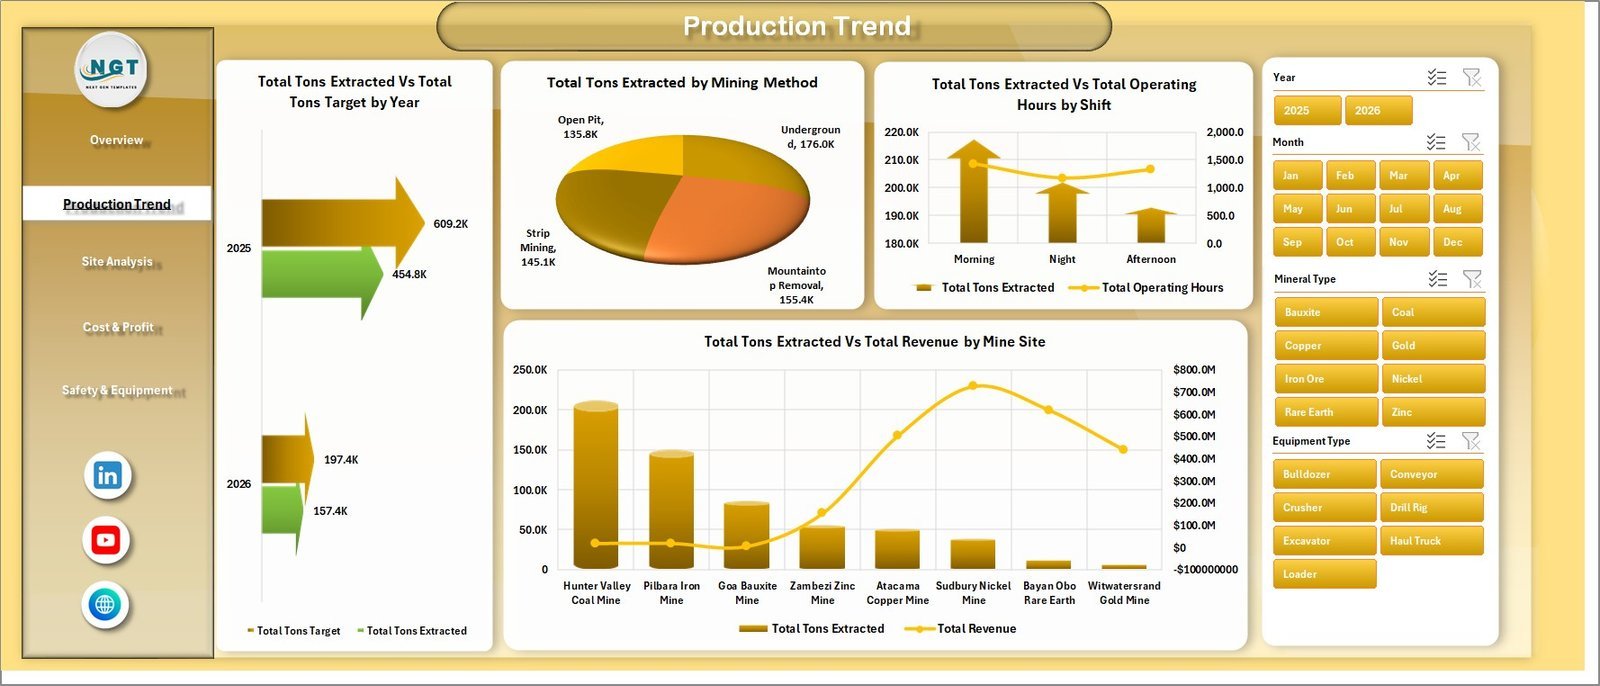
Where the KPI dashboard summarises, this one analyses. It reads production records and breaks them down across five pages (Overview, Production Trend, Site Analysis, Cost & Profit, and Safety & Equipment) with 15+ pivot charts. It is 100% Excel with no macros, add-ins or external connections, and works in Excel 2016 through 365 and Excel for the web.
Who it is for: multi-site operators, operations analysts and mine planners who want to know why a number moved, not only that it moved.
- Five KPI cards: Total Tons Extracted, Total Revenue, Total Operating Cost, Net Profit and Total Safety Incidents.
- Slicers for mine site, mineral type, mining method, region, supervisor and shift that filter every chart.
- Charts such as Tons Extracted vs Target by Month, Profit Margin % by Mineral Type and Target Achievement % by Mine Site.
- Cost views for maintenance cost by site, fuel vs labour cost and net profit by mining method, plus downtime rate % and operating hours vs downtime.
Concrete uses: compare open-pit and underground profit margins on the same basis; find the shift with the lowest tons per operating hour; and see which site’s maintenance cost is climbing faster than its output. Setup takes under 10 minutes according to the product documentation. Price: $17.99. Get the Mining Operations Dashboard in Excel →
Also available as the Mining Operations Dashboard in Power BI ($17.99) and in Google Sheets ($9.99).
Best for: site, shift and mineral-level operations analysis.
3. Mining Dashboard in Excel
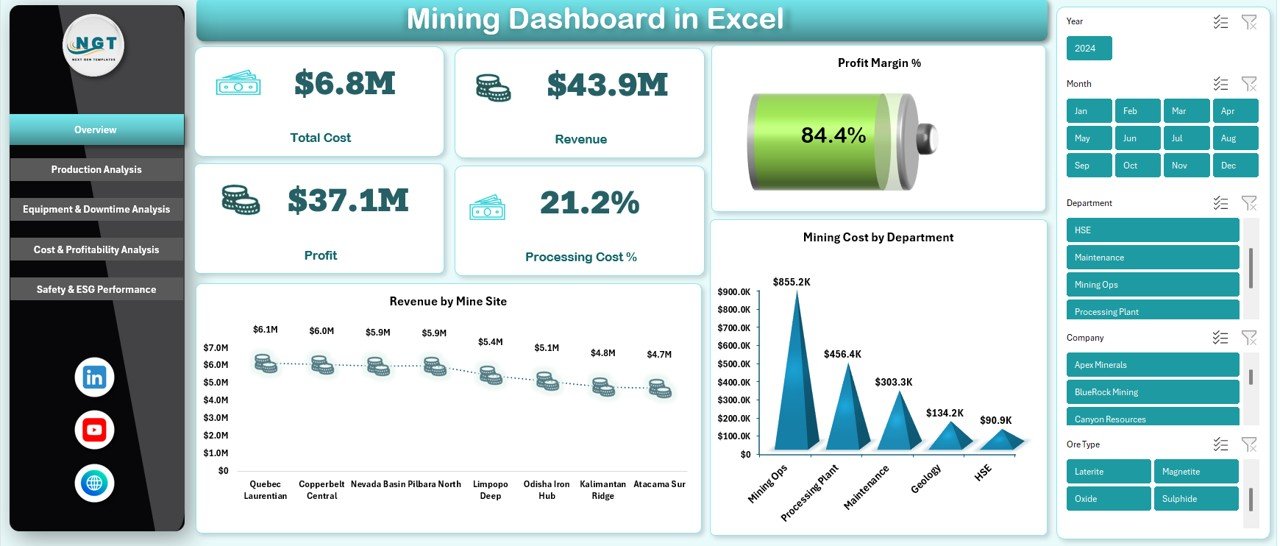
This dashboard adds the two lenses the others treat lightly: profitability by ore type and ESG. Its five sheets cover Overview, Production Analysis, Equipment & Downtime, Cost & Profitability, and Safety & ESG, with slicers for mine site, department, ore type, equipment type and company.
Who it is for: mining finance teams, sustainability leads and owners who need cost, margin and environmental figures in the same report.
- Overview KPIs: Total Cost, Revenue, Profit, Processing Cost % and Profit Margin %.
- Production views such as ore mined by company, average uptime hours by supervisor and waste mined by equipment type.
- Equipment and downtime analysis, including downtime impact % by delay reason and downtime hours by department.
- Safety and ESG tracking for CO₂ emissions, waste mined, water used and safety incidents.
Concrete uses: show which delay reason costs the most hours so maintenance can target it; compare processing cost % across ore types before renegotiating a toll-treatment contract; and pull CO₂ and water figures for an ESG disclosure without a separate spreadsheet. Price: $13.99. Get the Mining Dashboard in Excel →
Also available as the Mining Dashboard in Power BI ($17.99) and in Google Sheets ($9.99).
Best for: cost, downtime and ESG reporting in one workbook.
Not sure where to start? Most mines start with the Mining KPI Dashboard in Excel ($12.99) for the monthly review. If your site managers work in Google Workspace, the Google Sheets edition ($9.99) is the cheapest way to put one live KPI view in front of everyone.
4. Mining Safety KPI Dashboard in Excel
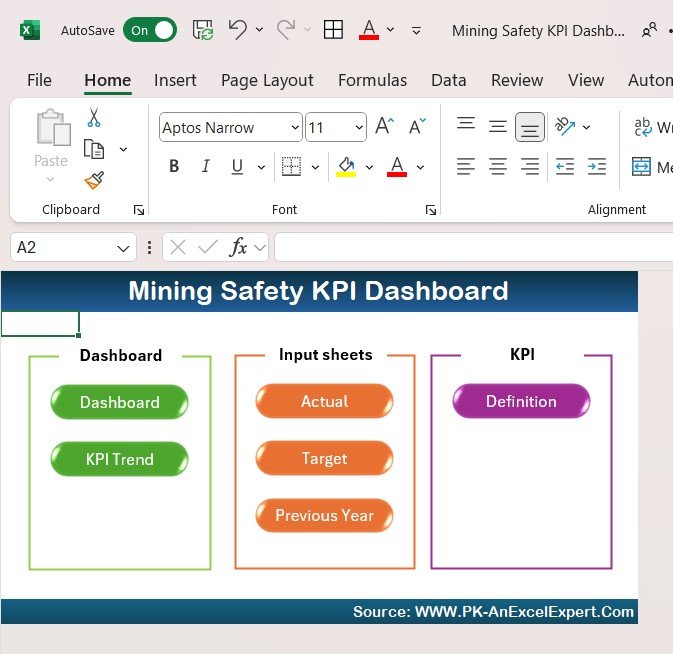
Safety performance deserves its own report, because a production dashboard shows incidents as one number among many. This template focuses entirely on safety: accident frequency rate, lost-time injury (LTI) rate, incident response times, safety audit results, near-misses and worker training.
Who it is for: HSE managers, safety officers and site managers who report safety performance to leadership, regulators or clients.
- Safety metrics including accident frequency rate (AFR), LTI rate and incident response time.
- Compliance tracking for safety protocols, inspections and audits.
- Incident analysis covering accidents, incidents and near-misses to reveal patterns.
- Training and certification tracking so you can see who is due for refresher training.
Concrete uses: show the board a 12-month LTI trend rather than a single month’s count; prove to a contractor client that audit compliance stayed above target; and connect a rise in near-misses to a gap in training completions. Price: $12.99. Get the Mining Safety KPI Dashboard in Excel →
Also available in Google Sheets ($9.99).
Best for: HSE teams that need a dedicated safety performance report.
5. Steel & Metals KPI Dashboard in Excel
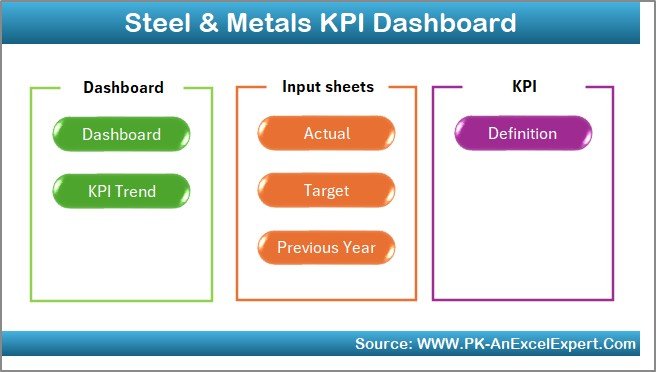
Moving downstream from the mine, this template is built for steel and metals producers. It is a seven-sheet KPI workbook: Home, Dashboard, KPI Trend, Actuals, Targets, Previous Year and KPI Definitions. The central dashboard compares MTD and YTD actuals with targets and last year, with conditional-formatting arrows and a month selector.
Who it is for: plant managers, production controllers and finance teams at steel mills, foundries, rolling mills and metal service centres.
- MTD and YTD actual vs target vs previous year on one dashboard sheet.
- A KPI Trend sheet that shows any KPI’s trend together with its formula and definition.
- Separate Actuals, Targets and Previous Year input sheets, so data entry never touches the dashboard.
- A KPI Definitions dictionary that standardises names, formulas and groups across departments.
Concrete uses: track yield, energy per ton and cost KPIs against the annual budget; give every shift supervisor the same definition of each metric; and compare this year’s performance with last year’s month by month. Price: $14.99. Get the Steel & Metals KPI Dashboard in Excel →
Also available as the Steel & Metals KPI Dashboard in Power BI ($11.99).
Best for: metal processors that report a standard KPI set every month.
6. Precious Metals KPI Dashboard in Excel
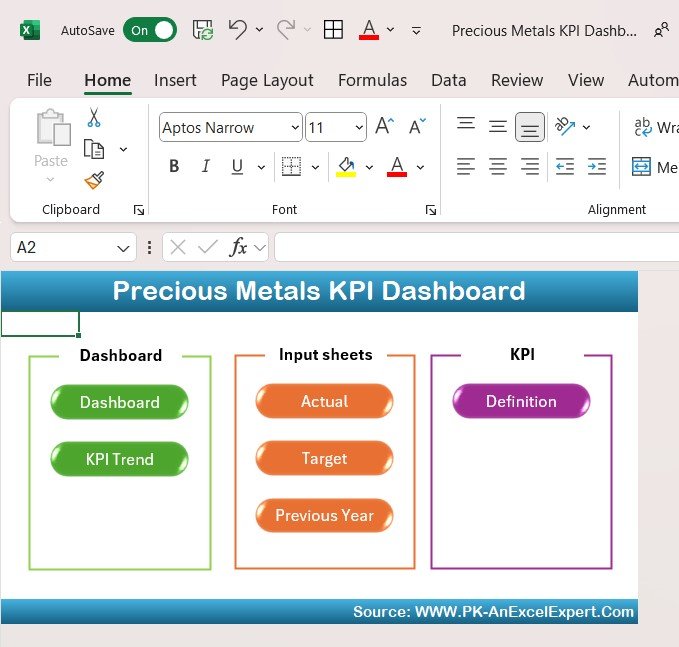
Gold, silver, platinum and palladium businesses watch a different mix of numbers: market prices move margins as much as the operation does. This dashboard tracks production volumes, market prices, extraction costs, profit margins and refining efficiency together.
Who it is for: precious-metals miners, refiners and trading desks that need operational and market KPIs in the same view.
- Production and operational efficiency KPIs, including production output, refining efficiency and mining yields.
- Market price tracking for gold, silver, platinum and palladium, with price trend analysis.
- Profitability analysis comparing cost of production with market prices and revenue.
- Customisable reports for stakeholders, clients or investors.
Concrete uses: see how much of a quarter’s margin change came from the gold price versus the all-in cost per ounce; monitor refining yield against target; and give investors a monthly KPI page in a consistent format. Price: $14.99. Get the Precious Metals KPI Dashboard in Excel →
Also available in Google Sheets ($9.99).
Best for: precious-metals producers and refiners balancing operations against market price.
The mining KPIs every dashboard should show
Whichever template you choose, make sure your monthly report covers these measures. The formulas below work in any of the dashboards once your data is in the input sheet. Benchmarks vary by commodity, mining method and equipment, so treat the right-hand column as a starting point, not a standard.
| KPI | Formula | What to look for |
|---|---|---|
| Production vs plan | Actual tons ÷ planned tons | At or above 100% on a YTD basis |
| Cost per ton | Total operating cost ÷ tons produced | Flat or falling while volume holds |
| Equipment availability | (Scheduled hours − downtime hours) ÷ scheduled hours | Many operations target 85% or more for the main fleet |
| Equipment utilization | Operating hours ÷ available hours | Low utilization with high availability points to dispatch or staffing |
| Strip ratio | Waste tons ÷ ore tons | Tracking the mine plan; a rising ratio raises cost per ton of ore |
| Ore grade | Metal content ÷ ore tons (g/t or %) | Close to the reserve model; persistent shortfall signals dilution |
| Recovery rate | Metal recovered ÷ metal in plant feed | Stable month to month for the same ore type |
| Incidence rate | Recordable cases × 200,000 ÷ hours worked | Falling trend; MSHA publishes rates by mine type for comparison |
The 200,000-hour base in the incidence rate equals 100 full-time workers for a year, which is why MSHA and most mining companies use it: it makes a 50-person quarry comparable with a 2,000-person open pit. If you want the same discipline for adjacent functions, our guides to manufacturing KPIs to track in 2026, energy management KPIs and inventory KPIs cover the plant, power and spares side.
How to choose the right mining KPI dashboard
Match the template to the question you are asked most often, then to the software your team already uses.
- “Are we on plan this month and this year?” The Mining KPI Dashboard in Excel ($12.99).
- “Which site, shift or mineral is driving the result?” The Mining Operations Dashboard in Excel ($17.99).
- “Where are we losing money and hours, and what are our emissions?” The Mining Dashboard in Excel ($13.99).
- “Is the site getting safer?” The Mining Safety KPI Dashboard ($12.99).
- You run a steel or metals plant: the Steel & Metals KPI Dashboard ($14.99). You produce or refine gold or silver: the Precious Metals KPI Dashboard ($14.99).
On format: choose Excel when one analyst owns the monthly pack, Google Sheets when several site managers need to update or view the same file, and Power BI when you have years of daily records or present on screen to a board. Comparing formats more widely? See our Power BI dashboard templates ranked by industry, the premium Power BI templates under $20 and our shareable Google Sheets templates for teams. For the money side of a mining business, the finance KPIs guide lists the measures a CFO will expect next to production.
When a mining template is NOT the right answer
A dashboard is a reporting layer, not an operating system for the mine. Be clear about where a mining KPI dashboard template stops:
- You need real-time fleet dispatch or equipment telemetry. Truck assignment, payload monitoring and live machine health come from fleet management systems connected to the equipment. Export their summaries into a template for monthly reporting.
- You need mine planning, block models or scheduling. Geological modelling and life-of-mine scheduling belong in dedicated mine-planning software.
- You need statutory safety reporting. Regulators such as MSHA define what must be reported and how. A dashboard helps you monitor the trend, but the official record lives in your safety management system and regulatory filings.
- Many people enter data at the same time with audit trails. Google Sheets handles light collaboration, but high-volume, permissioned data entry needs a database-backed system.
- You need laboratory or assay data management. Sample tracking and assay QA/QC require a LIMS; bring only the summarised grade figures into the dashboard.
If none of those apply, and for most monthly management reporting they do not, a template is the faster, cheaper and more flexible choice. You can always graduate to software once the KPI set has proved itself.
Frequently asked questions
What is a mining KPI dashboard?
A mining KPI dashboard is a report that puts the numbers a mine manager reviews every month on one page: tons produced, ore grade, cost per ton, equipment utilization, downtime and safety incidents. A template version gives you that layout ready-made, so you only enter your actuals and targets instead of building the charts yourself.
Which KPIs should a mining dashboard track?
Start with production output in tons, tons against target, ore grade, cost per ton, equipment availability and utilization, downtime hours by cause, and a safety rate such as lost-time injuries or the incidence rate per 200,000 hours worked. Add strip ratio, recovery rate and energy use per ton once the basics are stable.
Is Excel good enough for mining reporting?
Yes, for monthly and weekly management reporting. Excel handles thousands of production, cost and safety records comfortably and every engineer and accountant already knows it. It is not a substitute for fleet management, mine planning or real-time dispatch systems, which need sensor feeds and specialised software.
How much do these mining templates cost?
The six ranked templates cost between $12.99 and $17.99 each as one-time purchases, and the Google Sheets editions start at $9.99. There is no subscription and no per-user fee. Enterprise mining software is normally licensed on a quoted annual basis, so one template costs less than a single seat.
Can I track several mine sites in one dashboard?
Yes. The Mining Operations Dashboard and the Mining Dashboard in Excel both have mine site as a slicer field, so you can show one site, a group or the whole portfolio. The Mining Operations Dashboard also filters by mineral type, mining method, region, supervisor and shift.
Do the Excel mining templates need macros?
No. The Mining Operations Dashboard is 100% Excel with no macros, add-ins or external connections, and the other dashboards are formula and pivot based. You replace the sample data, refresh, and the KPI cards and charts update. That makes them safe to open on locked-down corporate laptops.
What is the difference between the Mining KPI Dashboard and the Mining Operations Dashboard?
The Mining KPI Dashboard compares each KPI's actual against target and previous year, month-to-date and year-to-date, which suits a monthly management review. The Mining Operations Dashboard analyses raw production records by site, mineral, method and shift across five pages, which suits operational analysis.
Is there a template for steel mills or metal processors?
Yes. The Steel & Metals KPI Dashboard in Excel has seven sheets, including Actuals, Targets, Previous Year and a KPI Definitions dictionary, and shows MTD and YTD actuals against targets. It suits steel mills, foundries, rolling mills and metal service centres that report a standard KPI set every month.
Can I add my own KPIs or rename the sample ones?
Yes. The KPI-style templates keep their KPI list on a definitions sheet, so you can rename a KPI, change its formula or unit, and add new rows. The pivot-based dashboards read whatever categories are in your data sheet, so your own site names, ore types and equipment classes appear automatically.
How do I get started after buying a mining template?
Download the file, open the data or actuals sheet, and replace the sample rows with last month's production, cost and safety figures in the same columns. Enter targets if the template has a target sheet, refresh, then check one total, such as tons produced, against a figure you already trust.
Get more mining and metals templates
Ready to replace the hand-built monthly pack? Start with our best overall mining KPI dashboard, the Mining KPI Dashboard in Excel ($12.99), add the Mining Operations Dashboard ($17.99) for site-level analysis, or take the best-value Google Sheets edition ($9.99). Every option above is a one-time purchase between $9.99 and $17.99, with no subscription.
Running processing plants or a power-hungry operation too? The Manufacturing Excellence Bundle ($79.99, 8 premium Excel and Power BI templates) and the Energy & ESG Sustainability Bundle ($59.99, 8 templates) extend the same approach. You can also browse the 25 best-selling business templates. Subscribe to the NextGenTemplates YouTube channel for setup tutorials.