

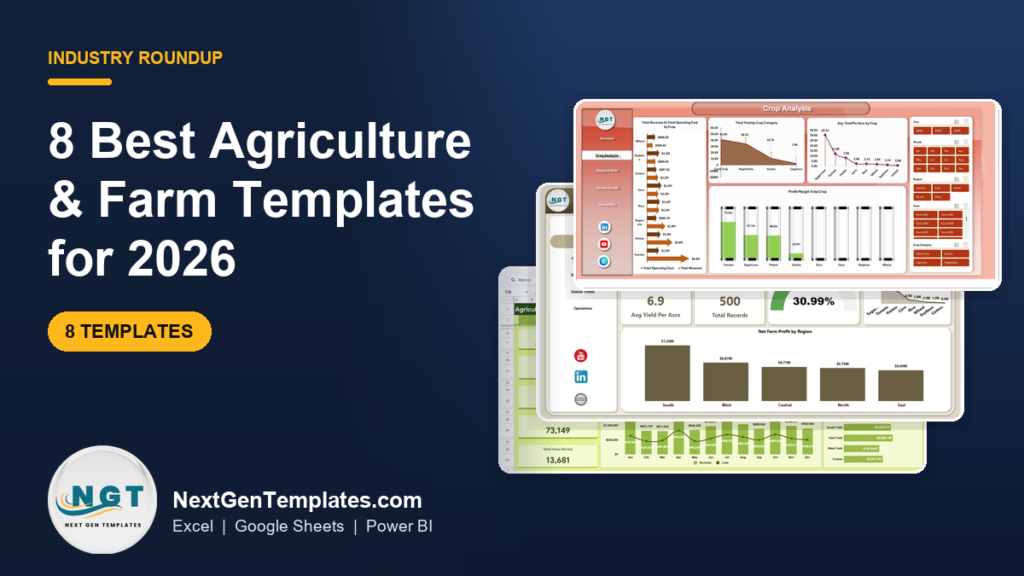
The best farm templates for most growers in 2026 start with the Agriculture and Farm Dashboard in Excel ($17.99): five pages cover revenue, crops, regions, seasons and operations, and one refresh updates every chart. For the lowest price and a dedicated livestock tab, the Google Sheets edition costs $9.99. Six more ranked picks follow.
Last updated: October 2026
Key takeaways
- Best overall of the farm templates: the Agriculture and Farm Dashboard in Excel at $17.99, with Overview, Crop Analysis, Regional View, Season Trends and Operations pages.
- Best value: the Agriculture Farm Dashboard in Google Sheets at $9.99, the only pick with a dedicated Livestock tab.
- All eight farm templates are one-time purchases between $9.99 and $17.99; Farmbrite’s farm management software plans run from $29 to $109 per month.
- Four formats are covered (Excel, Google Sheets, Power BI and HTML), so you can match the tool your farm office already uses.
- The four KPI dashboards add month-to-date and year-to-date target-versus-actual tracking for yield, irrigation, labor, equipment and exports.
Agriculture and farm templates compared
| Template | Format | Best For | Price |
|---|---|---|---|
| Agriculture and Farm Dashboard | Excel | Best overall: crop, region, season & operations analysis | $17.99 |
| Agriculture and Farm Dashboard | Power BI | Larger farms and agribusinesses with many fields or sites | $17.99 |
| Agriculture Farm Dashboard | Google Sheets | Best value: mixed crop & livestock farms, shared access | $9.99 |
| Agriculture and Farm Dashboard | HTML | Browser dashboard with Excel/CSV upload, works on mobile | $12.99 |
| Farm Management KPI Dashboard | Excel | Farm managers tracking yield, labor, equipment & resources | $14.99 |
| Smart Agriculture KPI Dashboard | Excel | Irrigation, soil, pest and resource-efficiency KPIs | $14.99 |
| Agriculture KPI Dashboard | Google Sheets | MTD/YTD target vs actual for yield, irrigation & labor | $12.99 |
| Agricultural Exports KPI Dashboard | Excel | Exporters tracking markets, products & supply chain | $14.99 |
How we picked these farm templates
We searched the full NextGenTemplates catalogue of Excel, Google Sheets, Power BI and HTML products for agriculture, farm, crop, livestock and agri-export tools, then kept the eight that a farm office would actually open every month. Each pick had to work from a real data sheet, calculate genuine farm KPIs such as yield per acre and net farm profit, and be editable without a consultant.
We left out single-chart downloads, generic finance dashboards with no crop or field logic, and near-duplicates of a page already inside the dashboards below. Prices are the current one-time list prices on each product page. For context on farm income and costs we point to the USDA Economic Research Service farm income and finances data.
Why farms use farm templates instead of software first
Most family farms and small agribusinesses keep their numbers in four places: a sales ledger, a stack of input invoices, a yield notebook or combine export, and the accountant’s year-end file. Pulling them together for a lender meeting or a planting decision takes days, and by then the season has moved on.
The obvious fix is farm management software. Farmbrite, Granular, Agworld and Traction Ag are capable products, but they are subscriptions. Farmbrite’s published pricing starts at $29 per month for an Essentials plan and reaches $109 per month for its combined crop and livestock Premium plan. That is $348 to $1,308 a year before anyone has entered a single record.
Farm templates sit one step earlier. They do not replace your record-keeping; they turn the records you already have into a clear picture of what each crop, field, region and season earns. For a one-time $9.99 to $17.99, you find out whether you need software at all, and if you do, you know exactly which reports you want from it.
The 8 best farm templates for 2026
1. Agriculture and Farm Dashboard in Excel: best overall
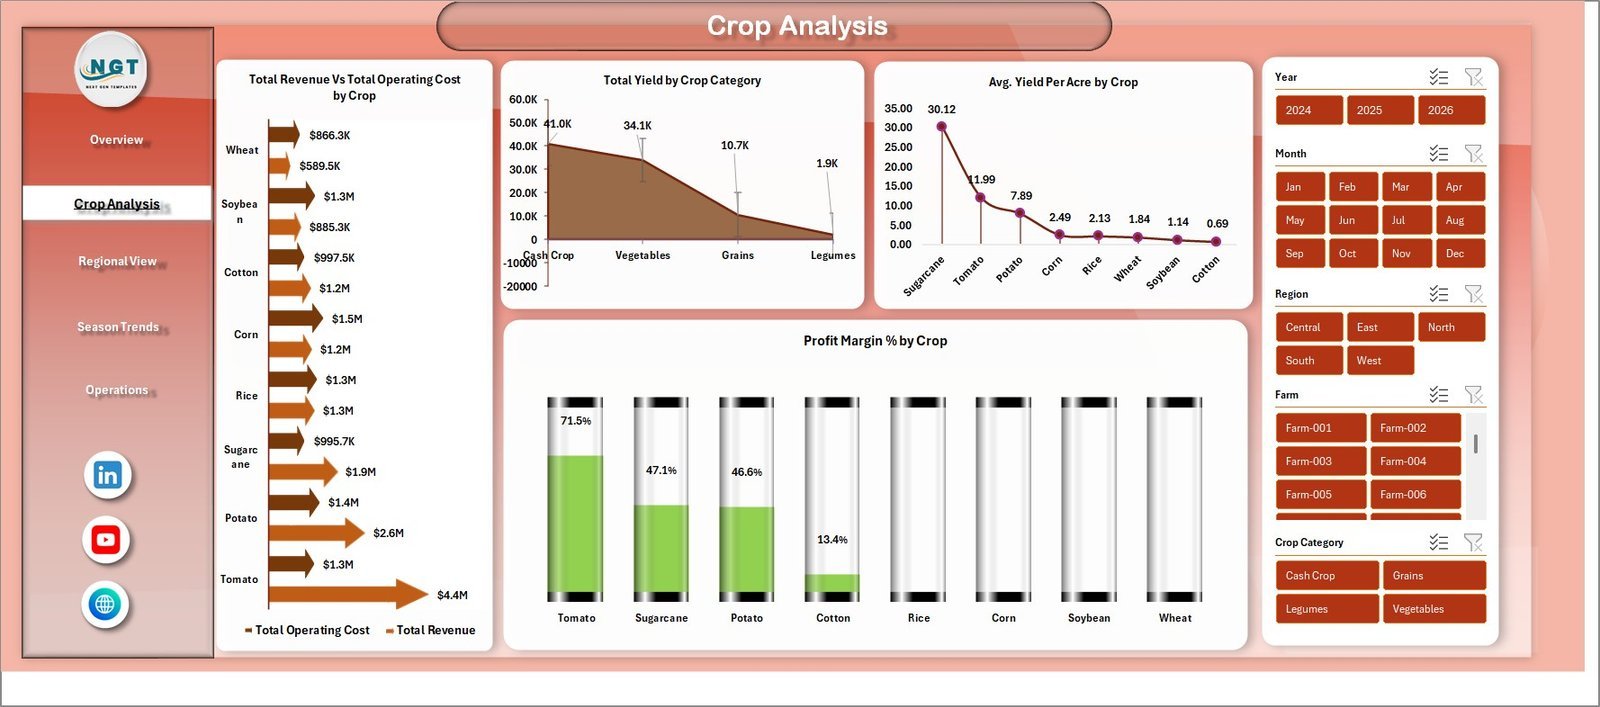
This is the most complete of the farm templates here, which is why it ranks first. Seven sheet tabs (five interactive analysis pages, a data sheet and a support sheet of pivot tables) answer the questions a farm owner asks every month: which crops pay, which regions deliver, and where the operating cost is going.
Who it is for: farm owners, agronomists and farm office managers who already work in Excel and want a farm management Excel template with no macros or add-ins.
- Five KPI cards: Total Revenue, Net Farm Profit, Total Area, Total Yield and Total Records.
- Crop Analysis with revenue vs operating cost by crop, yield by crop category, average yield per acre and profit margin % by crop.
- Regional View with revenue, area and water used by region, plus net farm profit by irrigation type.
- Season Trends and Operations pages: revenue by season and year, harvest success rate, water used by irrigation and yield per acre by soil type.
- Slicers for region, crop, season and irrigation type; one Refresh All updates every page.
Concrete uses: spot that one crop brings 30% of revenue but a far smaller share of profit once operating cost is counted; compare drip and flood irrigation on profit per acre before you invest in new lines; and hand a lender a one-page overview instead of a stack of invoices. Price: $17.99. Get the Agriculture and Farm Dashboard in Excel →
Best for: the farm that wants one complete Excel view of crops, regions, seasons and operations.
2. Agriculture and Farm Dashboard in Power BI
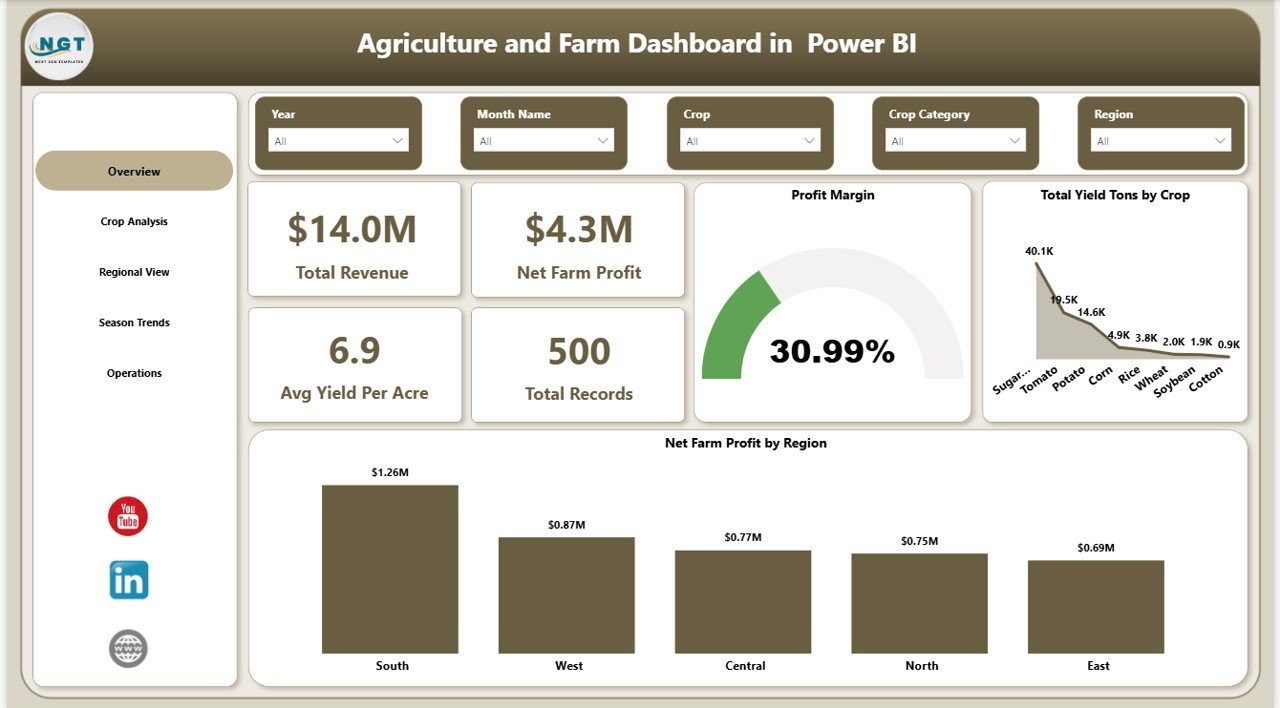
The same analytical idea, rebuilt as a five-page Power BI report. Once your records run into thousands of rows, or several farms, sites or buyers feed one report, Power BI handles the volume and gives you drill-down that a workbook cannot match.
Who it is for: larger farms, cooperatives and agribusiness analysts who present results to owners, boards or lenders on screen.
- KPI cards for Total Revenue, Net Farm Profit, Avg Yield Per Acre, Total Records and Profit Margin.
- Pages for Overview, Crop Analysis, Regional View, Season Trends and Operations.
- Slicers for region, crop, season, irrigation type, soil type and buyer type.
- Charts such as yield tons by crop, net farm profit by region, harvest success rate by season and revenue by buyer type.
Concrete uses: compare net profit by irrigation method across five regions in one click, find which soil type gives the best average yield per acre, and see which buyer type pays best by season. Price: $17.99. Get the Agriculture and Farm Dashboard in Power BI →
Best for: multi-site operations that have outgrown a single workbook.
3. Agriculture Farm Dashboard in Google Sheets: best value
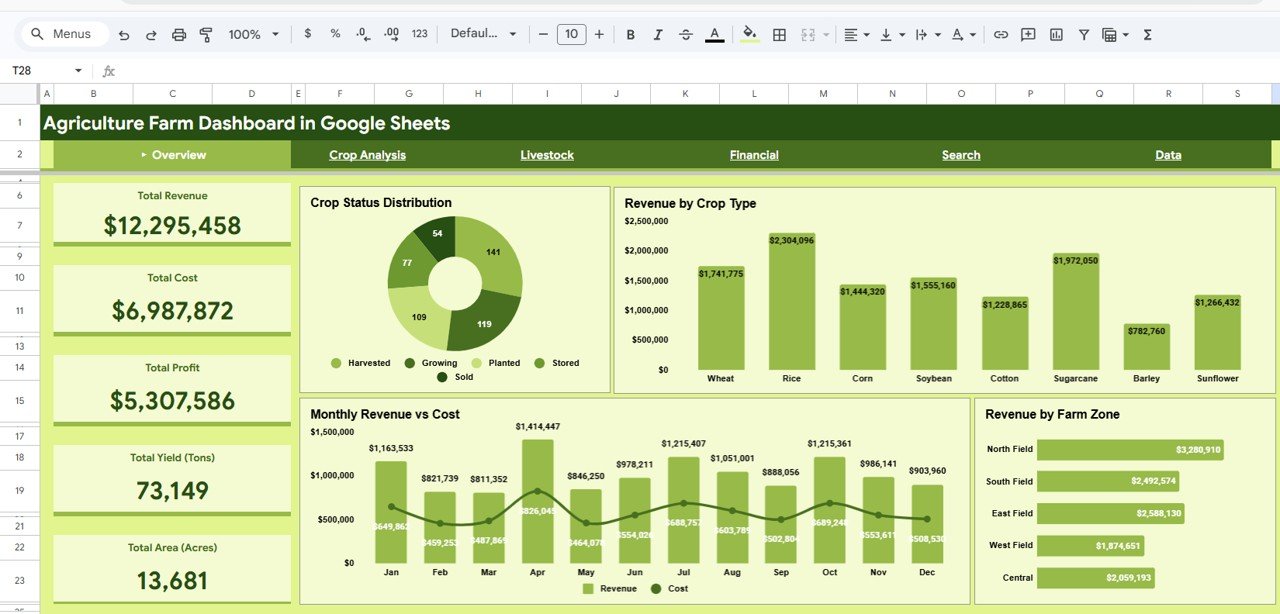
At $9.99 this is the cheapest of the farm templates, and it is the only one with a dedicated Livestock tab, which makes it the natural pick for mixed crop and animal farms. It runs in the browser, so a partner, family member or adviser can see the same numbers without buying any software.
Who it is for: small and mid-size mixed farms, and anyone who wants shared, live access from a phone or laptop.
- Six tabs: Overview, Crop Analysis, Livestock, Financial, Search Page and Data Sheet.
- Five KPI cards: Total Revenue, Total Cost, Total Profit, Total Yield (Tons) and Total Area (Acres).
- Livestock count and output by type, distribution by zone and a monthly output trend.
- Monthly revenue vs cost, revenue by farm zone and crop status distribution; filters for crop type, farm zone, season and livestock type.
Concrete uses: see dairy and grain income side by side, check monthly cost against revenue before cash gets tight, and look up any single record on the Search Page. Price: $9.99. Get the Agriculture Farm Dashboard in Google Sheets →
Best for: mixed crop and livestock farms on a tight budget.
4. Agriculture and Farm Dashboard in HTML
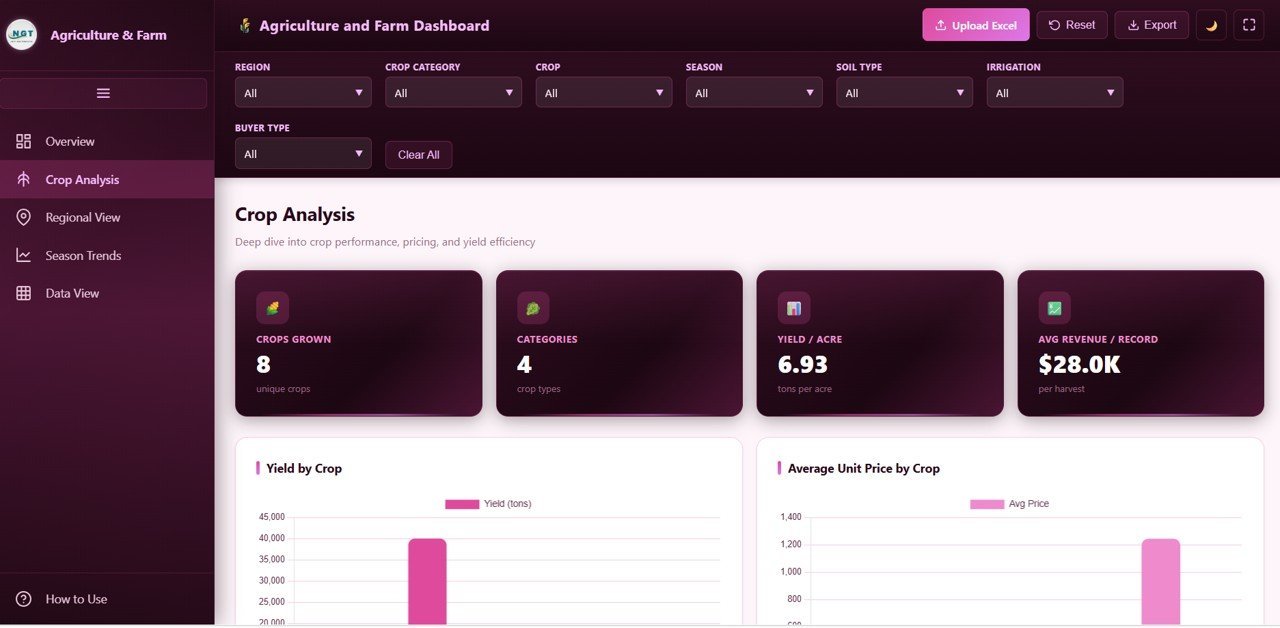
A farm dashboard that opens in any web browser with nothing to install. You upload an Excel or CSV file and the five pages adapt to your data, which makes it the easiest option for a farm without Office or Power BI on every machine.
Who it is for: farm owners who want to check numbers from the field on a phone or tablet, and consultants who send a dashboard to several clients.
- Pages for Overview, Crop Analysis, Regional View, Season Trends and Data View.
- KPI cards for Total Revenue, Total Yield Tons, Area Cultivated, Avg Unit Price and Active Farms.
- Multi-select filters for region, crop, season, farm, buyer type, irrigation method and soil type.
- Excel/CSV upload, CSV export of any filtered view, light and dark themes, fully responsive layout.
Concrete uses: compare top eight crops by revenue across several farms, export one region’s filtered records for an agronomist, and review the monthly revenue trend on a phone. Price: $12.99. Get the Agriculture and Farm Dashboard in HTML →
Best for: mobile-first farm owners and advisers serving several farms.
Not sure which format? Start with the best overall Agriculture and Farm Dashboard in Excel ($17.99), or try the best-value Google Sheets farm dashboard ($9.99) if you also keep livestock. Both cost less than one month of most farm management software.
5. Farm Management KPI Dashboard in Excel
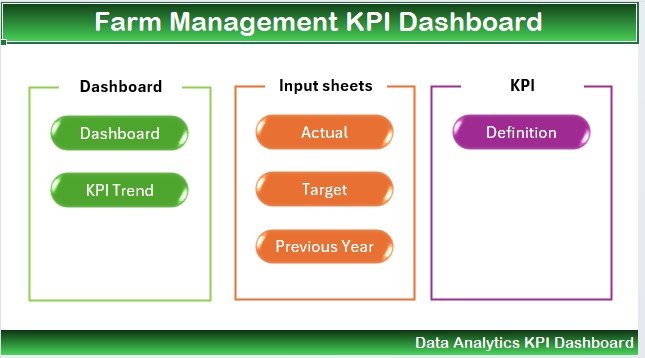
Where the first four picks analyse transaction records, this KPI dashboard tracks the farm against targets. It is the farm management Excel template for a manager who wants to know, every month, whether yield, labor, equipment and resource use are on plan.
Who it is for: farm managers, agricultural consultants and owners of operations with staff and machinery to manage.
- Crop yield and production tracking with harvest trends.
- Revenue and financial performance across crop sales, livestock and other activities.
- Labor hours, workforce productivity and task completion.
- Equipment usage, maintenance and downtime; water and fertilizer use.
Concrete uses: flag a tractor whose downtime keeps rising before peak season, compare labor hours per acre against last year, and track fertilizer use against plan. Price: $14.99. Get the Farm Management KPI Dashboard in Excel →
Best for: managers running a farm against monthly targets.
6. Smart Agriculture KPI Dashboard in Excel
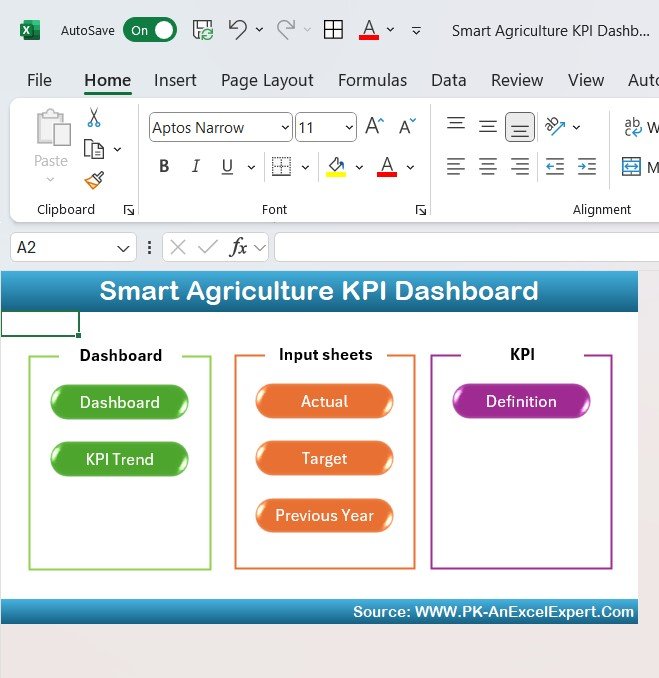
Built around precision and resource efficiency rather than sales. If your questions are about water, soil and pests, this is the template that tracks them.
Who it is for: greenhouse operators, sustainability-focused growers and agronomy consultants.
- Crop yield and growth tracking, including harvest forecasts.
- Irrigation efficiency and water usage monitoring.
- Pest and disease monitoring, including pesticide use.
- Soil moisture and resource conservation KPIs.
Concrete uses: show a buyer or certifier that water use per tonne fell year on year, compare pest-control methods on cost and outcome, and catch an irrigation problem in one block early. Price: $14.99. Get the Smart Agriculture KPI Dashboard in Excel →
Best for: growers who manage to resource-efficiency targets.
7. Agriculture KPI Dashboard in Google Sheets
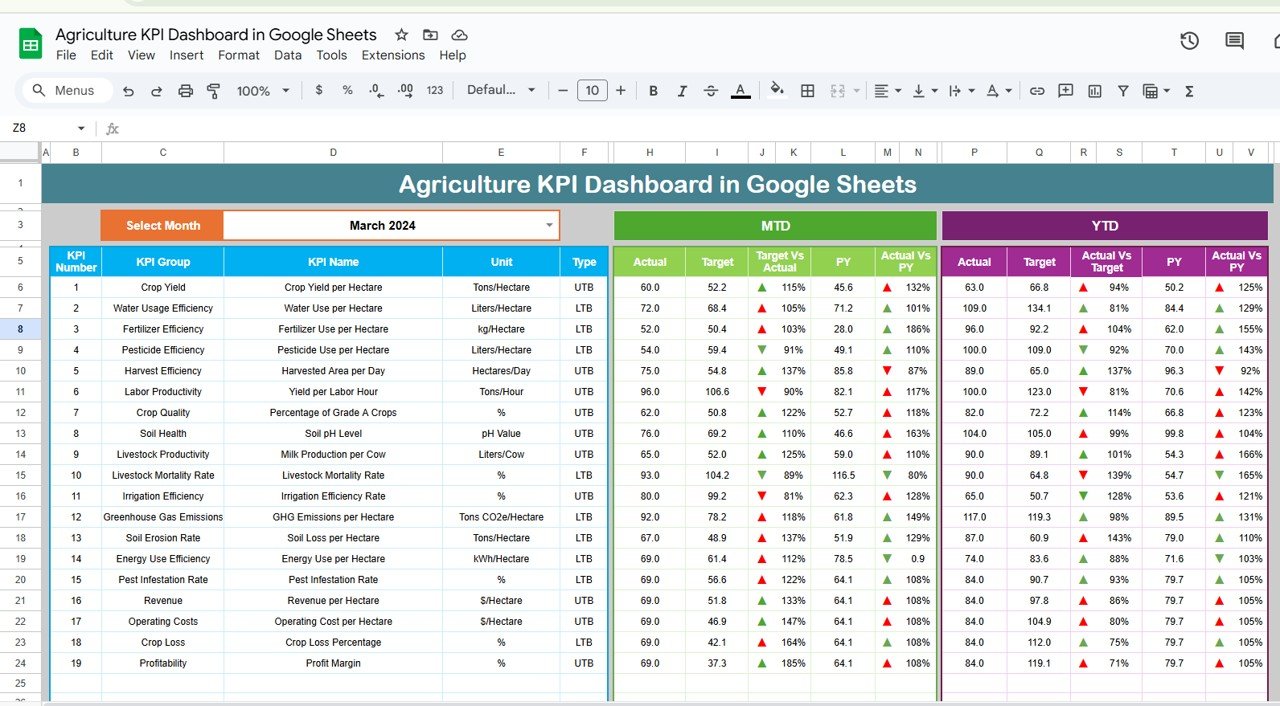
A Google Sheets KPI dashboard for teams who want target-versus-actual reporting they can share. It covers crop yield per hectare, soil health, irrigation efficiency and labor productivity, with month-to-date and year-to-date views.
Who it is for: farm teams and agricultural organisations that report monthly to an owner, cooperative or funder.
- KPIs such as crop yield per hectare, irrigation efficiency, soil moisture and labor productivity.
- MTD and YTD tracking with target vs actual comparison.
- Inputs for actual, target and historical data.
- Charts that update as you enter each month’s numbers.
Concrete uses: report monthly yield against target to a cooperative board, track irrigation efficiency through a dry season, and keep a shared record of labor productivity across crews. Price: $12.99. Get the Agriculture KPI Dashboard in Google Sheets →
Best for: shared monthly KPI reporting in the browser.
8. Agricultural Exports KPI Dashboard in Excel
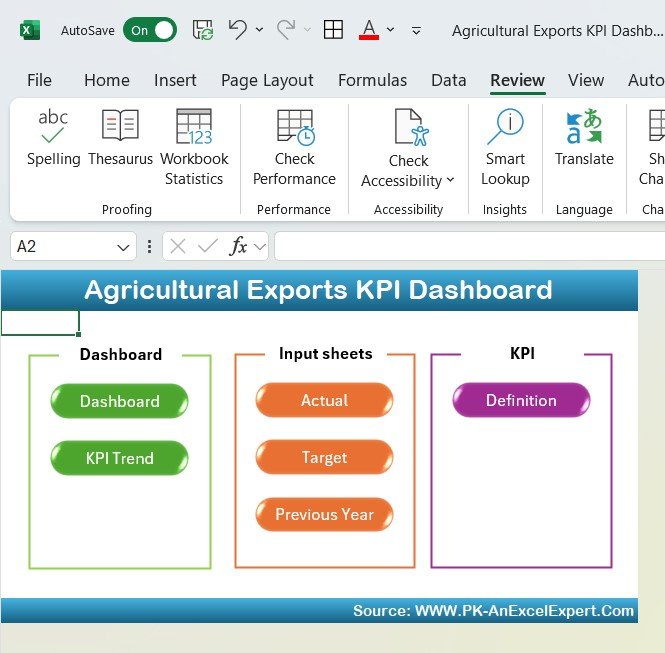
The specialist pick. Exporters care less about yield per acre and more about markets, products and shipments, and this dashboard is built for exactly that.
Who it is for: agri-exporters, trading companies and export-oriented cooperatives.
- Export volume, export revenue and sales growth over time.
- Performance by destination region and country.
- Product-level performance by sales, revenue and volume.
- Supply chain efficiency and customer satisfaction tracking.
Concrete uses: see which destination market grew fastest this year, find the product line with falling volume, and track whether delivery delays are hurting repeat orders. Price: $14.99. Get the Agricultural Exports KPI Dashboard in Excel →
Best for: businesses that sell farm produce across borders.
The farm KPIs every farm dashboard should show
Whichever of these farm templates you choose, make sure it shows the handful of numbers that actually drive farm decisions. Here are the formulas, so you can check any template or build your own columns.
| KPI | Formula | What it tells you |
|---|---|---|
| Yield per acre | Total yield ÷ acres harvested | Productivity of each crop, field or soil type |
| Operating cost per acre | Total operating cost ÷ acres planted | Where input, fuel and labor cost is concentrated |
| Net farm profit | Gross farm revenue − total operating cost | Whether the season actually made money |
| Profit margin % | Net farm profit ÷ gross farm revenue × 100 | Which crop or region turns revenue into profit |
| Operating expense ratio | Total operating expenses ÷ gross farm revenue | How much of every dollar earned goes on running costs |
| Harvest success rate | Successful harvests ÷ total plantings × 100 | Crop-loss risk by season or crop |
| Water use efficiency | Yield ÷ water used | Return on irrigation, by method or region |
| Labor hours per acre | Total labor hours ÷ acres worked | Labor productivity by crop and crew |
On the operating expense ratio, farm finance guidance from US university extension services commonly treats a ratio below about 65% as strong and above about 80% as a warning sign. Use the ratio as a trend rather than a pass mark: a rising ratio over three seasons matters more than one year’s figure.
How to choose between these farm templates
- You work in Excel and want one complete view: the Agriculture and Farm Dashboard in Excel.
- You keep livestock as well as crops, or need shared access: the Google Sheets farm dashboard.
- You run several farms or thousands of records: the Power BI farm dashboard.
- You want it on your phone with no software: the HTML farm dashboard.
- You manage against monthly targets: the Farm Management KPI Dashboard, or the Smart Agriculture KPI Dashboard if water and soil are your focus.
- You export produce: the Agricultural Exports KPI Dashboard.
Running a poultry operation? The Poultry Farming Dashboard in Excel is built for flocks, feed and egg output. If your team prefers Power BI for KPI tracking, there is also a Farm Management KPI Dashboard in Power BI.
When farm templates are NOT the right answer
Farm templates are analysis and reporting tools. Be honest about where they stop:
- Field mapping and precision agriculture. If you need field boundaries, variable-rate prescriptions, yield maps or machine data streaming in, buy farm management software that connects to your equipment.
- Mobile record entry by crews. Templates expect someone to paste or type data in. If ten people need to log spraying or feeding from the field each day, software with a mobile app will save more time than it costs.
- Compliance and traceability records. Organic certification, food-safety audits and lot traceability need audit trails a spreadsheet does not provide.
- Full farm accounting. These dashboards report profit; they are not a general ledger. Keep your accounting software or accountant for tax and payroll.
For everyone else, especially family farms and small agribusinesses that already keep records in spreadsheets, farm templates are the fastest and cheapest way to see what the numbers say. The USDA Census of Agriculture is a useful source if you want to compare your farm’s scale and sales with others in your county or state.
Frequently asked questions
What are farm templates?
Farm templates are ready-made Excel, Google Sheets, Power BI or HTML files that turn farm records into a working dashboard. You paste in crop, yield, cost, livestock or sales data and the template calculates revenue, profit, yield per acre and other KPIs, with charts and filters already built.
What is the best farm management Excel template?
For most farms the best farm management Excel template is the Agriculture and Farm Dashboard in Excel at $17.99. It has five analysis pages covering overview, crops, regions, seasons and operations, needs no macros, and refreshes every chart with one Refresh All click after you paste in your own data.
How much do farm templates cost?
The eight farm templates in this roundup cost between $9.99 and $17.99 each, as one-time purchases. By comparison, Farmbrite’s published farm management software plans start at $29 per month and its combined crop and livestock plans reach $109 per month, so a template usually costs less than one month of software.
Is there a farm dashboard in Google Sheets?
Yes. The Agriculture Farm Dashboard in Google Sheets costs $9.99 and has six tabs: Overview, Crop Analysis, Livestock, Financial, Search Page and Data Sheet. You make a copy to your own Google Drive, replace the sample rows, and share it with partners or advisers who only need a browser.
Can a farm template track livestock as well as crops?
Yes, if you pick the right one. The Google Sheets Agriculture Farm Dashboard has a dedicated Livestock tab with livestock count and output by type, distribution by zone and a monthly output trend. The Farm Management KPI Dashboard in Excel also covers livestock production alongside crops, finance, labor and equipment.
Which KPIs should a farm dashboard show?
Start with total revenue, total operating cost, net farm profit, profit margin, yield per acre and area cultivated. Then add the drivers for your operation: water used by irrigation type, harvest success rate, labor hours, equipment downtime, or export volume by destination. The templates above include most of these already.
Can farm templates replace farm management software?
Not completely. Farm templates are excellent for analysis and reporting on data you already keep. Farm management software adds field mapping, mobile record entry, GPS or sensor feeds, inventory and compliance records. Many small and mid-size farms use a template first and only move to software once data entry becomes the bottleneck.
Do I need Power BI Pro for the Power BI farm dashboard?
No. You can open, edit and refresh the Agriculture and Farm Dashboard in Power BI with the free Power BI Desktop app on Windows. You only need a Power BI Pro licence if you want to publish the report to the Power BI service and share it online with other people.
Can I change the crops, regions and KPIs in these templates?
Yes. Every template works from a data sheet or input table, so new crops, fields, regions, seasons or buyers flow through to the charts once you add rows and refresh. Labels, colours and logos can be edited, and the KPI dashboards let you adjust targets for each metric.
How do I start using a farm template after I buy it?
Download the file, open the data sheet and look at the sample rows to see each column. Replace them with one season of your own records, refresh the dashboard, and check the totals against your accounts. Then set up a monthly routine: add new rows, refresh, and review the overview page.
Get more farm templates and business dashboards
Ready to see what your farm actually earns? Start with the best overall Agriculture and Farm Dashboard in Excel ($17.99), or the best-value Agriculture Farm Dashboard in Google Sheets ($9.99). Every one of these farm templates is a one-time purchase between $9.99 and $17.99, less than a single month of most farm management software.
Running the rest of the business too? See our inventory management Excel templates for seed, feed and chemical stock, warehouse management templates for packing sheds and stores, fixed asset tracking templates for tractors and equipment, supplier management Excel templates for input vendors, project management dashboard templates for building and planting projects, energy management KPIs for pumps and cold stores, and the 25 best-selling business templates. Subscribe to the NextGenTemplates YouTube channel for setup walkthroughs.