

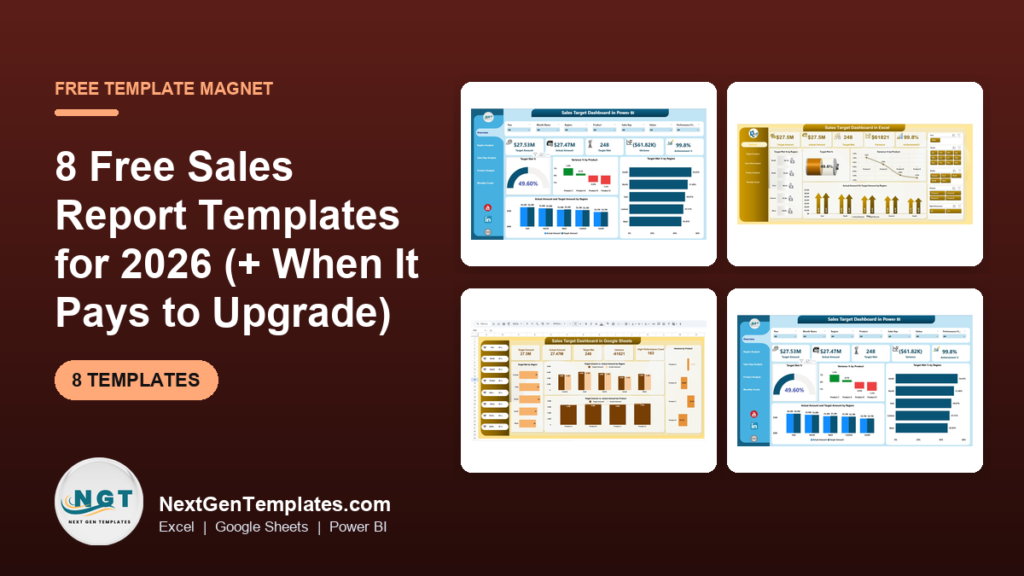
The best free sales report template in Excel is a basic one from Microsoft Create or Vertex42, which handles a simple sales list with totals. When you need target vs actual, slicers or rep rankings, a paid template such as the Sales Target Report in Excel ($6.99) saves hours. All 8 NGT templates below are paid upgrades.
Last updated: November 2026
Key takeaways
- Free sales report templates from Microsoft Create, Vertex42 and the Google Sheets gallery cover basic sales lists and totals, and cost nothing.
- The 8 NGT templates in this post are paid, and 6 of them cost $6.99 each, with the Excel and Power BI target dashboards at $17.99.
- The Sales Target Report in Excel ($6.99) is our top pick: 5 KPI cards, slicers for region, product and date, and 5 charts in a no-add-in .xlsx file.
- The Monthly Sales Tracker and Report in Google Sheets is the best value at $6.99 (regular price $14.99) for teams that work in the browser.
- If your report only needs a sales list and a SUM total, stay on a free template. Pay only when you need target vs actual, variance % or rep and product rankings.
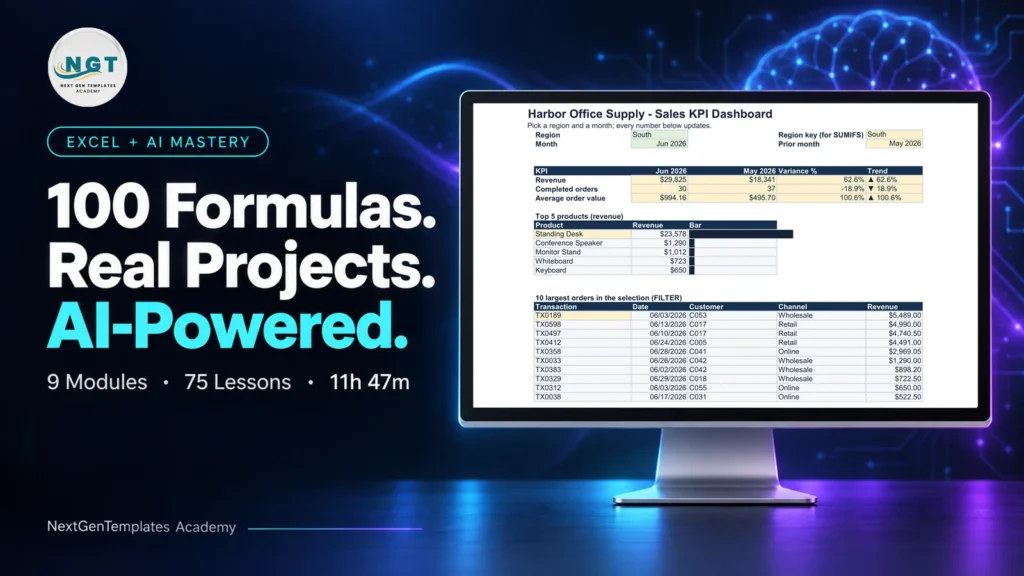 Launch offer
SUMIFS, XLOOKUP, FILTER, LAMBDA and checking AI-written formulas, with real business projects. 11h 47m of video by PK, with practice files, quizzes and a capstone.
Free and paid sales report templates compared
The table lists the 8 NGT templates with their formats and prices. The free options from other sites come after the table, since their contents change and we do not control them.
| Template | Format | Best For | Price |
|---|---|---|---|
| Sales Target Report in Excel (Best overall) | Excel (.xlsx) | Target vs actual reporting with slicers | $6.99 |
| Monthly Sales Tracker and Report in Google Sheets (Best value) | Google Sheets | Monthly review meetings and remote teams | $6.99 |
| Sales Target Dashboard in Excel | Excel | Managers who want 5 dashboard pages | $17.99 |
| Sales Target Dashboard in Power BI | Power BI | Leadership views with previous-year comparison | $17.99 |
| Daily Sales Report Form in Google Sheets | Google Sheets | Shops and small teams logging sales every day | $6.99 |
| Digital Product Sales Tracker in Google Sheets | Google Sheets | Sellers of eBooks, courses and templates | $6.99 |
| Print-on-Demand Sales Tracker in Google Sheets | Google Sheets | T-shirt, mug and poster sellers watching net profit | $6.99 |
| Sales Target Dashboard in Google Sheets | Google Sheets | Cloud dashboard for shared team use | $6.99 |
How we picked these
We searched the NGT catalog of roughly 6,900 templates for sales reporting, sales targets and sales tracking products, and kept only paid, complete templates. We favoured files that show target vs actual, rankings by rep, product or region, and charts that update when data changes. We left out single-purpose trackers with no reporting view and anything only loosely related to sales.
The free options in the next section are described in general terms because we have not audited every file on those sites. We did not create or host any free file ourselves, and we will not point you to a download that does not exist.
Where can you find a free sales report template for Excel?
Three sources cover most needs. Microsoft Create offers Excel templates you can open directly in the app, including simple sales and invoice-style layouts. Vertex42 has a long-running library of spreadsheet templates, with many free to download. The Google Sheets template gallery has a small set of built-in business templates you can copy to your Drive.
What you get is usually a sales log with a total at the bottom, sometimes a basic chart. That is fine for a one-person shop that reports to nobody. Free files tend to stop short of target vs actual, variance %, filters and rankings, so you add those yourself with SUMIFS, pivot tables and chart setup.
Be plain about the cost of free: if you spend two hours building a pivot-based report every month, that is 24 hours a year. A $6.99 template that already has the report built pays for itself the first time you use it. If your report is a list and a total, skip the upgrade.
What should a sales report template calculate?
Before comparing templates, know the numbers a good report must produce. These are the standard definitions, and every paid template below is built around them.
- Achievement % = Actual sales / Target x 100.
- Variance % = (Actual – Target) / Target x 100.
- Target met % = Number of reps, products or regions at or above target / Total number x 100.
- Net revenue = Gross revenue – refunds – platform fees.
- Profit margin = Net profit / Revenue x 100.
Worked example: a region has a monthly target of $50,000 and closes $43,500. Achievement is 43,500 / 50,000 = 87%. Variance is (43,500 – 50,000) / 50,000 = -13%. If 3 of your 8 reps hit target that month, target met % for the team is 3 / 8 = 37.5%. A good template calculates all three without you writing a formula. For a deeper look at which metrics to prioritise, read our guide to sales KPIs to track in 2026.
The 8 best paid upgrades from a free sales report template for 2026
These 8 templates are paid. Each is a one-time purchase and the prices below are the current prices on the product pages.
1. Sales Target Report in Excel: best overall
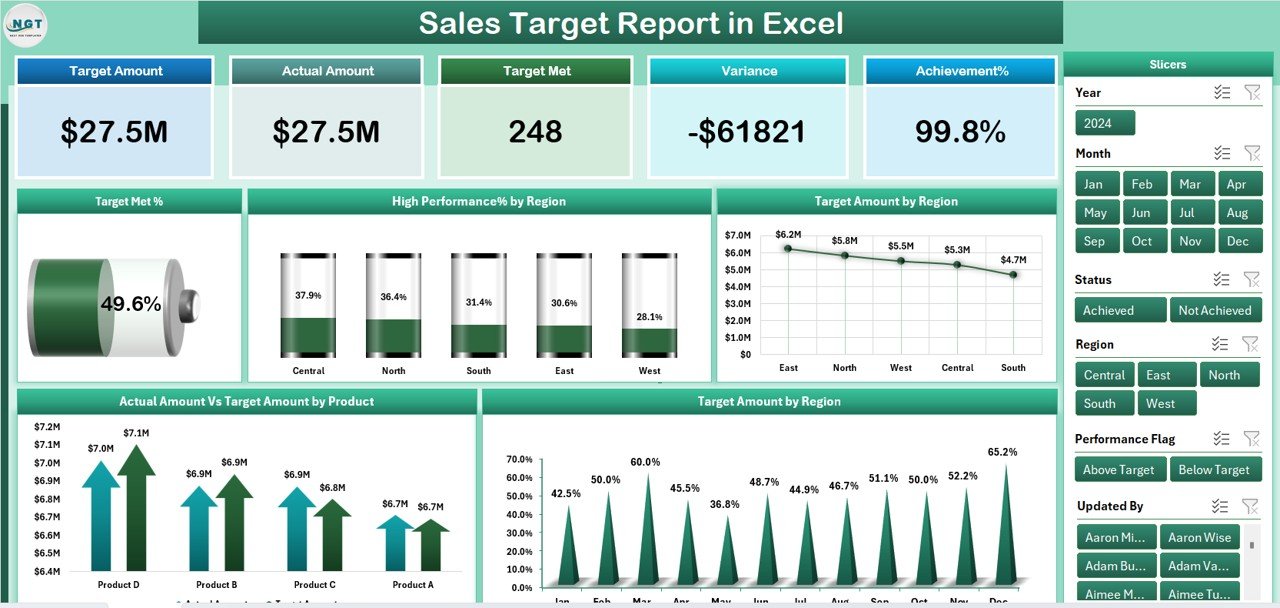
This is an Excel report that compares actual sales to targets by region, product and date. It is our number one pick because it is the closest paid step up from a free sales list: still a normal .xlsx file, no add-ins, and the report is already built.
Who it is for: sales managers and analysts who send a monthly target report to management.
- Summary page with 5 KPI cards, including Total Sales, Target Met % and High-Performance %.
- Slicers to filter by region, product or date range.
- 5 charts, such as Actual vs Target by Product and Target Amount by Region.
- Report page with a drill-down data table, plus a structured data sheet for actuals and targets.
- Support sheet that holds exchange rates, product categories and validation lists.
Use cases: check which of 4 regions missed a quarterly target; compare 12 products against their individual goals; filter to one month before a review meeting; use conditional formatting to spot over- and under-performance at a glance.
Price: $6.99. Get the Sales Target Report in Excel.
Best for: anyone outgrowing a free Excel sales list who still wants to stay in Excel.
2. Monthly Sales Tracker and Report in Google Sheets: best value
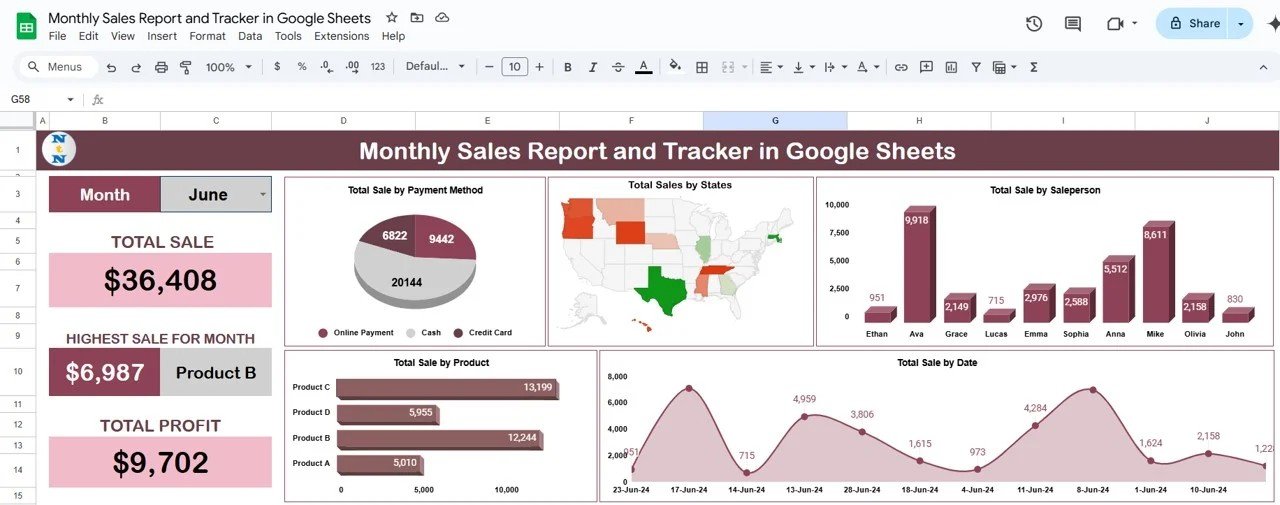
A cloud template that turns raw sales entries into a monthly performance report with target vs actual, variance %, top products and top reps. You copy it to your Drive, paste your data and the report updates. It is priced at $6.99 against a regular price of $14.99, which makes it the best value of the eight.
Who it is for: small business owners, e-commerce sellers, retail managers and field sales managers who review sales monthly.
- Sales Data Entry sheet with columns for Date, Customer, Product, Rep, Region and Revenue.
- Monthly Report tab with Target vs Actual, variance %, top products and top reps.
- Targets and Goals sheet: set targets once and variance recalculates everywhere.
- Built with Google Sheets formulas (QUERY, SUMIFS) and native charts.
Use cases: run a monthly 1:1 with each rep using the rep table; roll Shopify, Etsy or Amazon orders into one revenue view; share a live link with a partner instead of emailing a file; check the report from a phone while visiting a store.
Price: $6.99 (regular $14.99). Get the monthly sales tracker in Google Sheets.
Best for: teams that live in a browser and want a monthly report without Salesforce or HubSpot.
3. Sales Target Dashboard in Excel
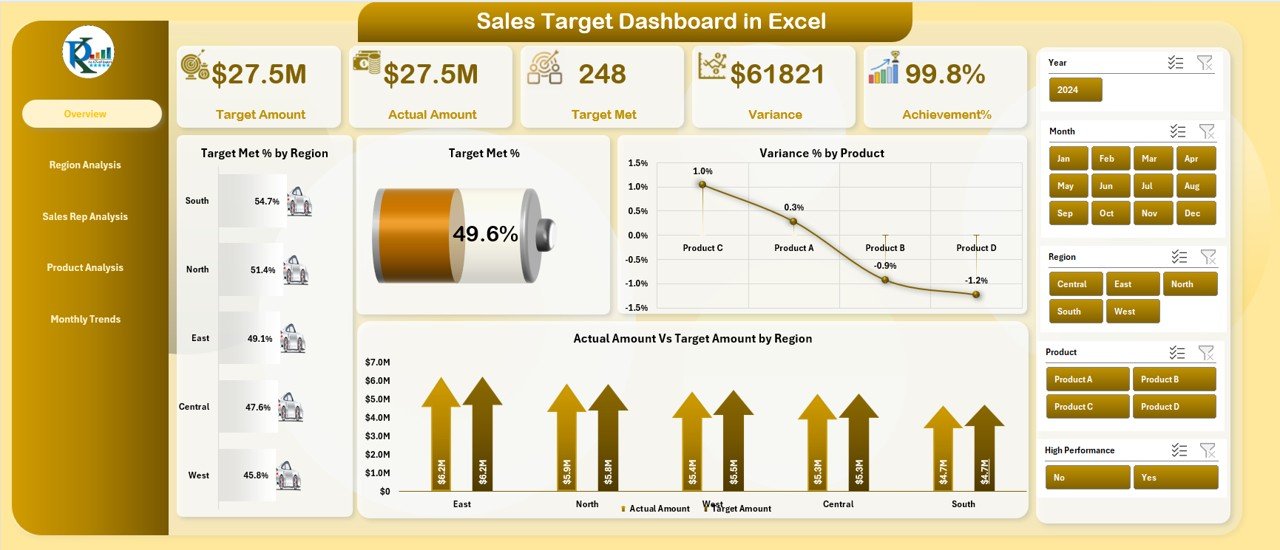
An Excel dashboard with 5 pages: Overview, Region Analysis, Sales Rep Analysis, Product Analysis and Monthly Trends. It costs more than the report above because it is a full multi-page dashboard rather than a single report view.
Who it is for: sales leaders who present results and want each cut of the data on its own page.
- Prebuilt metric cards: Total Sales, Target, Achievement %, Target Met % and Variance %.
- Charts for Actual vs Target, Target Met %, High Performance % and Achievement %.
- Slicers for region, sales rep, product, month and year.
- Rep page that shows top 5 performer metrics.
- Built in Excel with no add-ins.
Use cases: rank your top 5 reps before a bonus review; find which product line missed its target; spot a seasonal dip on the Monthly Trends page; filter to a single region and year for a board slide.
Price: $17.99. Get the Sales Target Dashboard in Excel.
Best for: managers who present to leadership and want a page per question.
If you are comparing more dashboard options, see our list of the best sales dashboard templates for 2026.
Start with the $6.99 report. The Sales Target Report in Excel costs $6.99 and the Monthly Sales Tracker and Report in Google Sheets costs $6.99 (regular $14.99). Both are one-time purchases. Watch tutorials on the NextGenTemplates YouTube channel.
4. Sales Target Dashboard in Power BI
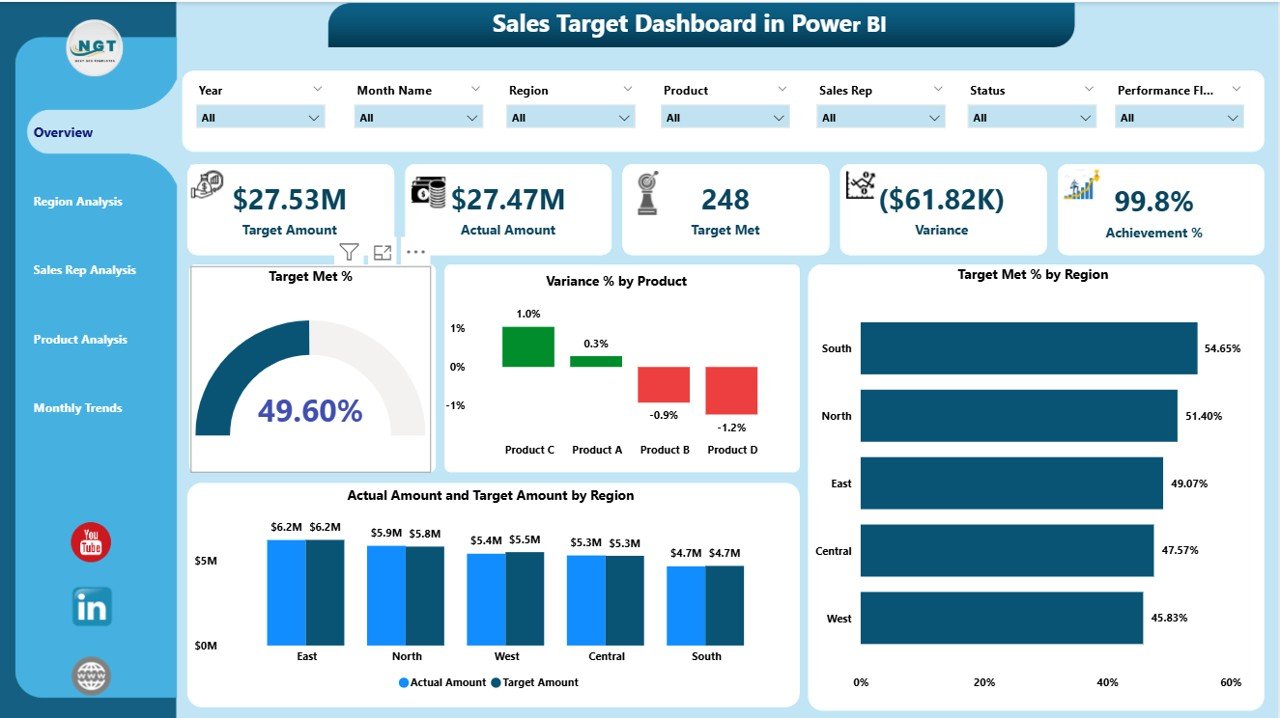
The Power BI version of the same idea. It connects to your Excel data input and shows sales vs target by region, rep and product, with pages for Overview, Region Analysis, Sales Rep, Product and Monthly Trends.
Who it is for: teams that already use Power BI and want a managed target view instead of fragmented spreadsheets.
- Overview page with target met % and variance %.
- Region page comparing Target Met %, Achievement % and High Performance %.
- Sales Rep page to spot training and support needs.
- Real-time comparison of Actual vs Target vs Previous Year (MTD and YTD).
- Slicers for month, region, product or rep.
Use cases: compare this year with last year on one chart; look for seasonality on the Monthly Trends page; find the products that need a different strategy; give leadership one clean view instead of several files.
Price: $17.99. Get the Sales Target Dashboard in Power BI.
Best for: Power BI users who want previous-year comparison built in.
5. Daily Sales Report Form in Google Sheets

A Google Sheets daily sales form that logs every sale, calculates total quantity and total sales, and feeds a dashboard. It is a data-entry first tool, so it suits businesses where sales happen every day.
Who it is for: retail stores, small businesses and small sales teams.
- Daily Sales Form with date dropdowns and auto-calculated Total Quantity and Total Sales.
- Dashboard sheet with Total Sales and Quantity Sold cards, plus charts by product, rep and month.
- Database sheet that logs every entry for historical analysis.
- List sheet holding products and unit prices that sync to the form.
Use cases: close the till at the end of the day and enter totals in one form; compare reps by total sales; see which product sells the most units in a month; keep a price list in one place so unit prices stop drifting.
Price: $6.99. Get the Daily Sales Report Form in Google Sheets.
Best for: daily sales capture where a monthly report alone is too slow.
6. Digital Product Sales Tracker in Google Sheets
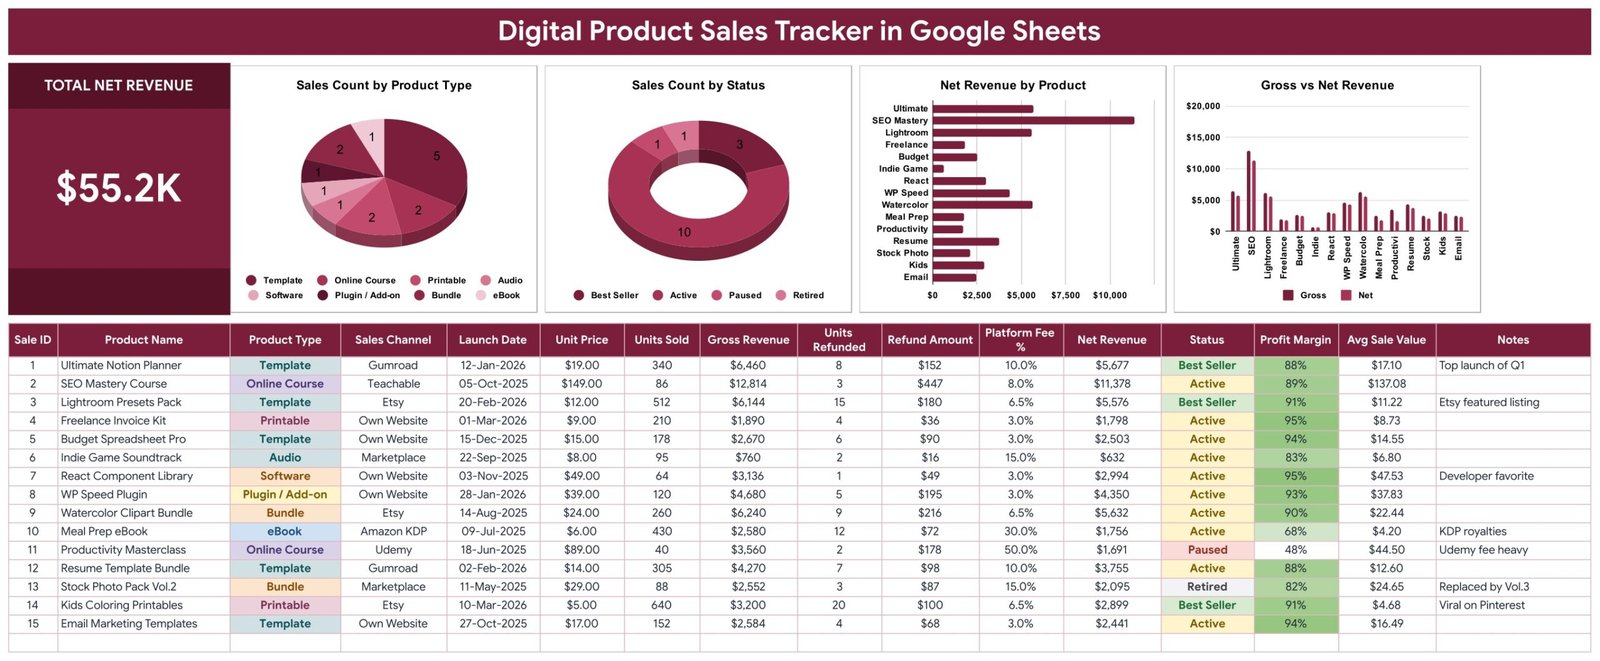
A one-page tracker for people selling eBooks, courses, templates, presets or plugins. It shows units, refunds, fees and net revenue per product, with a Total Net Revenue card and 4 charts.
Who it is for: creators and online sellers who need to see what they keep after refunds and platform fees.
- 16 columns, 6 of which calculate themselves: Sale ID, Gross Revenue, Refund Amount, Net Revenue, Profit Margin and Avg Sale Value.
- 4 charts: Sales Count by Product Type, Sales Count by Status, Net Revenue by Product and Gross vs Net Revenue.
- Sample data of 15 products, 8 product types, 7 sales channels and 4 statuses.
- Self-updating dropdowns.
Use cases: in the sample, the SEO Mastery Course turns $12,814 gross into $11,378 net after refunds and fee; compare channels by profit margin; see how refunds eat into one product; swap in your own rows and the $55.2K sample card refreshes to your figures.
Price: $6.99. Get the Digital Product Sales Tracker in Google Sheets.
Best for: digital sellers who care about net revenue more than gross.
7. Print-on-Demand Sales Tracker in Google Sheets
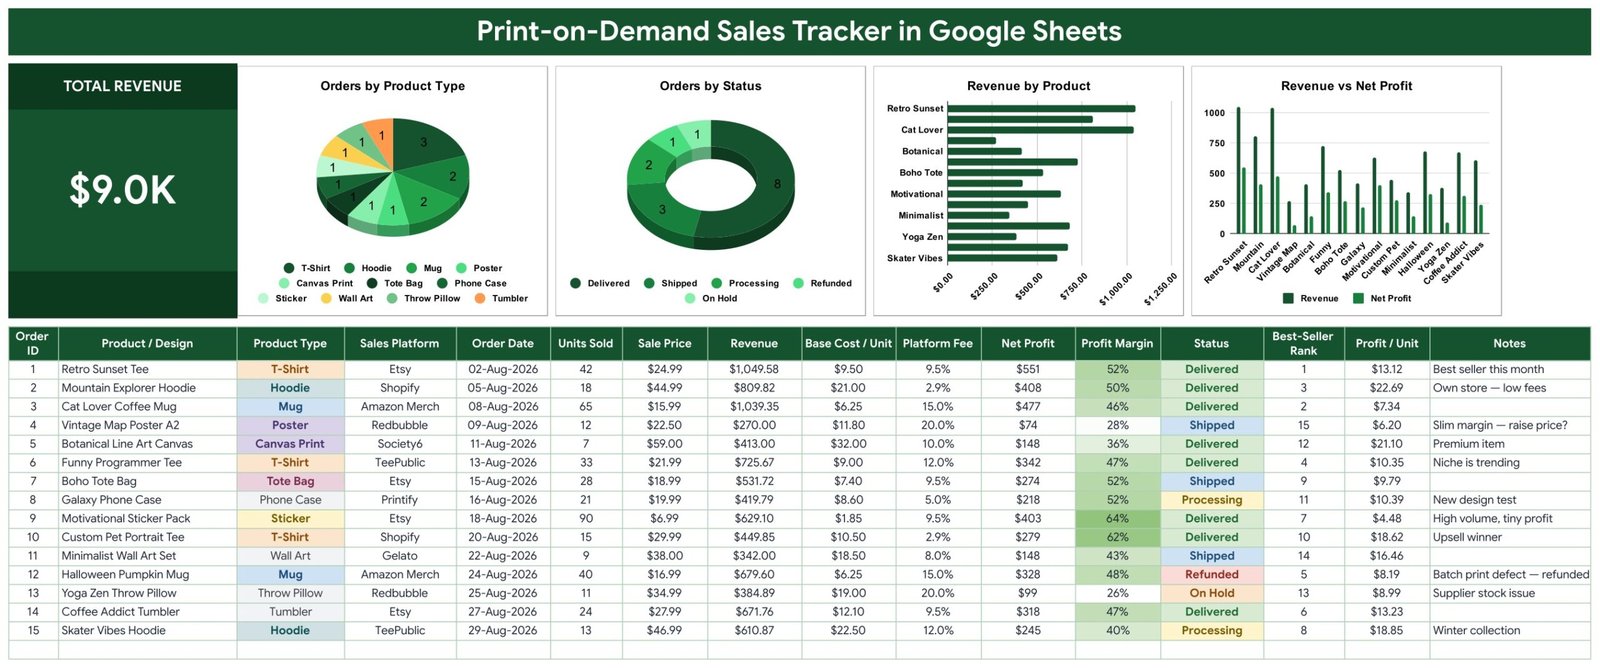
A Google Sheets order register for T-shirt, mug, poster, sticker and home-decor sellers. It works out revenue, net profit, profit margin, profit per unit and a best-seller rank for every order, and flags a net loss in red.
Who it is for: print-on-demand sellers on several marketplaces or their own store.
- Total Revenue card plus 4 charts: Orders by Product Type, Orders by Status, Revenue by Product and Revenue vs Net Profit.
- 16-column order register, including Base Cost / Unit, Platform Fee and Net Profit.
- Net Profit = revenue minus production cost minus the platform fee.
- Status workflow: Processing, Shipped, Delivered, Refunded, On Hold and Cancelled.
- Manual entry in your own Drive copy, with no API connection.
Use cases: find which designs make money after base costs; spot a loss-making mug in red; add a new marketplace to the dropdown; keep refunded and cancelled orders visible.
Price: $6.99. Get the Print-on-Demand Sales Tracker in Google Sheets.
Best for: sellers who need profit by design, not just sales counts.
8. Sales Target Dashboard in Google Sheets

A cloud-based Google Sheets dashboard with auto-updating visuals, built for shared team use. A note of caution: the product listing text for this item describes tracking budget, spend and revenue by channel, region, campaign objective and month. Read the product page and gallery images to confirm the layout fits your need before buying.
Who it is for: teams that want a shared, browser-based dashboard and are comfortable checking the layout first.
- Auto-updating dashboard with real-time insights.
- Region-wise insights and monthly trend tracking.
- Cloud-based collaboration in Google Sheets.
Use cases: share one live link with finance and leadership; compare results by region; follow monthly trends; avoid a paid BI tool.
Price: $6.99. See the Sales Target Dashboard in Google Sheets.
Best for: shared Google Sheets dashboards, once you have confirmed the layout.
How do you choose between these templates?
Match the tool to the job. A decision table is faster than reading all eight sections again.
| If you… | Choose |
|---|---|
| Work in Excel and send a target report to management | Sales Target Report in Excel ($6.99) |
| Work in Google Sheets and review sales monthly | Monthly Sales Tracker and Report in Google Sheets ($6.99) |
| Want one page per region, rep, product and month in Excel | Sales Target Dashboard in Excel ($17.99) |
| Use Power BI and want previous-year comparison | Sales Target Dashboard in Power BI ($17.99) |
| Record sales every day at a shop or small team | Daily Sales Report Form in Google Sheets ($6.99) |
| Sell digital products and care about net revenue | Digital Product Sales Tracker in Google Sheets ($6.99) |
| Sell print-on-demand goods and care about profit per design | Print-on-Demand Sales Tracker in Google Sheets ($6.99) |
Bundle versus single maths: buying the two top picks (Sales Target Report in Excel and Monthly Sales Tracker and Report in Google Sheets) costs $13.98 in total. Adding both $17.99 dashboards brings the total to $49.96. Most teams need only one of them, since they cover the same ground in different formats. If you also track pipeline stages, our lead tracker to pipeline dashboard stack and the guide to sales pipeline metrics are the next stop.
When is a paid sales report template NOT the right answer?
A free template is the better choice in several situations. If you log fewer than 20 sales a month and report to nobody, a free list with a SUM total is enough, and spending $6.99 adds nothing.
If your sales live in a CRM with live pipelines, forecasts and email tracking, you need software, not a spreadsheet. Salesforce and HubSpot do that work, and a template will not replace them. Our comparison of Salesforce alternatives in Excel and Sheets shows what a spreadsheet can and cannot cover.
If many people must enter data at once with strict access control, or you need automatic imports from a store or ad platform, a spreadsheet will struggle. Several of these templates use manual entry. The Print-on-Demand Sales Tracker, for example, has no API connection, so you type or paste each order.
If you already have a good pivot table report you trust, keep it. Buy a template when building the report is the time sink, not when it is working.
Frequently asked questions
Is there a free sales report template for Excel?
Yes. Microsoft Create and Vertex42 both offer free Excel sales templates, usually a sales log with totals and a simple chart. They are good for small, informal reporting. If you need target vs actual, variance % or filters, you will either build those yourself or move to a paid template.
What should a sales report include?
A useful sales report shows total sales, target, achievement %, variance %, and breakdowns by product, region and rep, plus a monthly trend. These let a manager see whether the team is on track and where the gaps are. Anything less is a sales list rather than a report.
How do you calculate sales variance percentage?
Variance % equals actual sales minus target, divided by target, multiplied by 100. If the target is $50,000 and actual sales are $43,500, variance is -13%. A negative number means a shortfall, and a positive number means you beat the target.
Which format is better for a sales report: Excel or Google Sheets?
Excel suits offline work, slicers and files that go to management. Google Sheets suits live sharing, browser access and mobile use by field reps. Pick the one your team already opens every day. NGT sells sales report templates in both formats, so the choice does not limit your options.
Is the Sales Target Report in Excel free?
No. The Sales Target Report in Excel costs $6.99, and it is one of 8 paid NGT templates in this post. It includes 5 KPI cards, slicers for region, product and date, 5 charts and a data sheet. It runs in Excel with no add-ins needed.
Can I make a sales report in Google Sheets for free?
Yes. The Google Sheets template gallery has basic business templates you can copy, and you can build your own with SUMIFS and charts. The Monthly Sales Tracker and Report in Google Sheets ($6.99) saves that build time with a report, targets sheet and charts already set up.
Do these templates need macros or add-ins?
The Excel templates in this post run natively in Excel and need no add-ins, according to their product descriptions. The Google Sheets templates run in any browser, and the Power BI dashboard connects to your Excel data input. Check each product page for software requirements before buying.
What is the difference between a sales report and a sales dashboard?
A sales report is a structured summary of a period, such as one month, with numbers and a few charts. A dashboard is an interactive view with slicers and multiple pages. The $17.99 Excel and Power BI target dashboards are dashboards, while the $6.99 report is a report.
How much do paid sales report templates cost?
In this post, six templates cost $6.99 each, and the Excel and Power BI Sales Target Dashboards cost $17.99 each. All are one-time purchases rather than monthly subscriptions. The Monthly Sales Tracker and Report in Google Sheets lists a regular price of $14.99, currently reduced to $6.99.
Can I track sales profit, not just revenue?
Yes, with the right template. The Print-on-Demand Sales Tracker in Google Sheets ($6.99) calculates net profit after base cost and platform fee, and the Digital Product Sales Tracker ($6.99) calculates net revenue after refunds and fees. A plain free sales list usually tracks revenue only.
Get more sales report templates
Start with the Sales Target Report in Excel ($6.99) or the Monthly Sales Tracker and Report in Google Sheets ($6.99, regular $14.99). For a multi-page view, choose the Sales Target Dashboard in Excel or the Sales Target Dashboard in Power BI ($17.99 each). More walkthroughs are on the NextGenTemplates YouTube channel.
Related reading: sales BI dashboards for tracking revenue and e-commerce dashboards for online sales.