
Short answer: a lead tracker Excel workflow works best when it is not treated as one spreadsheet. For a small or mid-sized U.S. business, the real sales problem is usually sequence: leads arrive from forms, referrals, ads, events, and outbound lists, then they need qualification, follow-up, opportunity tracking, and forecast review before the month ends.
That is where a workflow-sequenced template stack can beat a scattered file folder. As of June 2026, Salesforce lists Starter Suite at $25 per user per month and Pro Suite at $100 per user per month. Those tools can be the right choice for many teams, but an SMB that mainly needs lead capture, qualification, pipeline review, and forecast discipline may not need another recurring SaaS layer on day one. This guide covers six specific NextGenTemplates products, arranged as a four-stage sales stack: lead capture, lead qualification, opportunity management, and pipeline forecast review.
Why This Matters for SMB Sales Teams
Lead management breaks down when the intake system, follow-up system, and reporting system are separate. Before choosing a sales pipeline template, look at the operating pressure behind the decision.
- Small businesses dominate the U.S. market: The U.S. Small Business Administration Office of Advocacy reports that small businesses make up 99.9% of American businesses. That means many sales teams are managing pipeline with lean headcount, not enterprise RevOps departments.
- CRM cost scales by seat: Salesforce lists Starter Suite at $25/user/month, Pro Suite at $100/user/month, Enterprise at $175/user/month, and Unlimited at $350/user/month. A five-user Pro Suite team is looking at $6,000 per year before implementation time.
- Non-selling work is still the drag: Salesforce’s 2026 State of Sales coverage says the average seller spends only 40% of time selling, with the remaining time going to non-selling work such as admin, meetings, and data tasks.
- Tool overload affects sales adoption: Salesforce’s 2026 State of Sales report also highlights tool overload, with 42% of sales reps saying they are overwhelmed by too many tools.
- Templates give SMBs an owned reporting layer: The six products in this roundup currently range from $1.99 to $14.99 each. They do not replace every CRM feature, but they can create a practical sales operating system for capture, qualification, nurturing, KPI review, and forecast meetings.
Compare the Lead Tracker Excel Stack
| Template | Format | Best For | Price |
|---|---|---|---|
| Sales Lead Submission Tracker in Excel | Excel VBA tool | Lead capture, user-controlled lead entry, and sales intake dashboards | $6.99 |
| Lead Generation Checklist in Excel | Excel checklist | Prospecting discipline, qualification steps, and follow-up readiness | $1.99 |
| Lead Nurturing KPI Dashboard in Excel | Excel KPI dashboard | Follow-up performance, engagement, conversion, and nurturing ROI | $14.99 |
| CRM Development KPI Dashboard in Excel | Excel KPI dashboard | CRM process improvement, MTD/YTD KPI review, and target tracking | $14.99 |
| CRM KPI Scorecard in Excel | Excel scorecard | Executive CRM health review, target status, and KPI accountability | $14.99 |
| Pipeline Infrastructure KPI Dashboard in Excel | Excel KPI dashboard | Industry-specific pipeline project visibility, operational KPIs, and forecast control | $14.99 |
The Four-Stage Sales Stack
The title calls this a four-template stack because the workflow has four jobs: capture, qualify, manage opportunities, and forecast. The post includes six products because two of the stages have supporting templates that make the workflow stronger for different SMB use cases.
1. Sales Lead Submission Tracker in Excel
The Sales Lead Submission Tracker in Excel is the capture layer of the stack. Use it when leads are entering the business from several places and the sales manager needs a controlled intake system before anything becomes an opportunity. The product is an Excel VBA tool, not just a flat list, so it is better suited for SMBs that want user access, forms, dropdown controls, and dashboard views in one file.
Screenshot notes: the product images show a login screen, main navigation, data-entry workflow, dashboard charts, support sheets, manage-list controls, user management, and settings. The dashboard can break leads down by priority, status, industry, country, source, and product or service, which is exactly the kind of first-stage visibility a lead management process needs.
Specific use cases: capture inbound web leads, assign leads to sales reps, standardize lead source values, monitor high-priority open leads, and give managers a quick view of submission volume. At $6.99, it is the best first purchase if your current lead tracker Excel file is a shared workbook with inconsistent columns. View the Sales Lead Submission Tracker in Excel.
2. Lead Generation Checklist in Excel

The Lead Generation Checklist in Excel sits before and beside the tracker. It helps the team define what a qualified lead should look like before a rep spends time chasing it. For SMBs, this is often the missing piece. Leads get entered, but nobody agrees on whether the lead has budget, authority, need, timing, source quality, or a next action.
Screenshot notes: the featured image introduces the checklist as a simple Excel lead-generation control sheet, and the product page describes fields for lead tracking, follow-up reminders, lead qualification criteria, lead source tracking, notes, communication history, and customizable layout. This is not a heavy dashboard. It is a sales process checklist that keeps prospecting steps visible.
Specific use cases: qualify outbound prospect lists, prepare SDR handoffs, document follow-up steps, check lead source quality, and keep marketing and sales aligned on what counts as a good lead. At $1.99, it is the lowest-cost tool in the stack and works well as a companion to the Sales Lead Submission Tracker. Get the Lead Generation Checklist in Excel.
3. Lead Nurturing KPI Dashboard in Excel
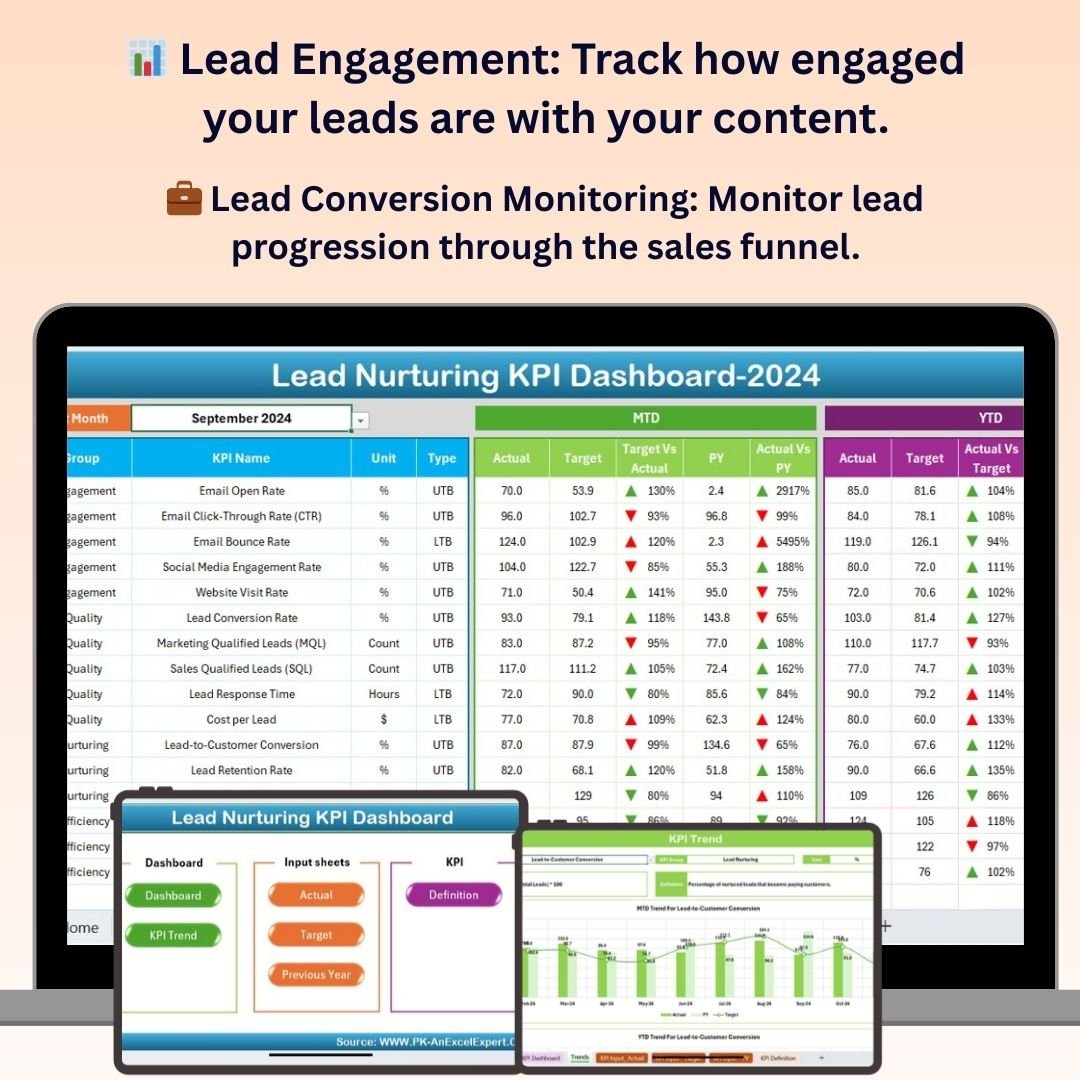
The Lead Nurturing KPI Dashboard in Excel is for the middle of the funnel, where many SMB opportunities quietly disappear. Once a lead is captured and qualified, the question becomes whether your team is following up, engaging, converting, and learning which sources produce better prospects. This dashboard gives those activities a KPI structure.
Screenshot notes: the product page describes lead engagement tracking, lead conversion monitoring, follow-up scheduling, task management, lead source and channel analysis, conversion rate analysis, ROI analysis, and customizable KPIs. The images show a dashboard-style workbook focused on moving leads through a funnel rather than simply storing contact records.
Specific use cases: monitor email or outreach engagement, measure lead-to-opportunity conversion, review follow-up completion, compare lead sources, and identify nurturing bottlenecks. At $14.99, this is the right sales pipeline template companion when your biggest problem is not lead volume but stalled follow-up. Explore the Lead Nurturing KPI Dashboard in Excel.
4. CRM Development KPI Dashboard in Excel
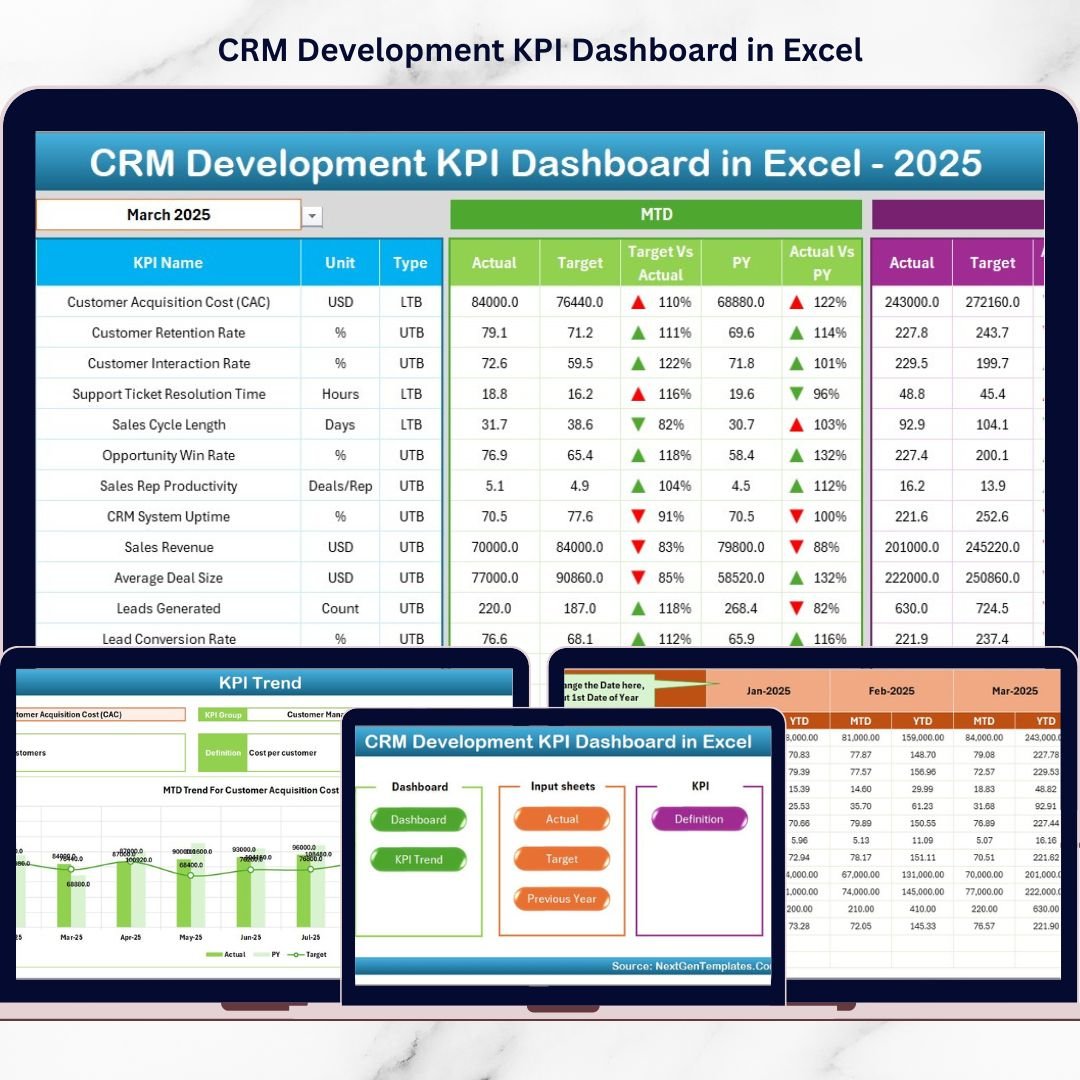
The CRM Development KPI Dashboard in Excel supports the opportunity-management stage. It is especially useful when an SMB is improving its CRM process, cleaning up fields, documenting KPI definitions, or trying to create repeatable monthly reporting from CRM exports. In other words, this is the template for the sales operations layer, not the first lead-entry layer.
Screenshot notes: the product screenshots show a seven-sheet workbook: Home, Dashboard, KPI Trend, Actual Numbers Input, Target, Previous Year, and KPI Definition. The dashboard includes a month selector, MTD and YTD tracking, target vs actual comparison, previous-year analysis, visual arrows, and trend charts. The KPI Definition sheet is valuable because it forces the team to document metric names, units, formulas, and types.
Specific use cases: review CRM adoption KPIs, track lead conversion improvement, document KPI formulas, compare actual CRM performance against target, and prepare monthly sales operations reports. At $14.99, this is a strong option if your lead management process needs structure around targets and KPI ownership. View the CRM Development KPI Dashboard in Excel.
5. CRM KPI Scorecard in Excel
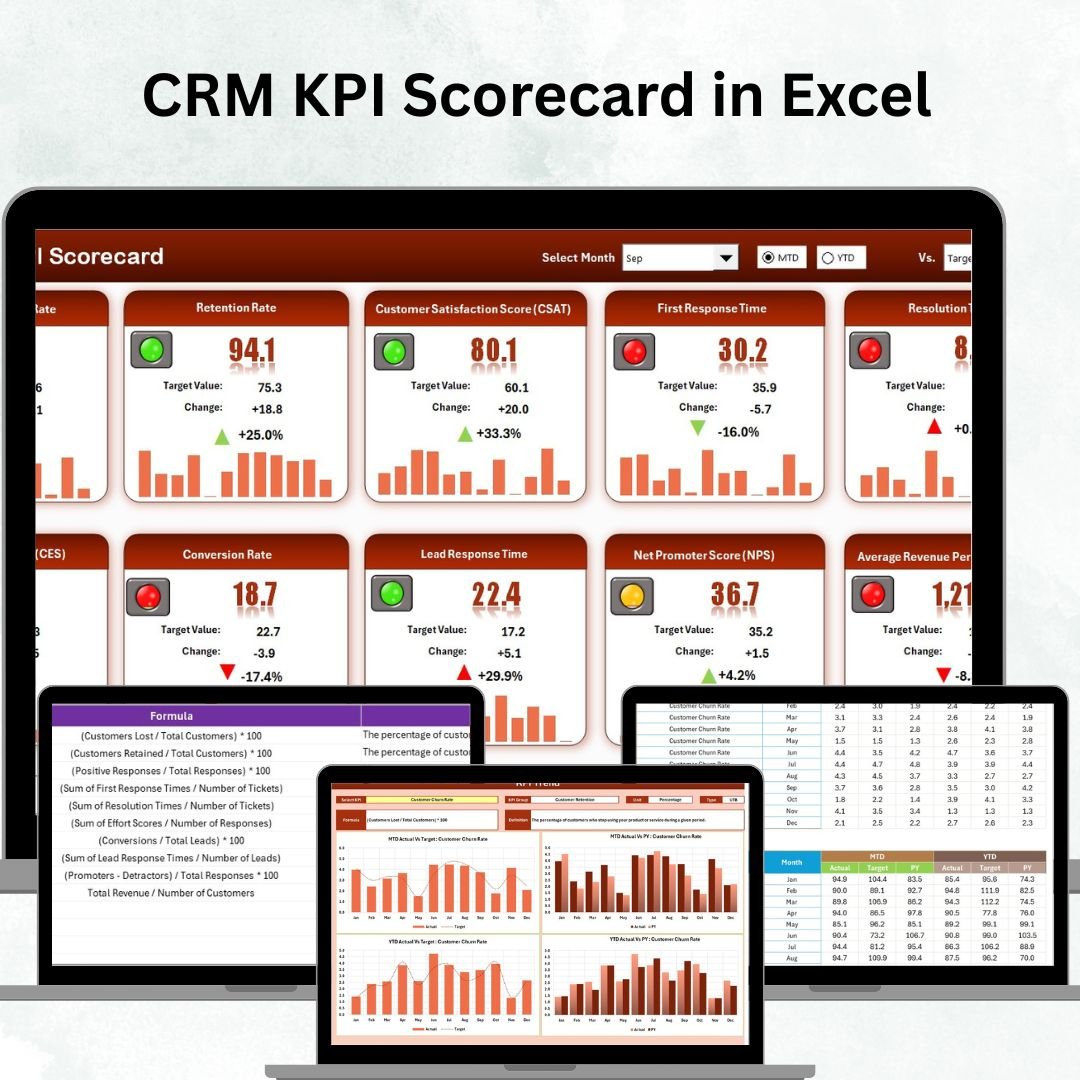
The CRM KPI Scorecard in Excel is the executive review layer of the stack. A dashboard helps teams explore; a scorecard helps leaders decide what is on track, what is under target, and what needs action before the next sales meeting. For SMB owners, this can be easier to maintain than a full reporting suite because it focuses on actual vs target performance.
Screenshot notes: the product screenshots show four worksheets: Scorecard, KPI Trend, Input Data, and KPI Definition. The scorecard tracks MTD and YTD results, compares actuals against targets, uses color-coded indicators, and lets users review KPI movement over time. It is compact enough for a weekly sales meeting and structured enough for monthly management reporting.
Specific use cases: track lead conversion rate, monitor customer retention, compare sales and marketing KPIs, flag underperforming CRM metrics, and keep leadership aligned on the same definitions. At $14.99, choose this when the team already has lead data but needs accountability around performance. Download the CRM KPI Scorecard in Excel.
6. Pipeline Infrastructure KPI Dashboard in Excel

The Pipeline Infrastructure KPI Dashboard in Excel is the most industry-specific product in this roundup. It is not a generic sales CRM file. It is built for pipeline infrastructure projects, construction progress, maintenance performance, safety indicators, operational efficiency, and cost performance. That makes it useful for SMBs that sell or manage infrastructure, utility, construction, engineering, or pipeline operations work.
Screenshot notes: the product page shows a seven-sheet Excel dashboard with Summary, Dashboard, Trend Analysis, Actual Numbers Input, Target, Previous Year Data, and KPI Definition sheets. The dashboard supports month selection, MTD/YTD KPI monitoring, target vs actual comparison, previous-year benchmarking, trend charts, and navigation controls.
Specific use cases: track active pipeline projects, monitor operational targets after an opportunity becomes a delivery project, compare monthly performance against goals, review safety or maintenance KPIs, and prepare client-facing performance summaries. At $14.99, it is the right add-on when your sales pipeline is tied to real infrastructure delivery and forecasting needs operational context. View the Pipeline Infrastructure KPI Dashboard in Excel.
How to Choose Between These Templates
Choose the first template based on the weakest point in your sales workflow. You do not need all six on day one. Use the decision framework below to build a practical lead tracker Excel system in order.
- If leads are getting lost: start with the Sales Lead Submission Tracker in Excel. It gives the team a controlled intake layer with forms, lists, users, and dashboards.
- If prospecting is inconsistent: add the Lead Generation Checklist in Excel. It helps define the qualification steps before reps spend time on low-fit prospects.
- If follow-ups are late or unclear: use the Lead Nurturing KPI Dashboard in Excel. It makes engagement, conversion, source quality, and follow-up performance measurable.
- If CRM reporting is immature: use the CRM Development KPI Dashboard in Excel. It brings MTD/YTD reporting, target comparison, and KPI definitions into one workbook.
- If leadership wants a concise health view: use the CRM KPI Scorecard in Excel. It is built for status review, target accountability, and trend discussion.
- If your pipeline includes infrastructure delivery: use the Pipeline Infrastructure KPI Dashboard in Excel. It connects project performance and operational KPIs to the forecast conversation.
For most SMBs, the simplest stack is Capture plus Qualification plus Nurturing plus Scorecard. That means Sales Lead Submission Tracker, Lead Generation Checklist, Lead Nurturing KPI Dashboard, and CRM KPI Scorecard. Add the CRM Development KPI Dashboard when you need a broader CRM reporting system, and add the Pipeline Infrastructure KPI Dashboard when your sales pipeline turns into infrastructure execution work.
Frequently Asked Questions
What is a lead tracker Excel template?
A lead tracker Excel template is a spreadsheet or Excel-based tool used to record leads, sources, status, owners, follow-up dates, qualification notes, and sales outcomes. It helps sales teams manage lead management without starting from a blank workbook.
What is the difference between a lead tracker and a sales pipeline template?
A lead tracker focuses on capturing and organizing potential customers. A sales pipeline template goes further by tracking qualified opportunities, stages, forecast value, close probability, target performance, and movement toward revenue.
Which template should an SMB start with?
If the team is losing leads, start with the Sales Lead Submission Tracker in Excel. If the team has leads but weak follow-up, start with the Lead Nurturing KPI Dashboard in Excel. If leadership needs reporting, start with the CRM KPI Scorecard in Excel.
Can these templates replace a CRM?
These templates can replace basic manual lead tracking and sales reporting for small teams, but they do not replace every CRM feature. They are best used as an affordable lead management and reporting layer, or as a companion to CRM exports.
How do the six templates work together?
The Sales Lead Submission Tracker captures leads, the Lead Generation Checklist helps qualify them, the Lead Nurturing KPI Dashboard measures follow-up, the CRM Development KPI Dashboard improves CRM process reporting, the CRM KPI Scorecard summarizes performance, and the Pipeline Infrastructure KPI Dashboard supports industry-specific forecast review.
What KPIs should a lead management dashboard track?
A useful lead management dashboard should track lead volume, lead source, lead status, priority, owner, follow-up completion, lead-to-opportunity conversion, opportunity value, target vs actual, previous-year comparison, and conversion rate by source.
Is Excel safe for managing sales leads?
Excel can be appropriate for SMB lead management when access is controlled, sensitive data is limited, files are stored securely, and the process is owned by a clear manager. For regulated data or large teams, use proper CRM permissions and security controls.
How often should a sales pipeline template be updated?
Update active lead and pipeline data at least weekly. High-velocity sales teams may update daily, while lower-volume B2B teams may review every week and finalize forecast numbers at month end.
Do I need all six templates?
No. Buy based on the current bottleneck. Many SMBs can start with one capture template and one reporting template. Add nurturing, CRM development, or industry-specific pipeline dashboards only when the workflow requires them.
What is the best template for lead nurturing?
The Lead Nurturing KPI Dashboard in Excel is the best fit for nurturing because it focuses on engagement, follow-up tasks, lead source analysis, conversion rates, and ROI across the middle of the funnel.
Closing CTA
Built by PK – Microsoft Certified Professional with 15+ years of Excel, Google Sheets, and Power BI experience. Founder of NextGenTemplates, reaching 300K+ subscribers across YouTube channels. Every template is hand-built and tested before release.
For step-by-step video tutorials, visit the NextGenTemplates YouTube channel.
Last updated: June 9, 2026.