

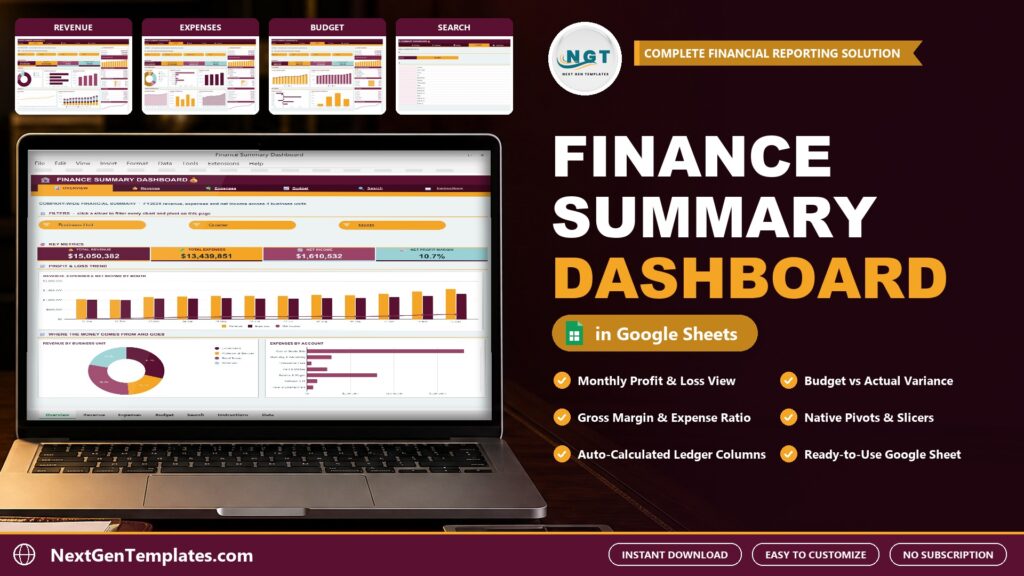
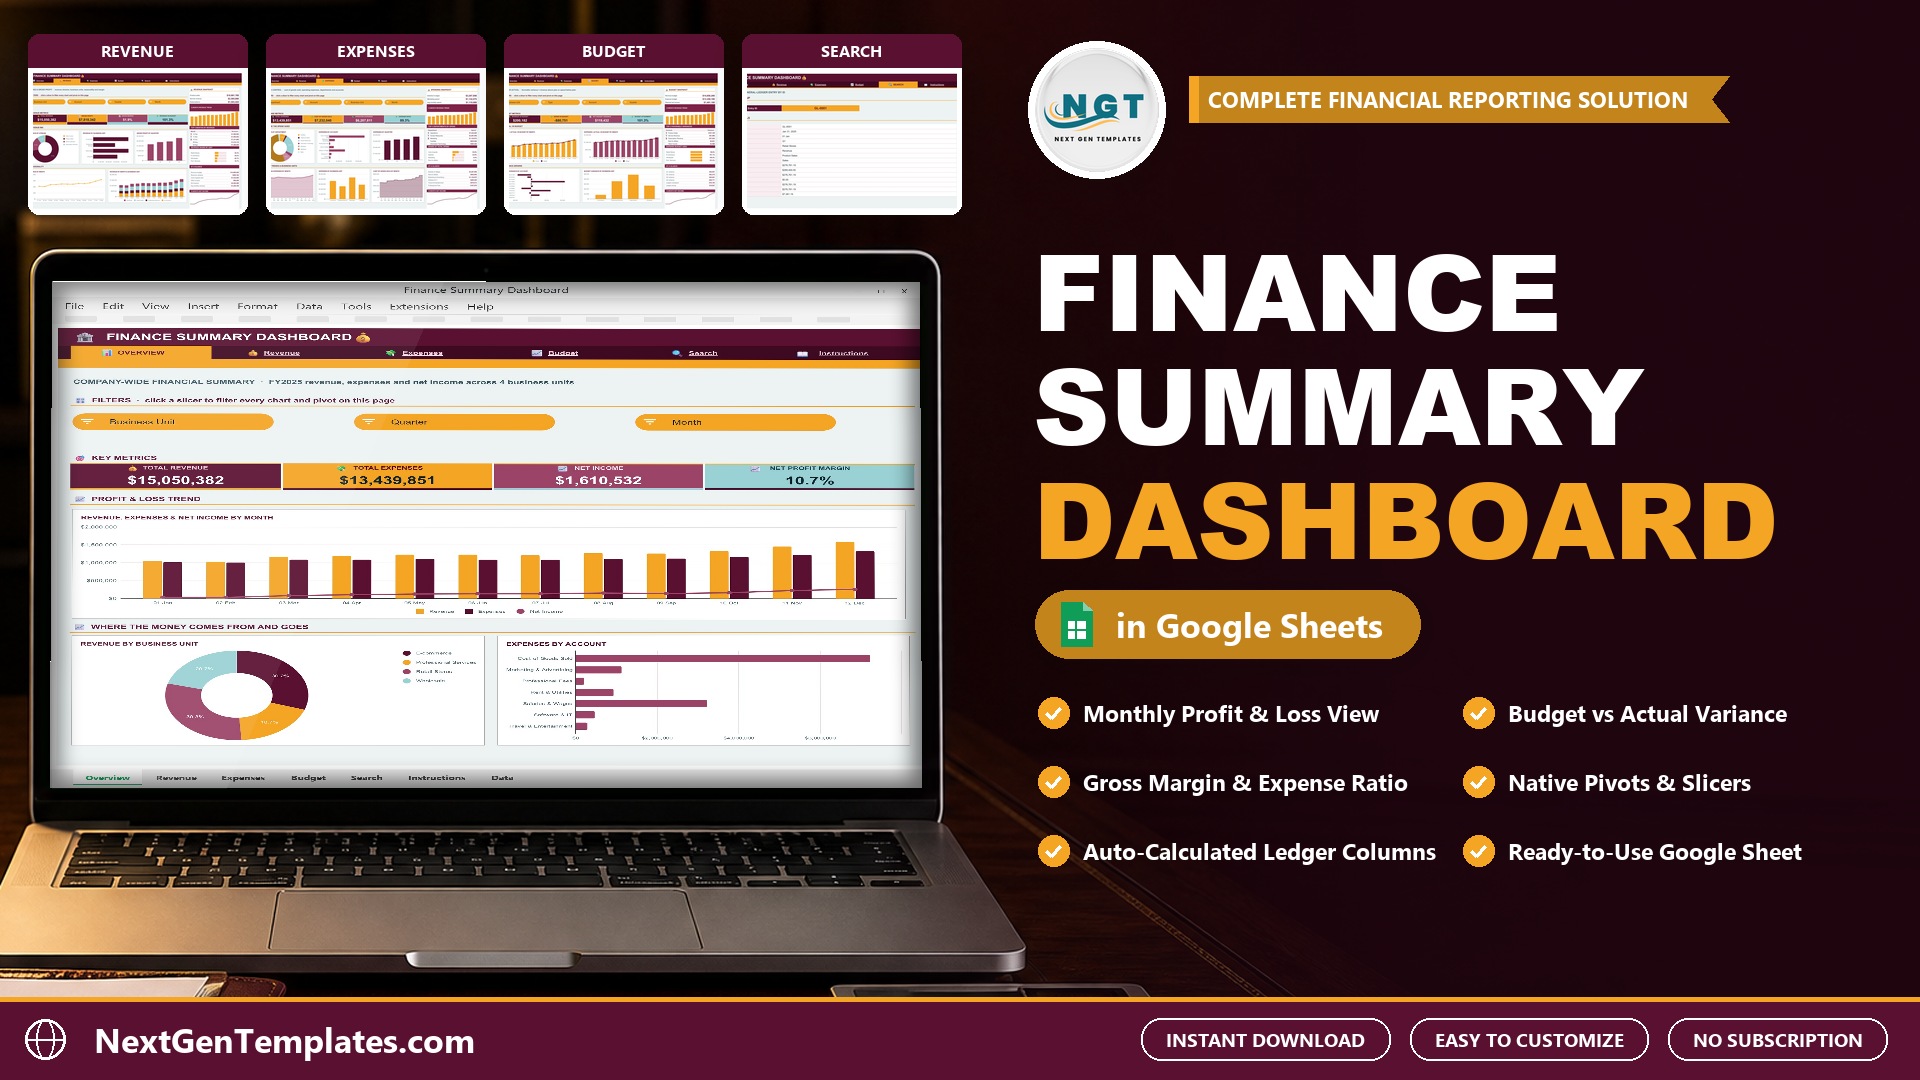
Most finance reports answer one question at a time. The Finance Summary Dashboard in Google Sheets answers the main ones together. It puts total revenue, total expenses, net income and net profit margin on one screen, then breaks them down by business unit, account, department and month, with a budget vs actual view of every line.
🌍 Join 10,000+ customers in 180+ countries using NextGenTemplates to replace paid SaaS tools with one-time-purchase Excel, Google Sheets, Power BI and HTML templates.
Watch the Finance Summary Dashboard in Google Sheets: Revenue, Expenses and Budget walkthrough
 Launch offer
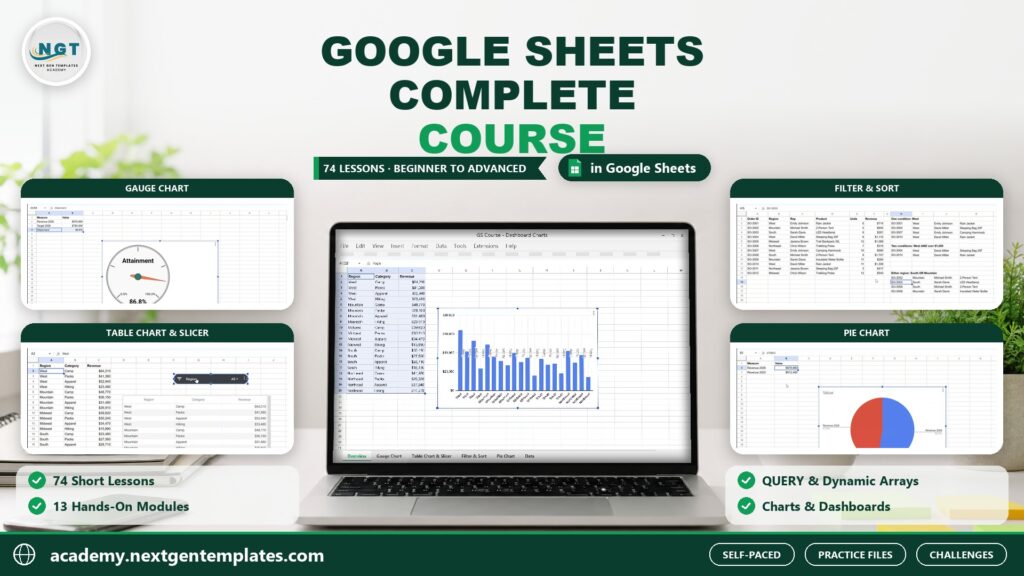
Formulas, lookups, QUERY, dynamic arrays, pivot tables, charts, live data and Apps Script, ending with an interactive sales dashboard. 74 lessons by PK with a practice file for every lesson.
What the Finance Summary Dashboard does
- Financial summary: revenue, expenses, net income and net profit margin for the year. This finance dashboard keeps all four in view.
- Revenue and expense breakdowns: revenue by stream and business unit, expenses by department and account, by month and quarter.
- Budget vs actual: revenue and expenses against plan by month, with the variance by account and business unit, so this budget vs actual dashboard shows what ran over and what came in under.
- Top 5 lists: expense accounts, months by revenue, departments by spend and favorable variances.
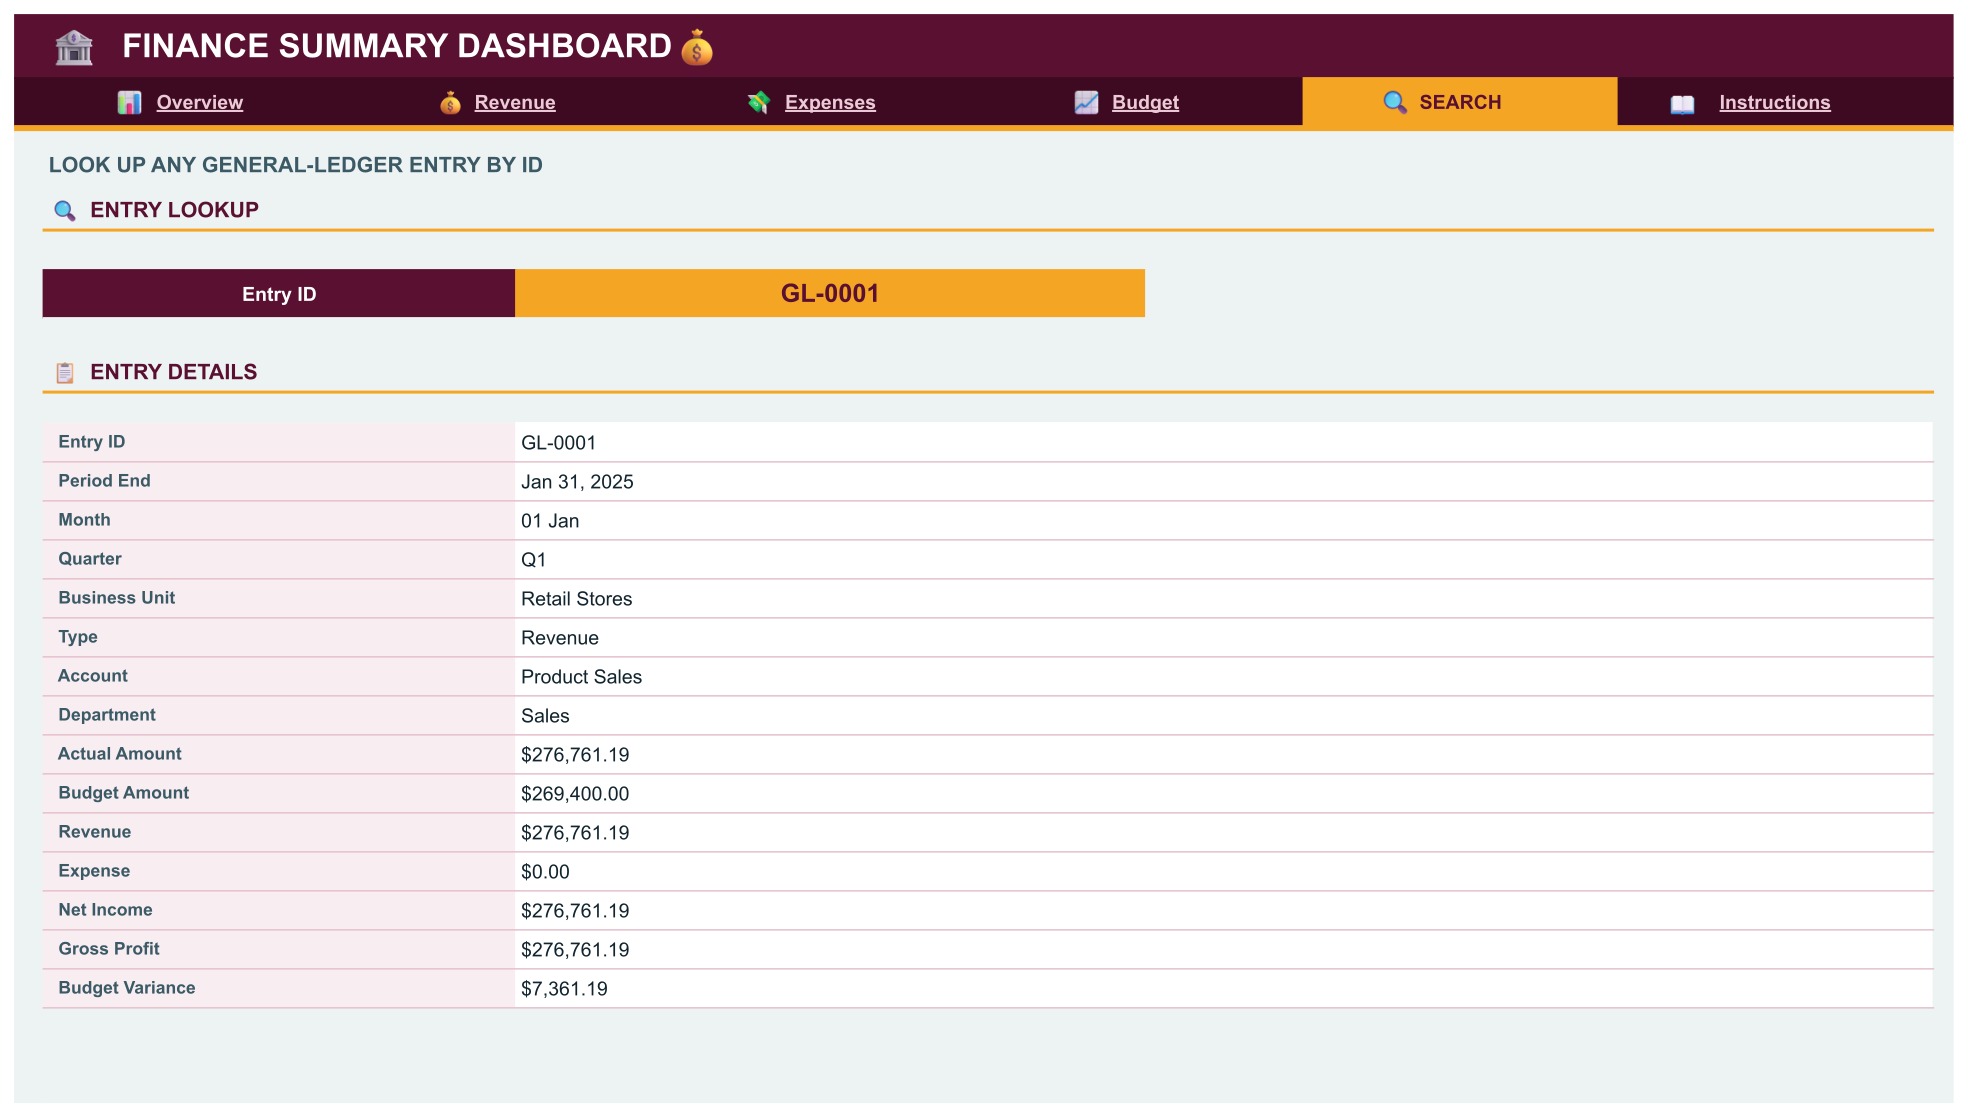
- Search page: type an Entry ID such as GL-0001 and read the full ledger entry.
As a finance dashboard template it is a finance dashboard Google Sheets users can open in any browser. Sample data is included: fictional monthly ledger totals with actual and budget amounts for four business units. The workbook has room for 1,000 rows.
A look at the pages
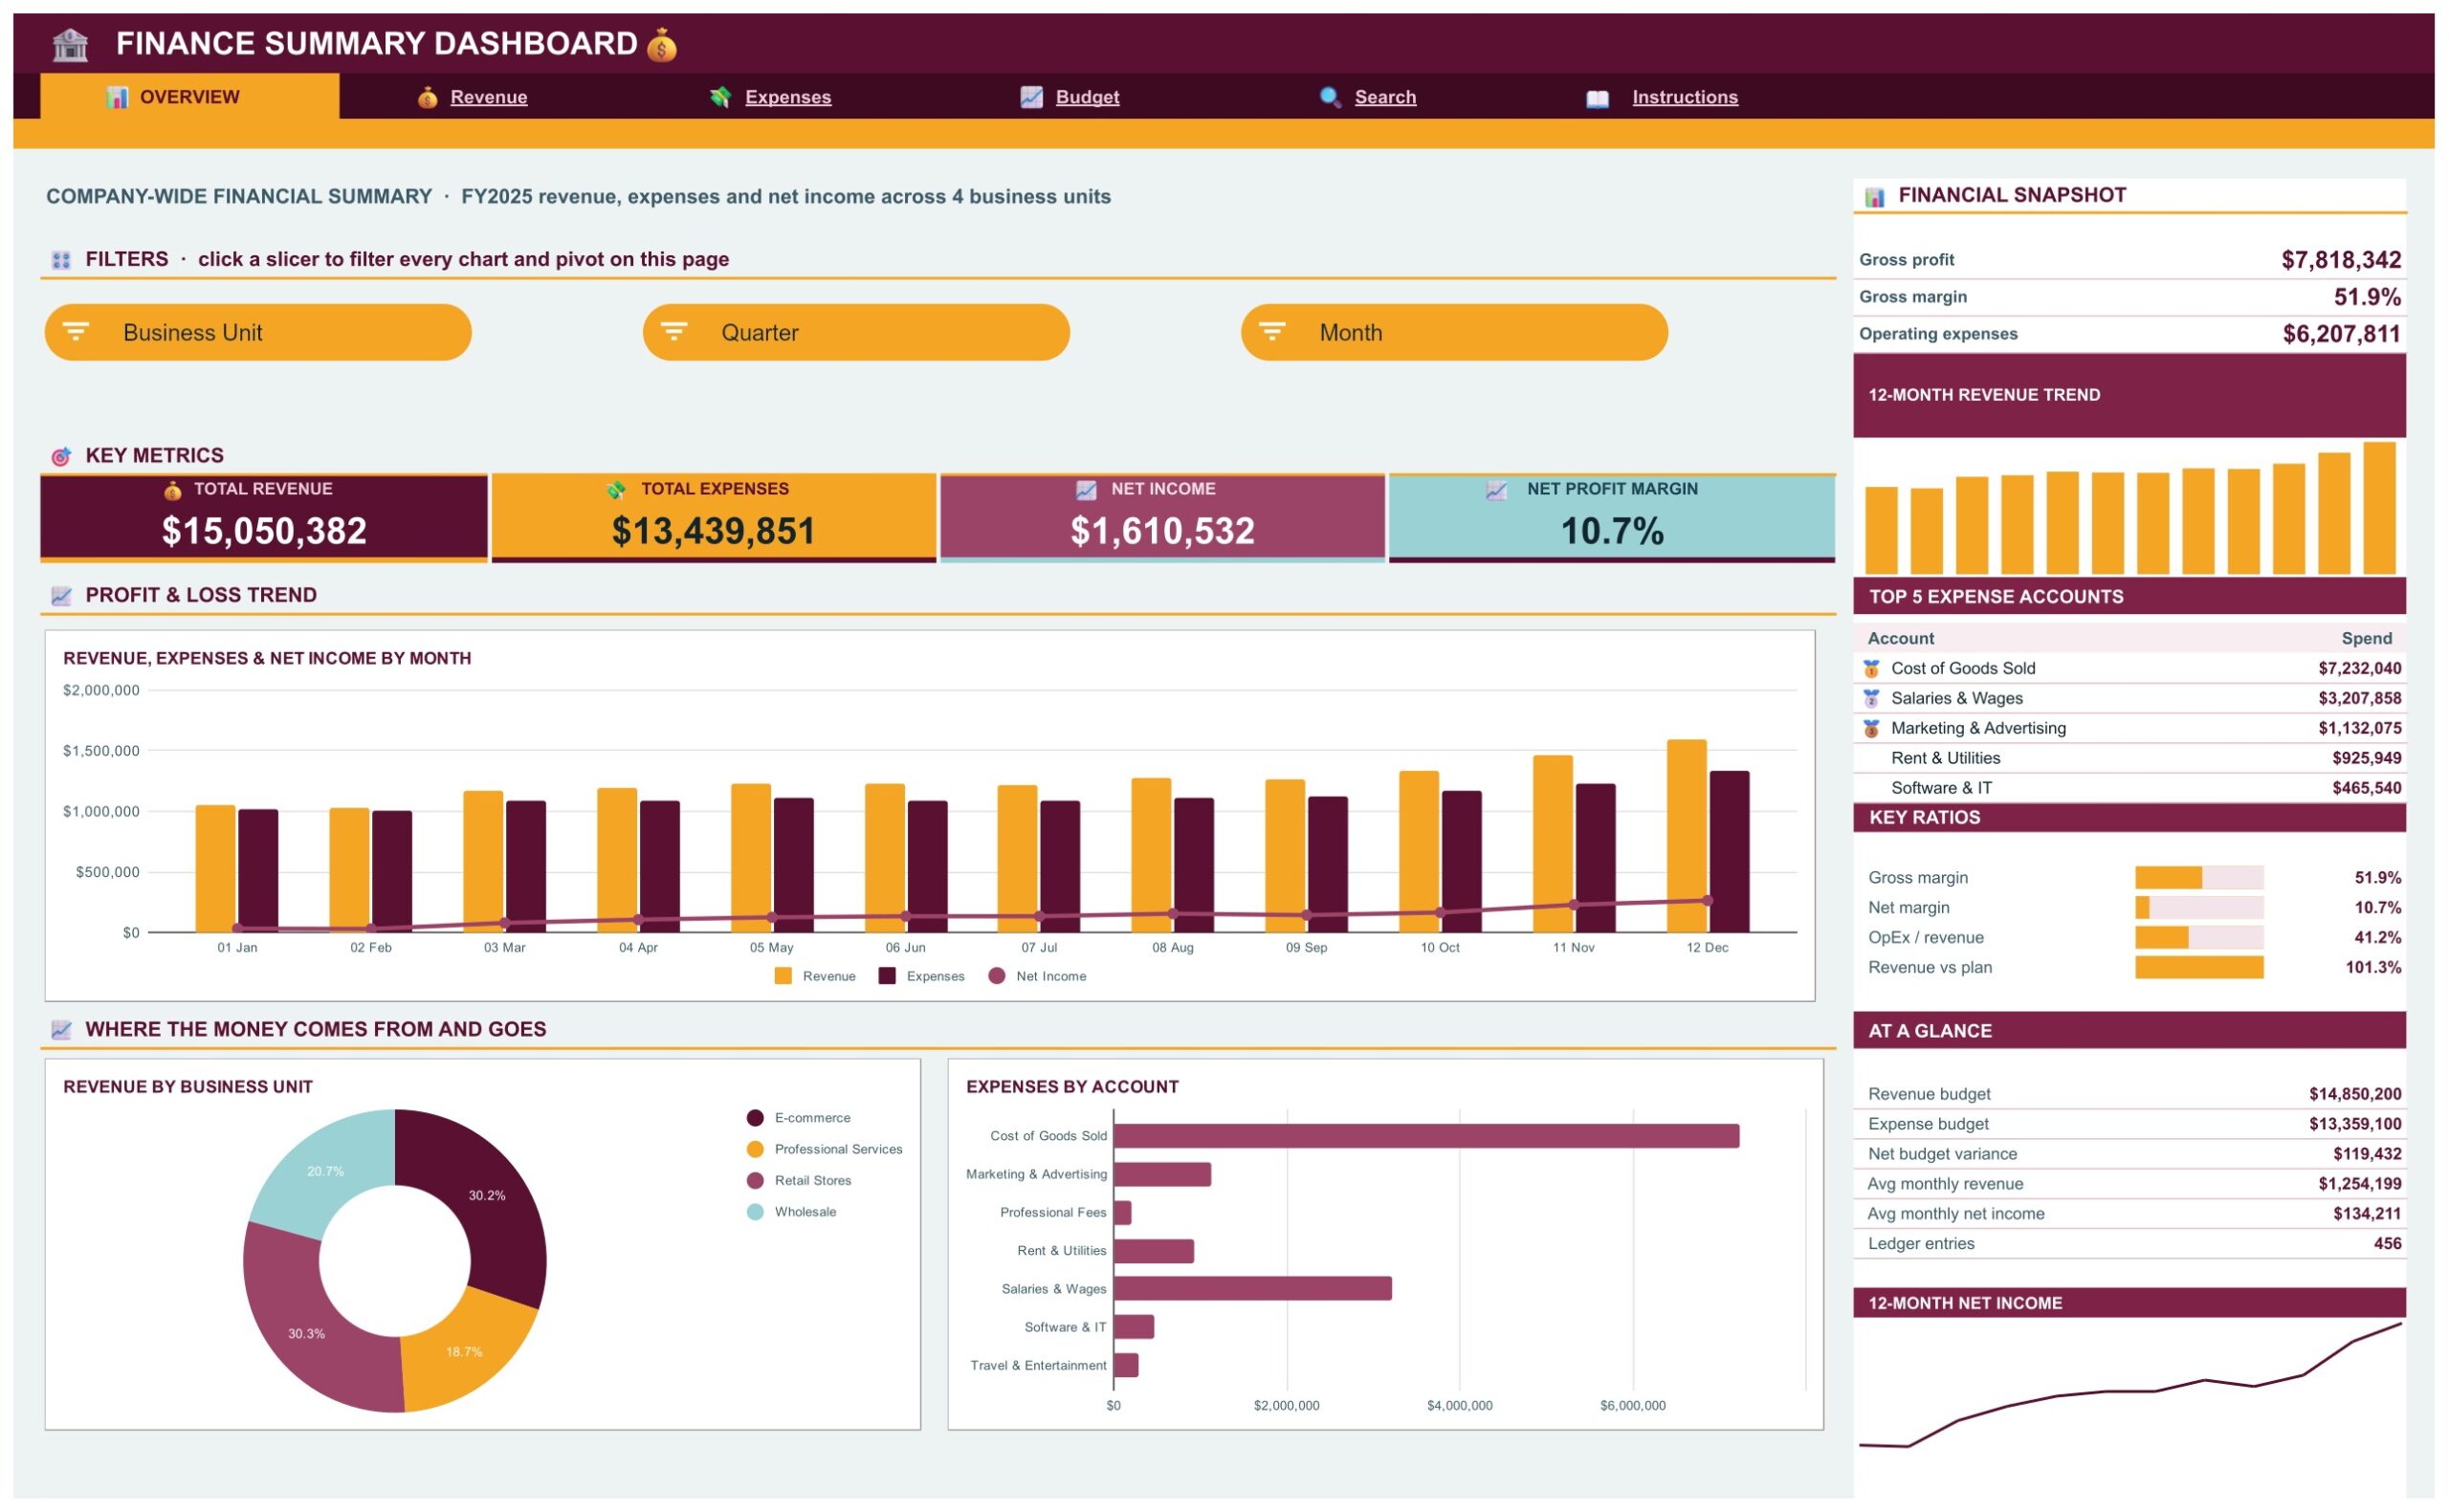
Overview Page
Four KPI cards lead the page: Total Revenue, Total Expenses, Net Income and Net Profit Margin. Below them are Revenue, Expenses and Net Income by Month, Revenue by Business Unit and Expenses by Account. A side panel adds a financial snapshot with gross profit, gross margin and operating expenses, a 12-month revenue trend, the Top 5 expense accounts, key ratios and an At a Glance list. Business Unit, Quarter and Month slicers filter the page.
Revenue Page
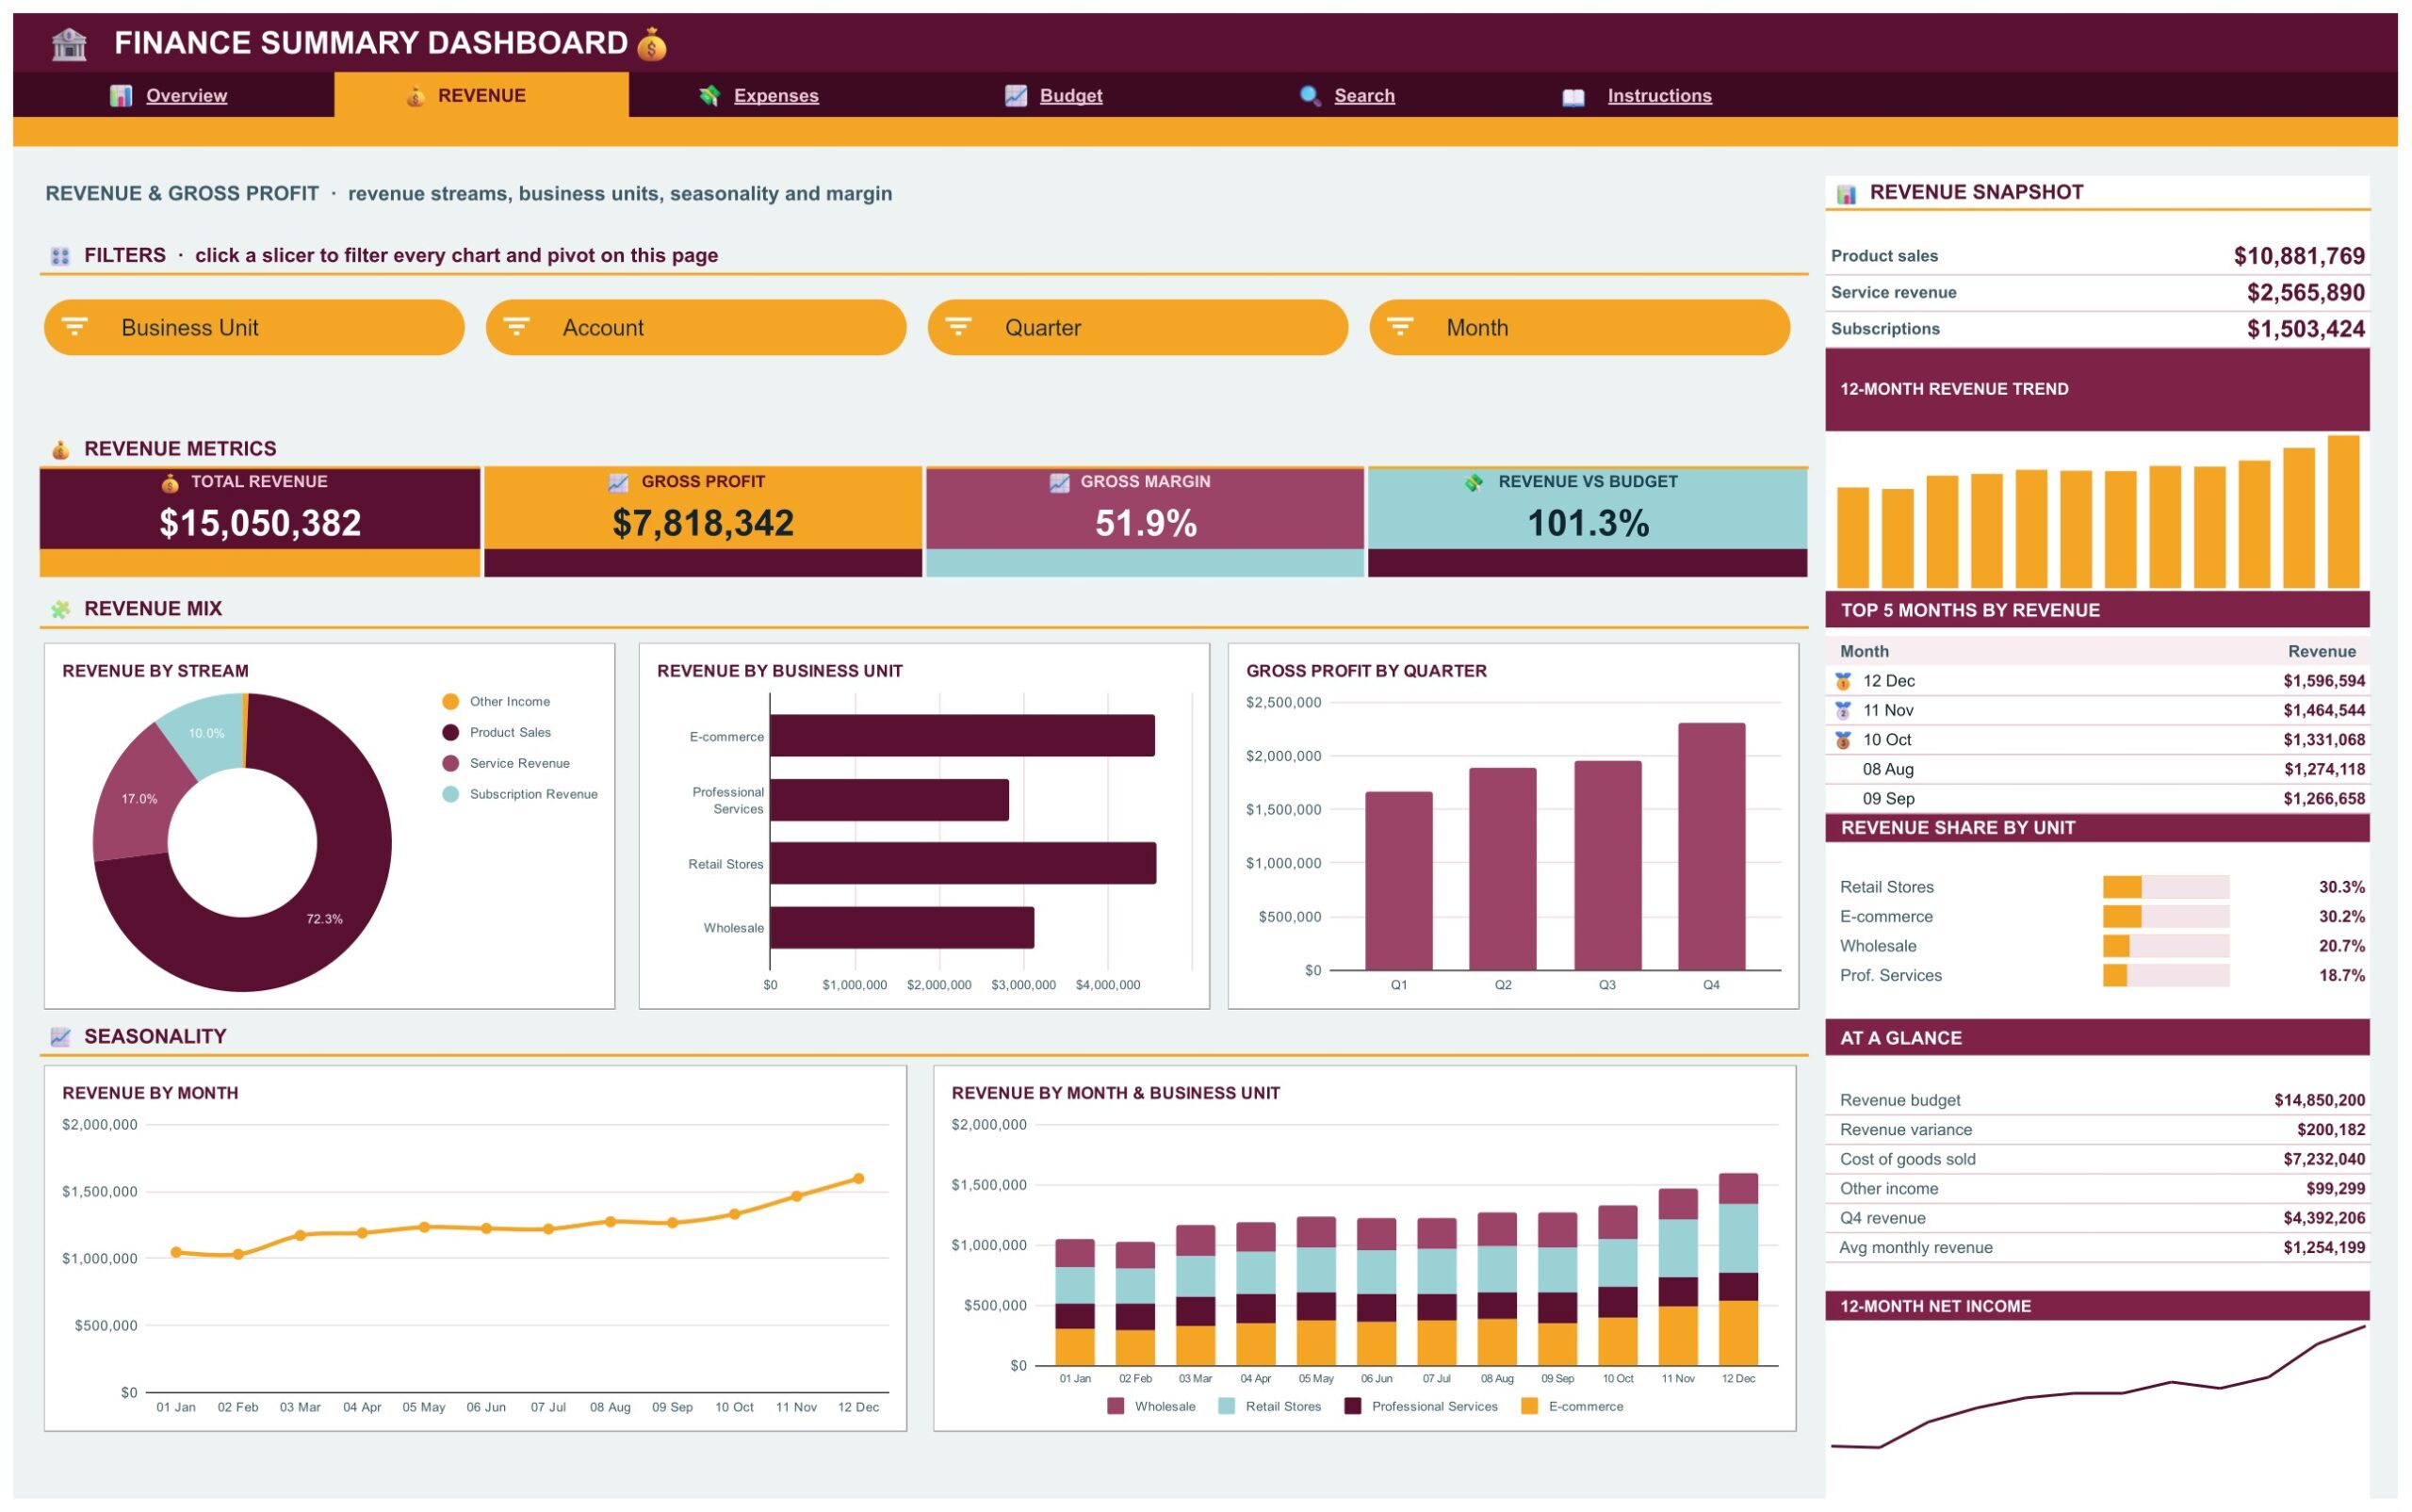
Revenue by Stream, Revenue by Business Unit, Gross Profit by Quarter, Revenue by Month and a stacked monthly chart by business unit show where the sales come from and when. KPI cards show total revenue, gross profit, gross margin and revenue against budget. A side panel lists the Top 5 months by revenue and each unit’s revenue share. Business Unit, Account, Quarter and Month slicers filter the page.
Expenses Page
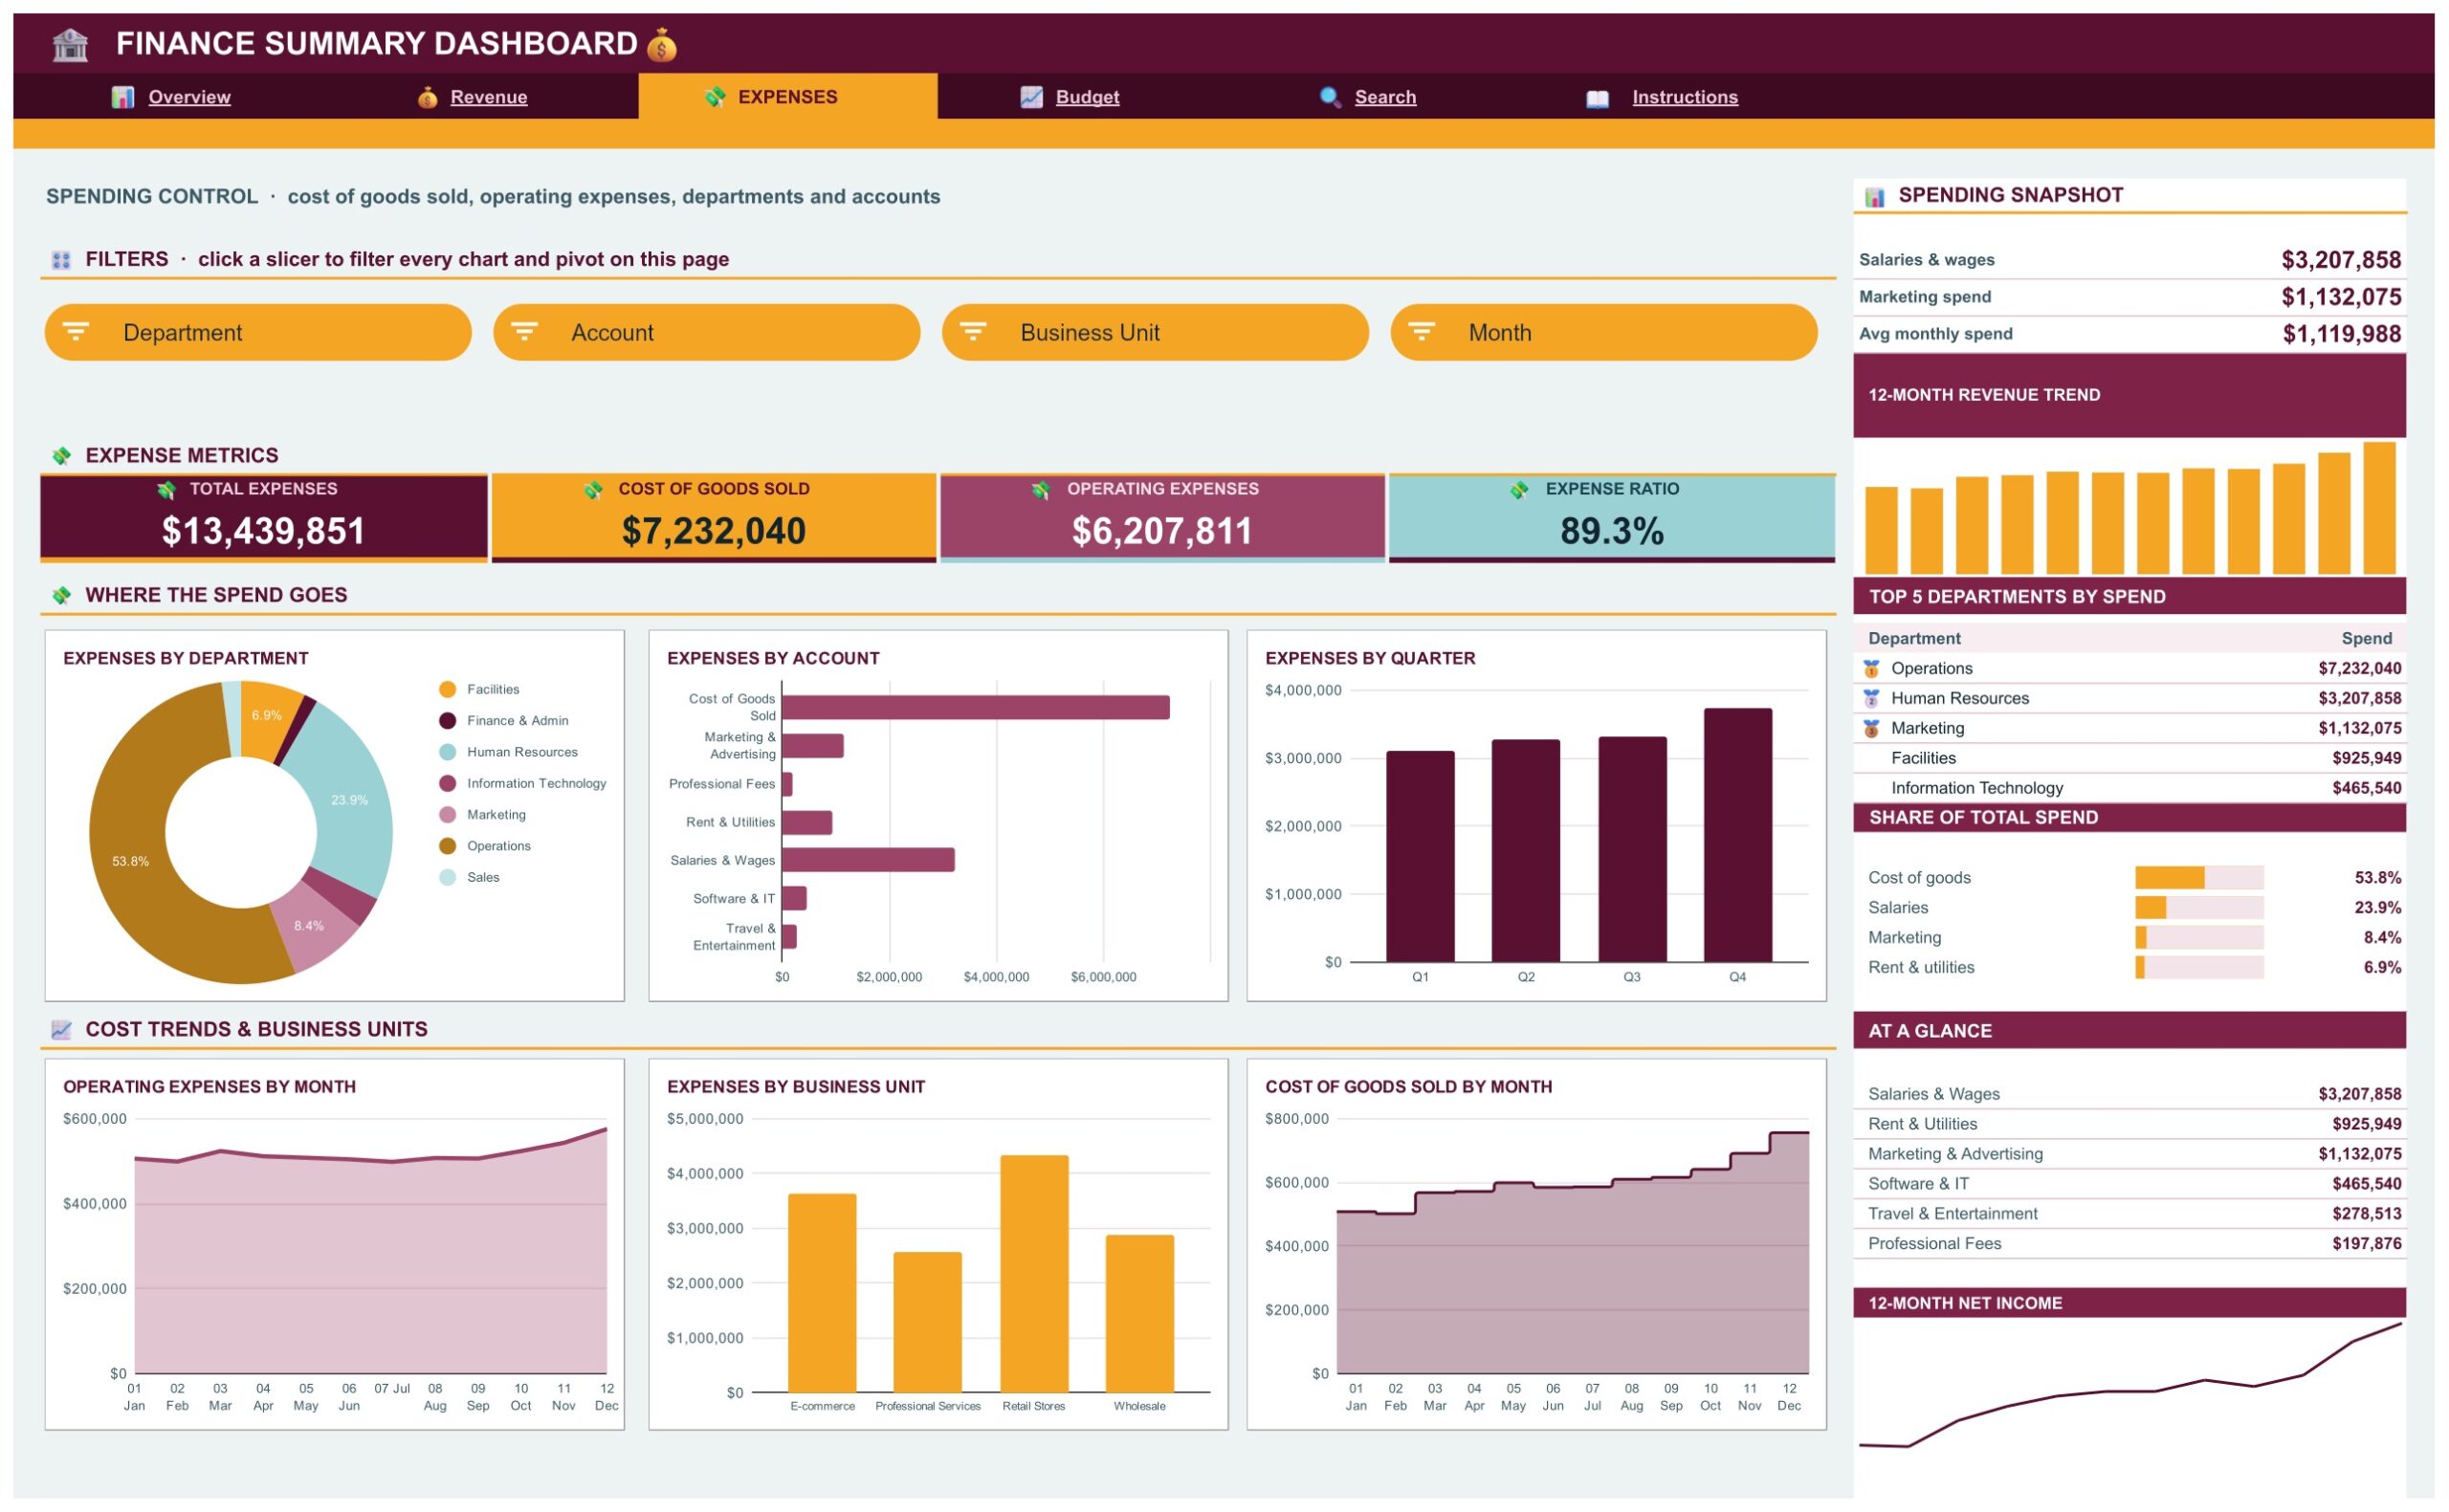
The spending control page: Expenses by Department, Expenses by Account, Expenses by Quarter, Operating Expenses by Month, Expenses by Business Unit and Cost of Goods Sold by Month. KPI cards show total expenses, cost of goods sold, operating expenses and the expense ratio. A side panel lists the Top 5 departments by spend. Department, Account, Business Unit and Month slicers filter the page.
Budget Page
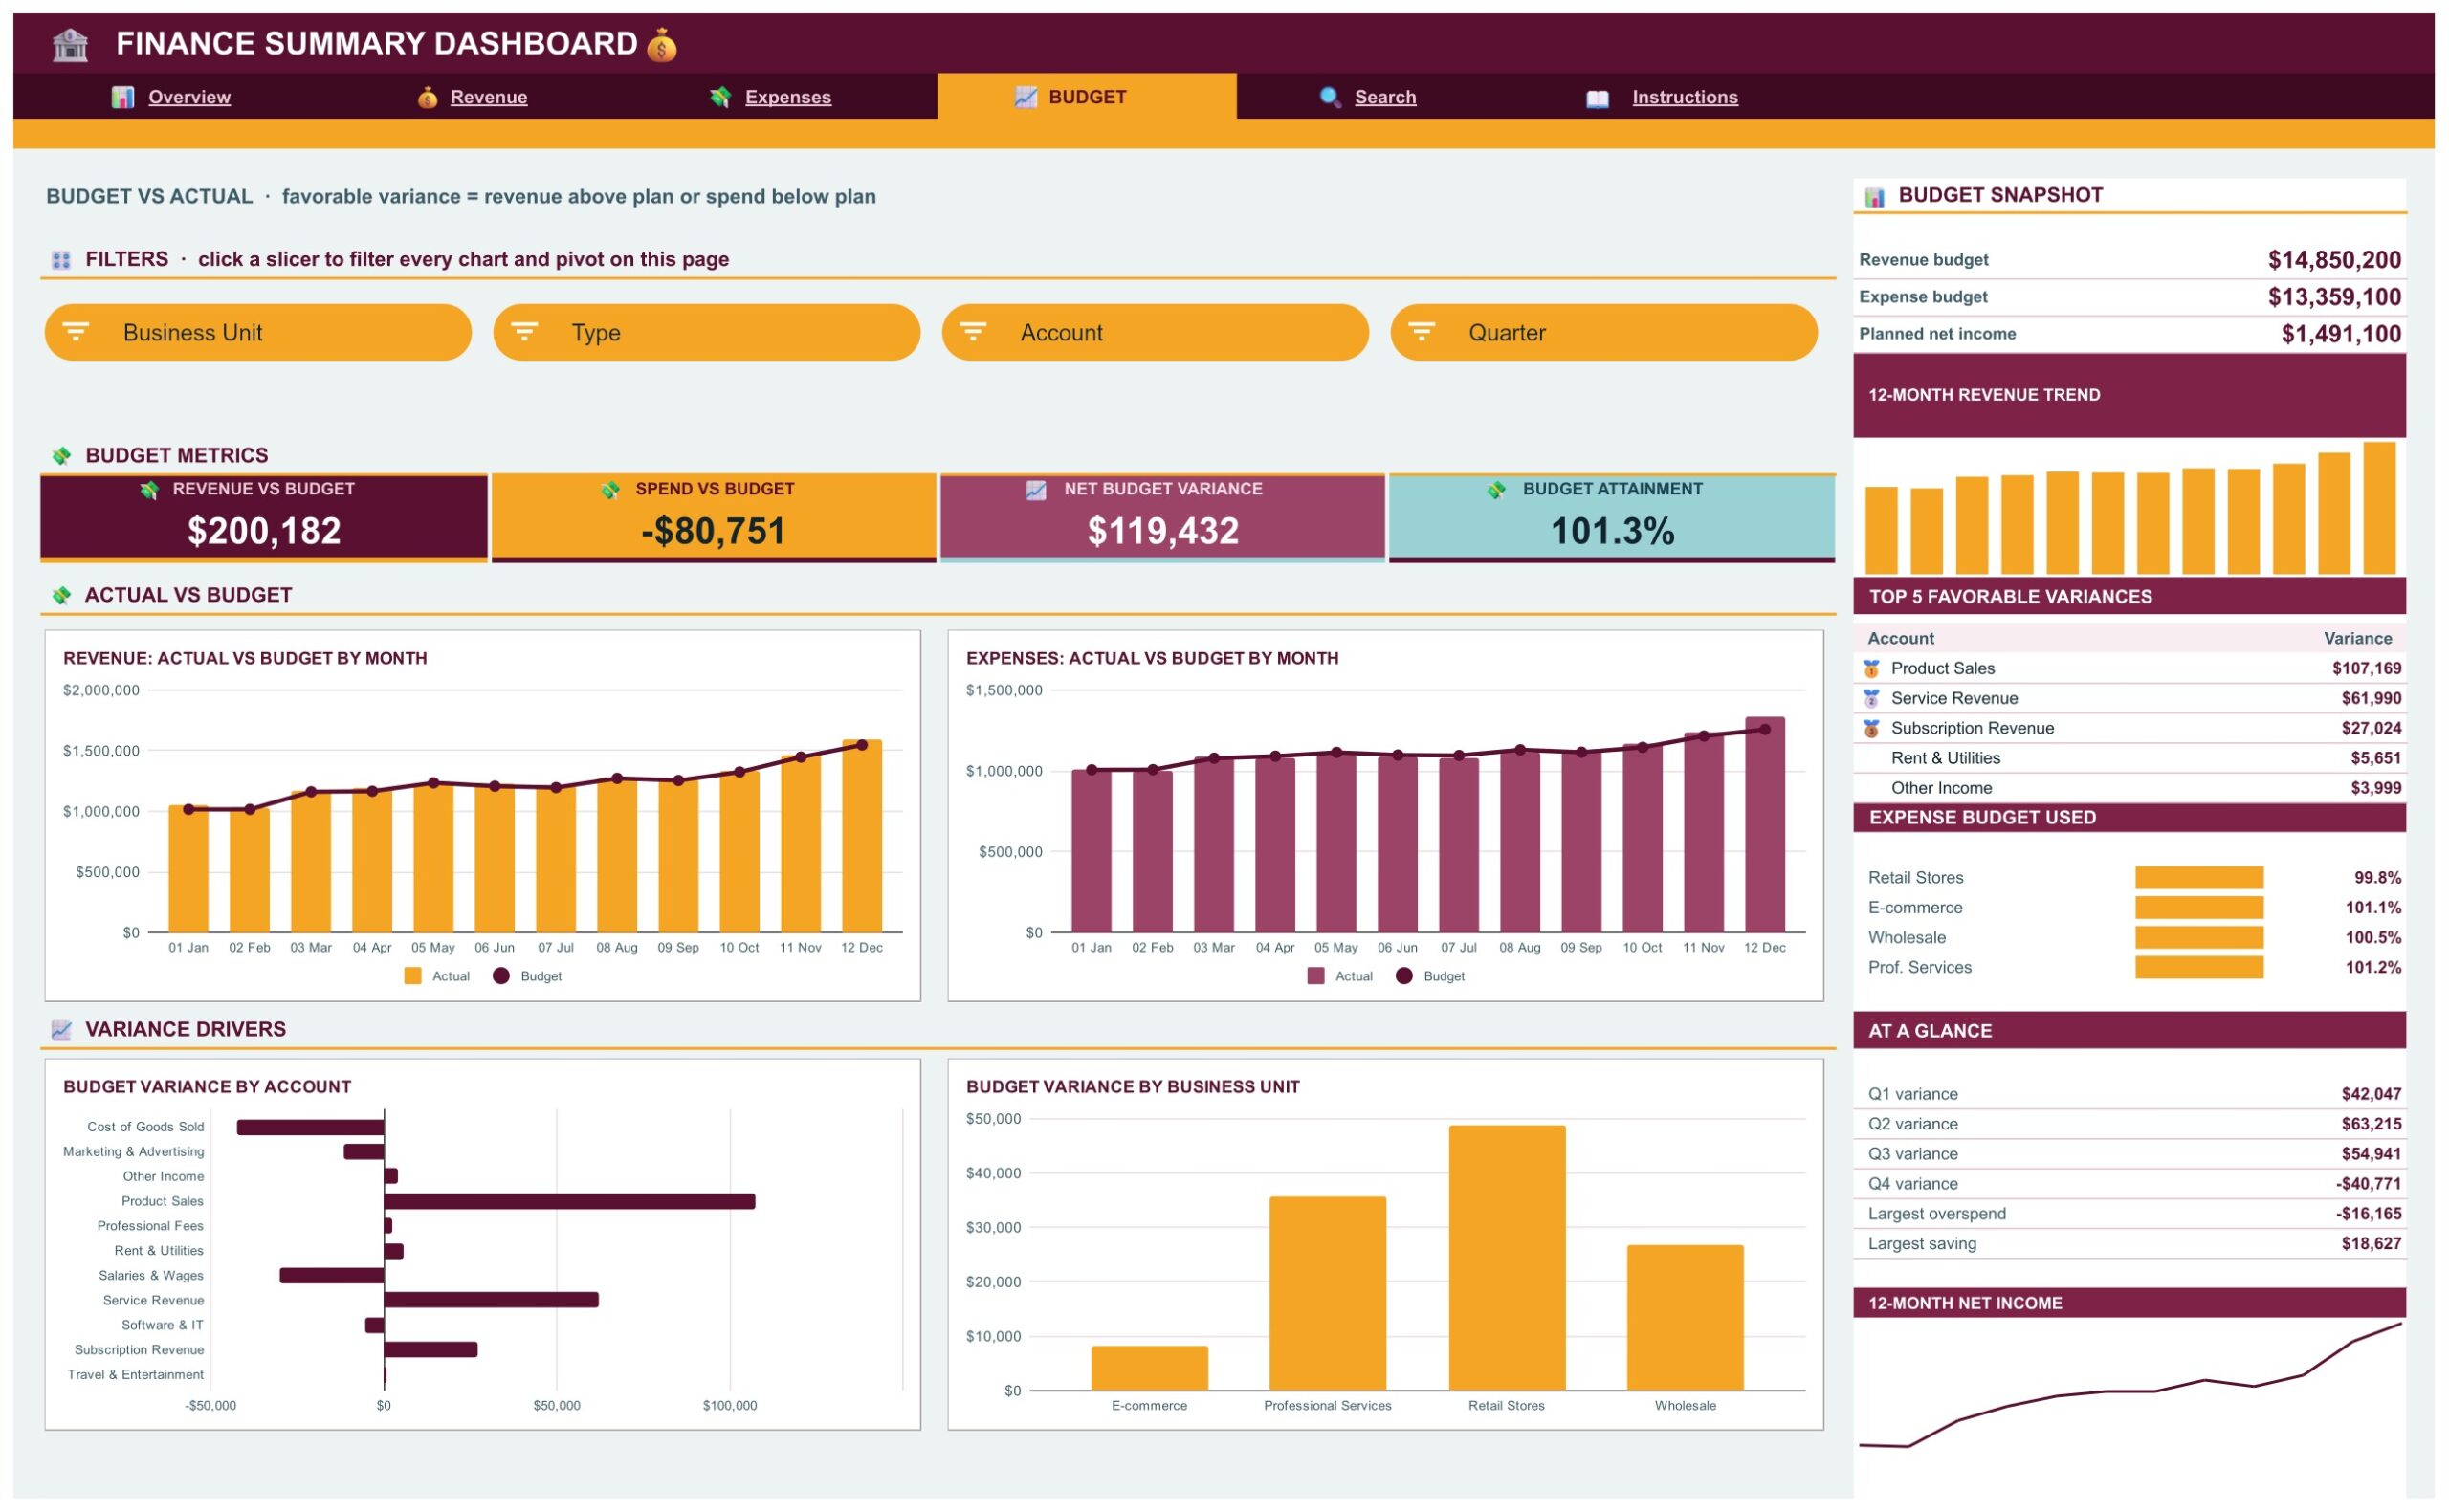
Revenue and Expenses Actual vs Budget by Month, Budget Variance by Account and Budget Variance by Business Unit. KPI cards show revenue vs budget, spend vs budget, net budget variance and budget attainment. The side panel lists the Top 5 favorable variances, the expense budget used by unit and the variance for every quarter. Business Unit, Type, Account and Quarter slicers filter the page.
Search Page
Type any Entry ID, such as GL-0001, in the input box and the full general-ledger entry appears: period end, month, quarter, business unit, type, account, department, actual and budget amounts, revenue, expense, net income, gross profit and budget variance.
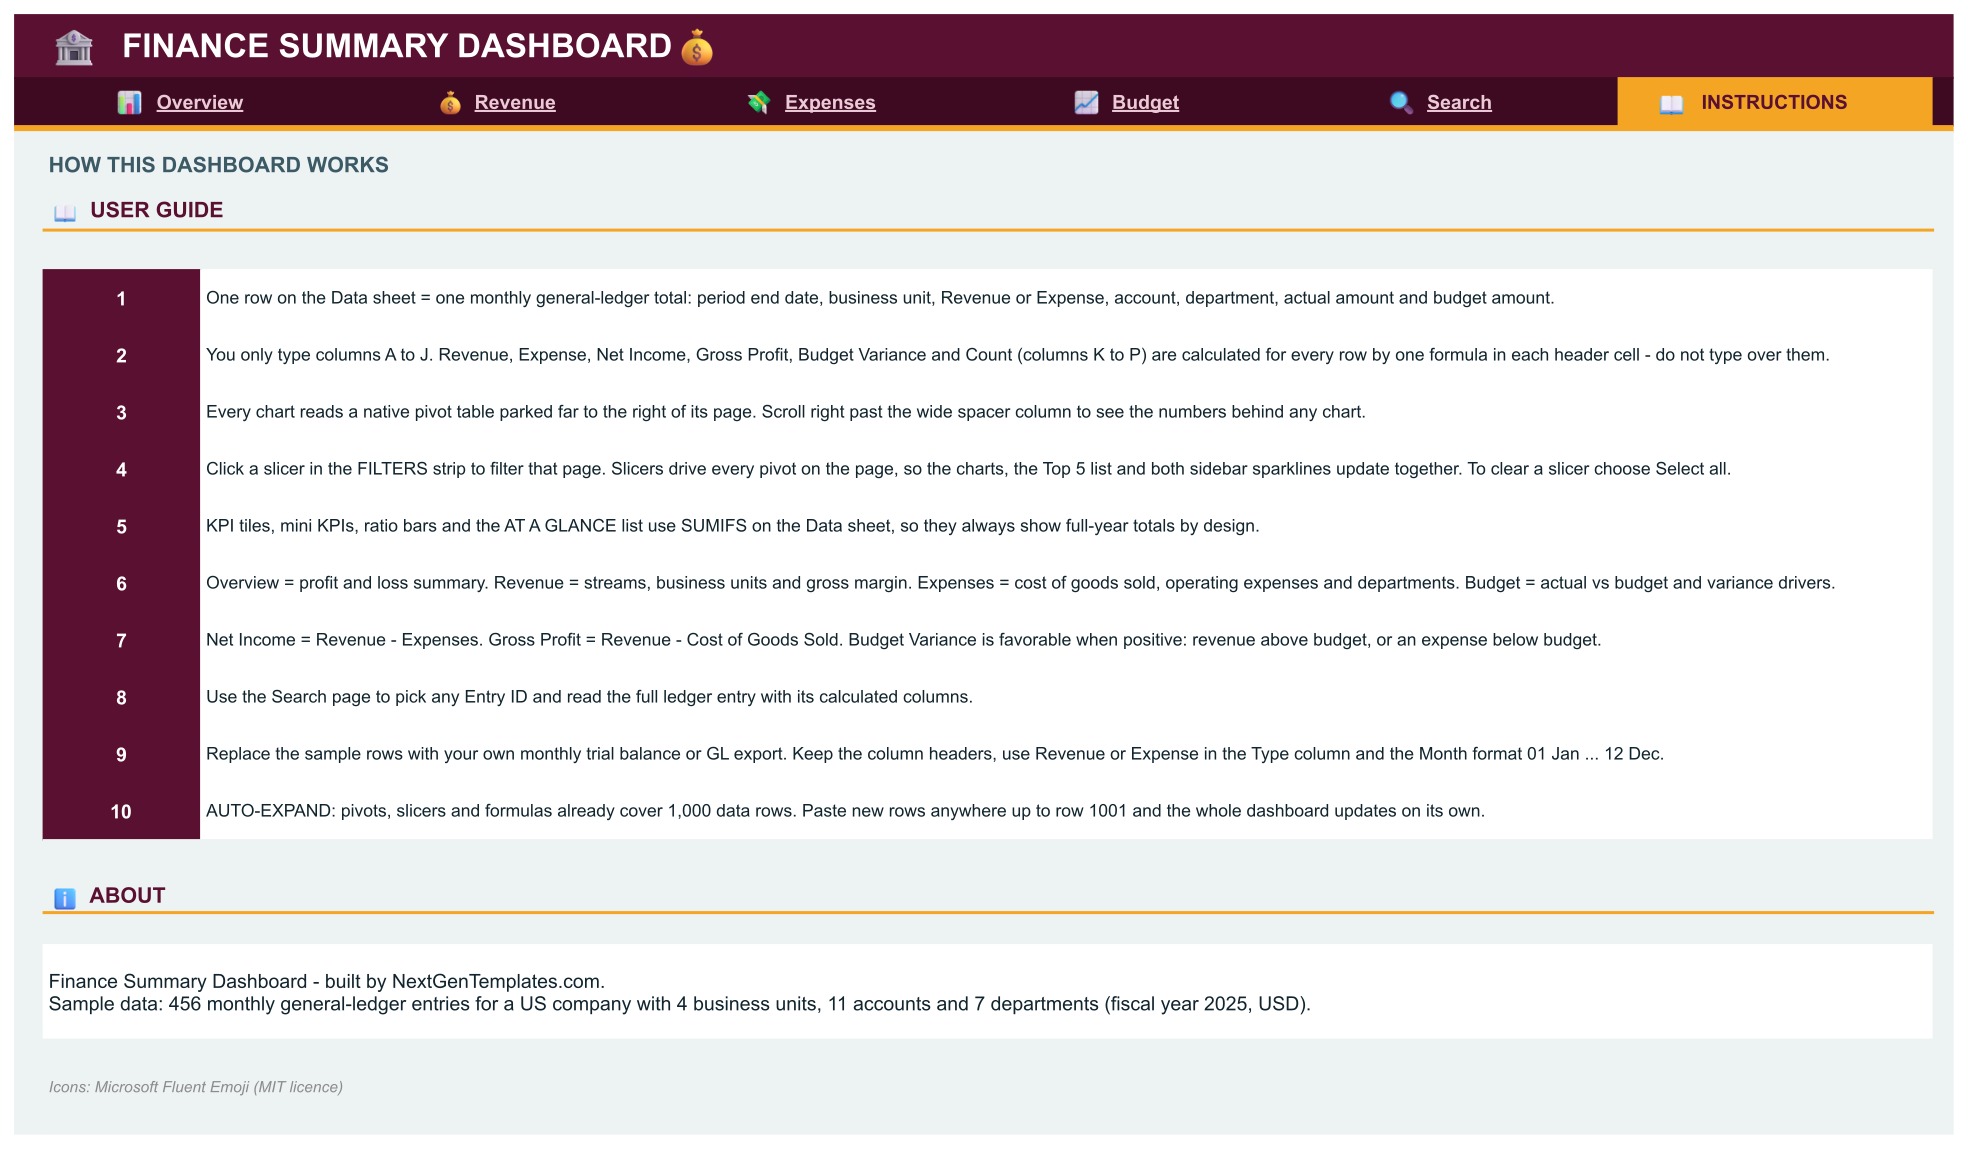
Instructions Page
Explains that each Data row is one business unit, account and month, how the pivot tables and slicers work, how net income, gross profit and budget variance are calculated, and how to replace the sample rows with your own trial balance or ledger export.
How a month-end review runs
A finance dashboard only helps if it fits the way the review already happens. This one follows the monthly routine most finance teams use.
Add the ledger totals. Paste your export into the Data tab: period end, business unit, type, account, department, actual amount and budget amount. The formula columns work out revenue, expense, net income, gross profit and budget variance.
Read the Overview. The four KPI cards show total revenue, total expenses, net income and net profit margin. If the margin moves, the other pages tell you why.
Find the drivers. The Revenue page shows where sales come from. The Expenses page shows which departments and accounts take the spend.
Check the budget. The Budget page shows the variance by account and business unit, so a vague worry about overspend becomes a short list of lines to look at.
Setting it up with your own data
Open the PDF guide from your download, click the link, and choose File, then Make a copy. The copy is yours to edit in Google Drive. Replace the sample rows on the Data tab with your own and keep the header row as it is. Pivot tables and slicers read the new rows on their own, so there is nothing to refresh.
As a profit and loss dashboard Google Sheets teams can copy in a minute, it is a reporting dashboard rather than an accounting system. If you also want a simple statement to start with, the Free Profit and Loss Statement Template in Excel and Google Sheets is a good companion.
Finance Summary Dashboard vs. a spreadsheet vs. BI software
| Feature | This Google Sheets dashboard | Plain finance spreadsheet | BI software |
|---|---|---|---|
| Cost | $9.99 one-time ✅ | Free, but you build it | Monthly subscription |
| Revenue, expenses and net income by unit and month | Yes ✅ | Manual formulas | Yes ✅ |
| Budget vs actual by account and unit | Yes ✅ | Build it yourself | Varies |
| Journal posting and statutory reports | No | No | Not applicable |
Who it is for, and who it is not for
It suits business owners, accountants and finance managers who report monthly results and budget variance. It does not suit teams that need bookkeeping, journal posting, invoicing or statutory reports, which this dashboard does not include.
Related templates
If you want something to sit beside the dashboard, these are the closest matches in the store:
- Financial Auditing Dashboard in Google Sheets: audit findings and compliance tracking.
- Zero-Based Budget Template in Excel and Google Sheets: plan the budget before you report against it.
- Small Business Bookkeeping Template in Excel and Google Sheets: record the transactions behind the totals.
Frequently asked questions
What does the Finance Summary Dashboard in Google Sheets show?
It turns a year of monthly general-ledger totals into total revenue, total expenses, net income, net profit margin, gross profit and budget against actual, split by business unit, account, department, quarter and month.
Is this an accounting system?
No. It is a reporting dashboard. You paste or type ledger totals into the Data tab and the pages report on them. It does not post journal entries or replace your accounting software.
How do I get my own copy?
Open the PDF guide in your download, click the link and choose File, then Make a copy. The copy lands in your Google Drive and is fully editable.
Do I need add-ons, scripts or macros?
No. It is built with formulas, pivot tables and native slicers. There is no add-on, no Apps Script and no macro to authorise.
How many ledger rows can it hold?
The pivots, slicers and formulas are set up for up to 1,000 ledger rows. You type 10 columns per row and the revenue, expense, net income, gross profit and variance columns calculate on their own.
Is the sample data real?
No. All business units, accounts and figures on the Data tab are fictional. Replace them with your own trial balance or ledger export.
Can I change the business units, accounts or departments?
Yes. Use your own values in the Data tab columns and the pivots and slicers pick them up.
How is budget variance calculated?
The Instructions tab explains it: favorable variance means revenue above plan or spend below plan, and the Budget page shows it by month, account, business unit and quarter.
Get the Finance Summary Dashboard
One-time payment, no subscription, instant download, PDF guide with the copy link included. See the Finance Summary Dashboard in Google Sheets. More dashboards are in the Google Sheets Dashboard category.