

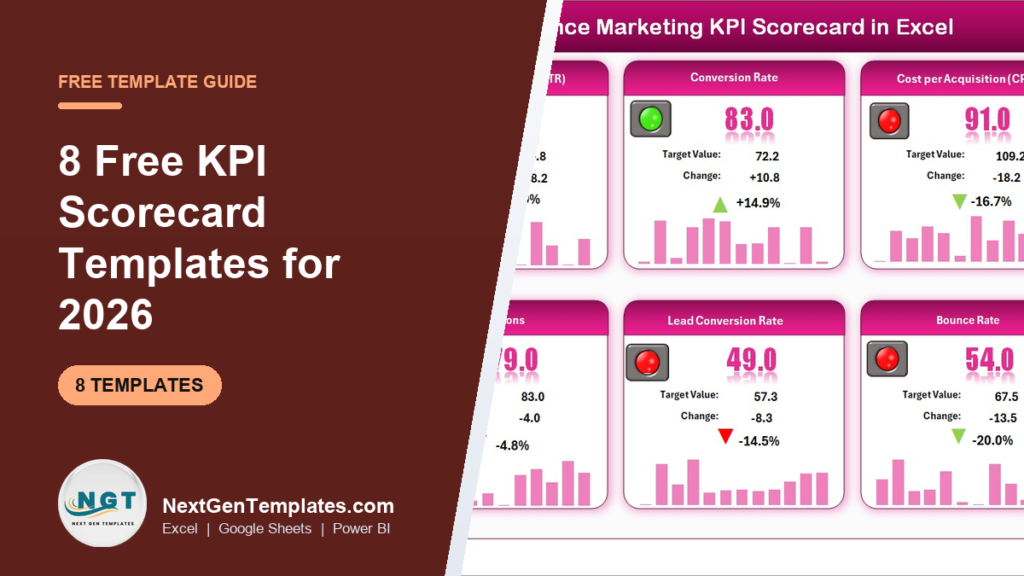
The best free KPI scorecard template is the one you build or copy from a free source, such as Microsoft Create, Vertex42 or the Google Sheets template gallery. Free files work for a handful of metrics. Once you need MTD and YTD views, target variance and trend charts, paid scorecards start at $8.99.
Last updated: November 2026
Key takeaways
- Free routes (Microsoft Create, Vertex42, the Google Sheets gallery, or a blank Excel sheet) cover a simple KPI scorecard template with a few metrics and manual colouring.
- Next Gen Templates has no free KPI scorecard download. This post lists free routes at category level and then eight paid products, clearly labelled.
- Free stops working when you need MTD and YTD views, actual vs target variance, traffic-light status and a KPI definition sheet in one file.
- The Mobile App Performance KPI Scorecard In Google Sheets costs $8.99 and tracks 20+ KPIs, the lowest price of the eight paid options.
- Buying all eight paid scorecards would cost $100.92, so pick the one that matches your function and format instead of buying the set.
 Launch offer
From your first Pivot Table to the Data Model, DAX, Power Query and a one-page KPI dashboard. 11h 51m of video by PK, with practice files, quizzes and a capstone.
Free KPI scorecard template routes and paid options compared
The table covers the eight paid NGT products. Free routes are described in the next sections because they are categories, not single files.
| Template | Format | Best For | Price |
|---|---|---|---|
| Performance Marketing KPI Scorecard in Excel (Best overall) | Excel | Marketing teams tracking campaigns against target | $14.99 |
| SEO Performance KPI Scorecard in Excel | Excel | SEO managers, agencies, bloggers | $14.99 |
| Mobile App Performance KPI Scorecard in Excel | Excel | App teams that report in PDF or PowerPoint | $12.99 |
| Mobile App Performance KPI Scorecard In Google Sheets (Best value) | Google Sheets | Remote app teams that share one live sheet | $8.99 |
| Podcast Performance KPI Dashboard in Excel | Excel | Podcasters and content teams | $14.99 |
| Performance Marketing KPI Dashboard in Power BI | Power BI | Multi-channel ad reporting with ROAS and CAC | $11.99 |
| Distributor Performance KPI Dashboard in Power BI | Power BI | Sales and supply-chain managers | $11.99 |
| Mobile App Performance KPI Dashboard in Google Sheets | Google Sheets | Product managers who want a dashboard with six worksheets | $9.99 |
How we picked these
We searched the Next Gen Templates catalog for KPI scorecards and closely related KPI dashboards and kept only paid products with a scorecard-style layout: actual vs target, status indicators and time views. We left out anything that was only loosely about KPIs.
We did not rank the free routes against each other, because we cannot see the individual files on third-party sites and will not describe them. We link only to their home pages so you can browse for yourself.
Format coverage also mattered. Three formats appear (Excel, Google Sheets, Power BI) so you can match the tool your team already uses.
Where can you find a free KPI scorecard template?
There are four free routes. Each one gets you a working layout without paying anything, and each has limits that show up once the scorecard becomes a monthly report rather than a one-off.
Microsoft Create
Microsoft publishes a library of Excel and other Office templates at create.microsoft.com. Searching it for scorecard or KPI terms is the quickest way to get a free file that opens in Excel. Check what you get before you build on it: whether the status colours are driven by formulas or typed in by hand, and whether it has a place for targets at all.
Vertex42
Vertex42 is a long-running template site with many free spreadsheets. It is a reasonable place to look for a plain tracker layout. As with any free download, read the file before you commit data to it, and check whether it matches the metrics your team reports.
Google Sheets template gallery
If your team lives in Google Workspace, the built-in template gallery inside Google Sheets is the lowest-friction start. Sharing is automatic. The trade-off is that gallery templates tend to be general-purpose, so KPI-specific logic such as lower-is-better metrics usually has to be added by you.
Build your own in Excel
A blank workbook is the free route with the most control. Section three of this post shows exactly how to structure it. If you already use Excel daily, this often beats a downloaded file because you know every formula in it.
How do you build a simple KPI scorecard template in Excel?
A scorecard has one job: show each KPI’s actual value next to its target and say whether you are on track. You need four columns of input and three of calculation.
- List the KPIs. Give each one a name, a unit and a direction. Direction matters: revenue is higher-is-better, while churn rate and crash rate are lower-is-better.
- Add a target column. One target per KPI per month. Without a target, a scorecard is only a table of numbers.
- Enter actuals monthly. Keep these on a separate input sheet so the scorecard sheet only reads from it.
- Calculate variance. Variance % = (Actual minus Target) divided by Target. For lower-is-better KPIs, flip the sign so a positive number always means good.
- Apply status colours with conditional formatting. A common convention is green at 100% of target or better, amber from 90% to 99%, red below 90%. Pick thresholds your team agrees on and write them down.
- Add MTD and YTD columns. MTD uses the selected month. YTD sums or averages from January to that month, depending on the metric. A ratio like conversion rate must be recalculated from totals, not averaged.
- Write a definition sheet. One line per KPI with formula, unit and data source, so two people never calculate the same metric differently.
Worked example
Suppose a marketing team has a target of 400 leads in March and records 372. Variance is (372 minus 400) divided by 400, which is minus 7%. That is 93% of target, so the status is amber under the thresholds above.
Now take cost per lead with a target of $25 and an actual of $27. This is lower-is-better, so the raw variance of +8% is bad. Flip the sign and you get minus 8%, 92% of target, also amber. If you forget the flip, the cell shows green for a worse result. That single mistake is the most common reason a hand-built scorecard misleads people.
Formulas worth knowing
- ROAS = revenue from ads divided by ad spend. $5,000 revenue on $1,000 spend is 5.0.
- CAC = total acquisition spend divided by new customers. $3,000 spend and 60 new customers is $50.
- CTR = clicks divided by impressions. 450 clicks on 30,000 impressions is 1.5%.
- Churn rate = customers lost in the period divided by customers at the start. 20 lost from 800 is 2.5%.
When does a free KPI scorecard template stop working?
This section is the paid part of the post. NGT sells the products below and offers no free scorecard download, so none of these are free. They are here because free templates stop working at predictable points:
- More than about 15 KPIs. Hand-built formulas start to break when someone inserts a row.
- Lower-is-better metrics. Free layouts often colour them the wrong way round.
- MTD plus YTD plus a month selector. Building dropdown-driven views takes hours in a blank sheet.
- Trend charts per KPI. A chart that changes when you pick a KPI needs setup most people skip.
- A shared definition of each metric. Without a KPI dictionary, the monthly meeting turns into an argument about formulas.
If your time is worth even $20 an hour, a scorecard that saves three hours of building has paid for itself at $14.99. The eight below are ranked by how many readers they fit and how much they add over a free file.
The 8 best paid KPI scorecard templates for 2026
1. Performance Marketing KPI Scorecard in Excel (best overall)
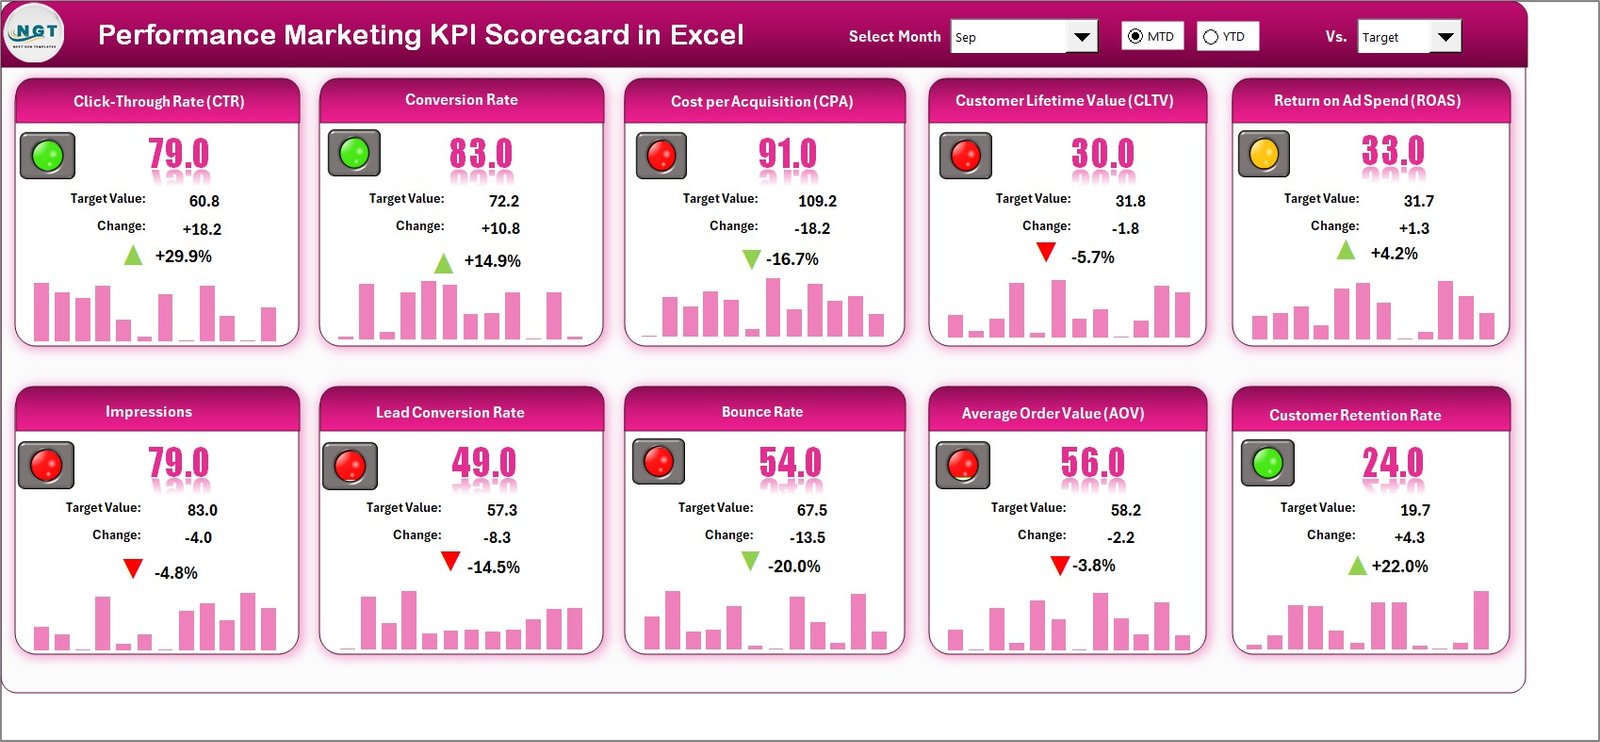
It ranks first because it fits the widest group of buyers: anyone who reports on campaigns and has to show actual vs target every month. It is a ready-made KPI scorecard template in Excel for paid ads, lead generation or full-funnel work.
Who it is for: marketing managers, agencies and small teams that currently paste numbers into a slide each month.
- Interactive scorecard dashboard with MTD and YTD tracking
- Actual vs target comparison with colour indicators and conditional formatting
- Dynamic KPI trend charts
- Input sheet that refreshes the whole scorecard when updated
- Built-in KPI definition sheet with formulas and definitions
Use cases: compare a 400-lead target with 372 actual and see amber at once; check cost per lead against a $25 target; review YTD results before a quarterly meeting; hand a new analyst the definition sheet so they calculate CTR the same way you do.
Price: $14.99. Get the Performance Marketing KPI Scorecard in Excel.
Best for: marketers who want a free-template layout with the automation already built.
2. SEO Performance KPI Scorecard in Excel
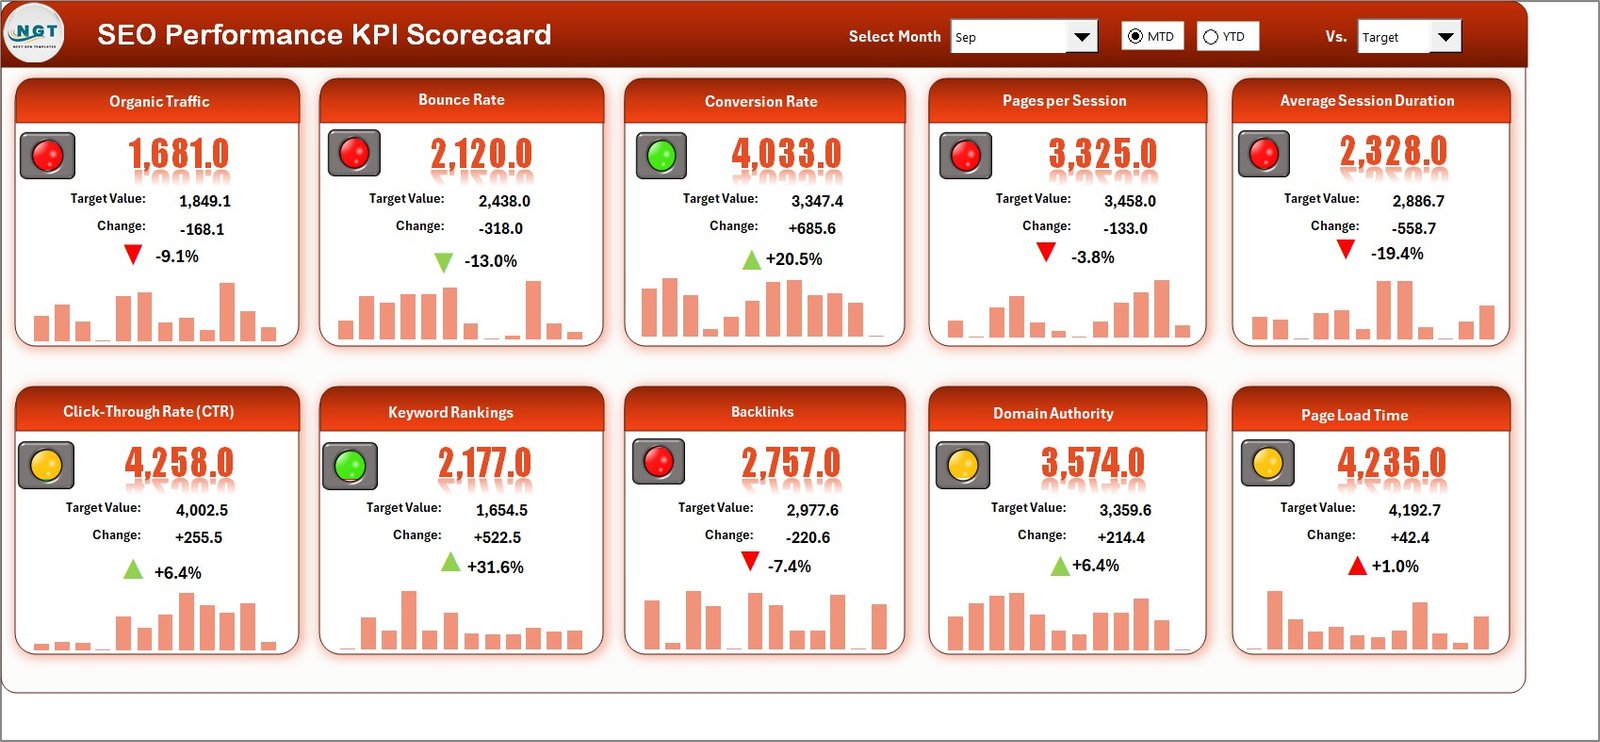
SEO data lives in Google Analytics, Google Search Console and third-party tools. This scorecard pulls the reporting into one Excel file so you can see progress against target without switching tabs.
Who it is for: SEO managers, agencies, bloggers and e-commerce teams.
- Centralised SEO dashboard
- MTD and YTD tracking
- Target vs actual analysis to flag underperforming KPIs
- Trend visualisation of SEO growth over time
- Automatic dashboard refresh when you add new data
Use cases: report organic traffic against a monthly goal; show a client which KPIs are in the red; review the year so far before planning the next quarter.
Price: $14.99. See the SEO Performance KPI Scorecard in Excel.
Best for: anyone who reports SEO monthly and wants a repeatable format.
3. Mobile App Performance KPI Scorecard in Excel
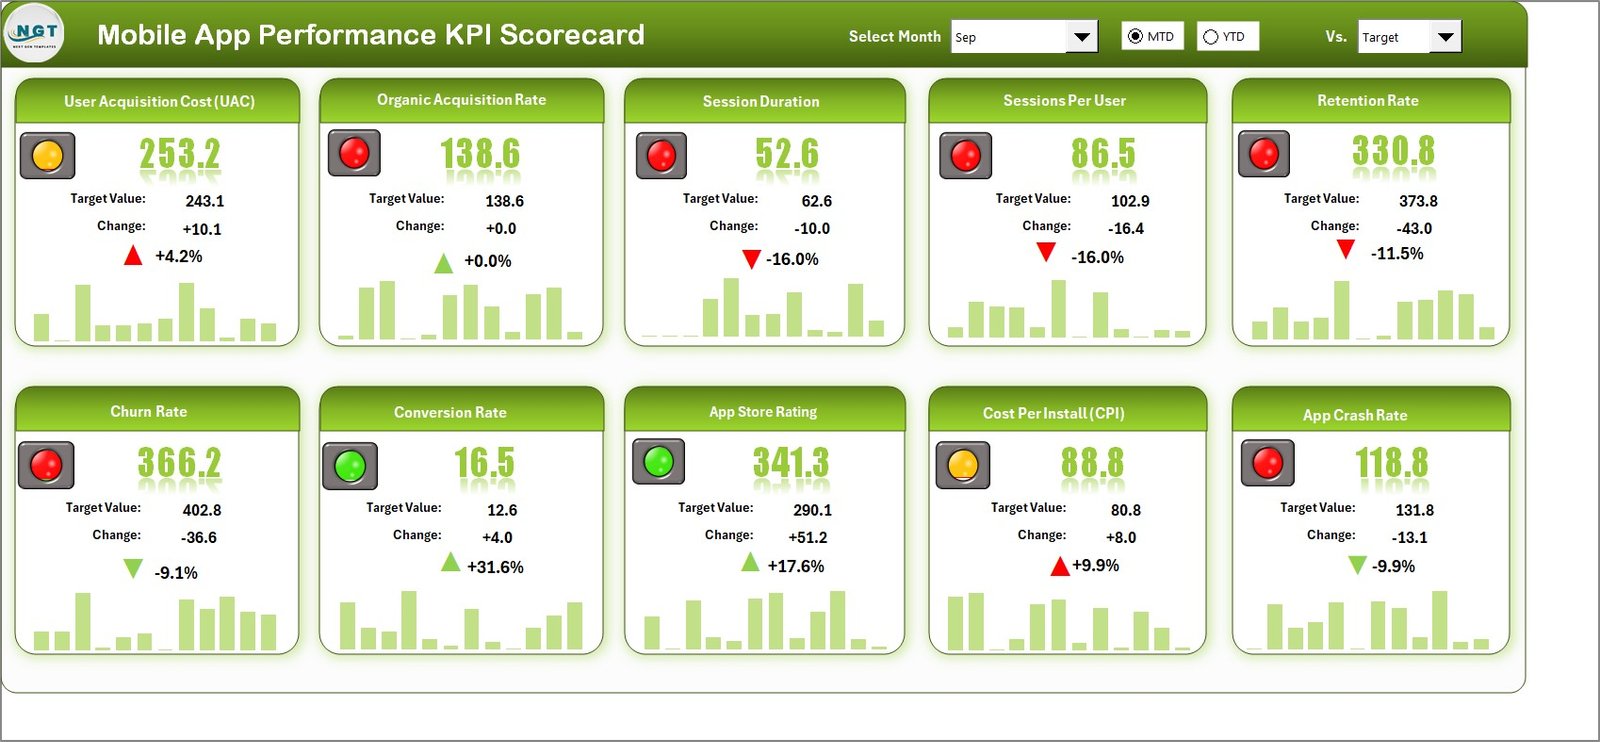
This is a four-sheet workbook: Scorecard, KPI Trend, Input Data and KPI Definition. It covers acquisition, engagement, retention, performance and revenue metrics such as downloads, active users, crash rate and churn.
Who it is for: developers, product managers, marketers and finance people who share one app report.
- Dropdowns to switch months and MTD or YTD views
- Actual vs target with colour-coded icons
- Automatic trend charts by month
- Unit, formula and definition shown for every metric
- Exports visuals to PDF or PowerPoint, no VBA or add-ons
Use cases: check whether a 2.5% churn rate target was met; show crash rate to engineering with the inverted colour logic; drop a trend chart into a board deck.
Price: $12.99. Buy the Mobile App Performance KPI Scorecard in Excel.
Best for: app teams that live in Excel and present in PowerPoint.
4. Mobile App Performance KPI Scorecard In Google Sheets (best value)
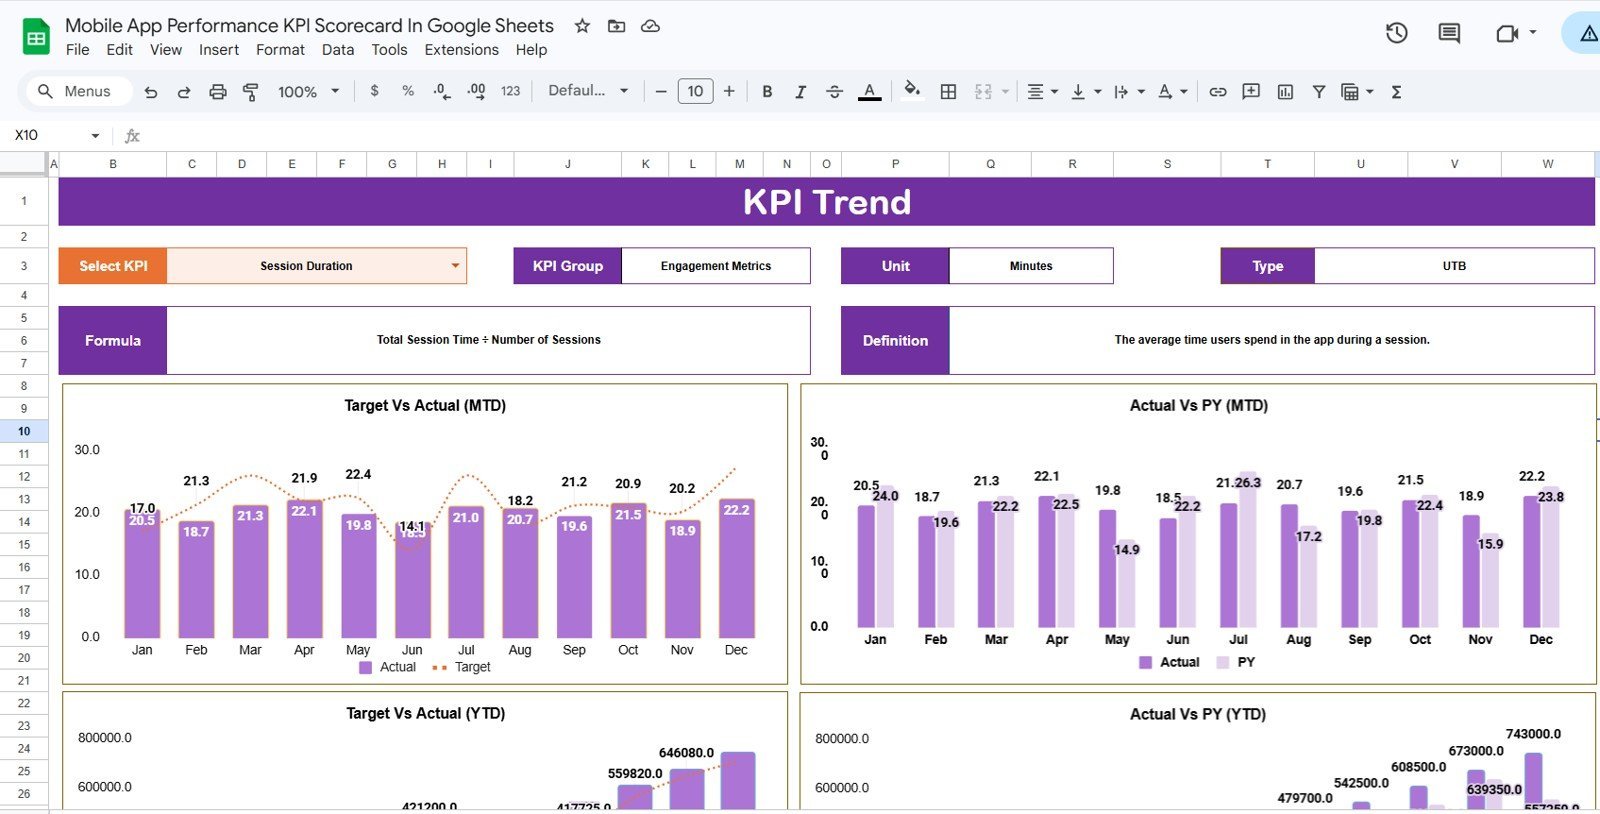
At $8.99 this is the cheapest of the eight and has the most pre-built KPIs: 20+ across acquisition (CAC, installs), engagement (DAU, MAU, session duration), retention (Day-1, Day-7, Day-30), monetisation (ARPU, LTV) and quality (crash rate, load time).
Who it is for: remote app teams that want one shared, always current sheet.
- MTD and YTD toggle from a single dropdown
- Green, amber and red status based on variance to target
- Automatic inverted logic for Lower-the-Better KPIs such as crash rate and churn
- KPI Trend sheet with MTD and YTD line charts for any selected KPI
- Four structured sheets; setup takes under 5 minutes
Use cases: let leadership choose their own view; compare Day-30 retention with plan; stop correcting the colour of churn by hand.
Price: $8.99. Get the Mobile App KPI Scorecard in Google Sheets.
Best for: the lowest price with the most prebuilt app KPIs.
5. Podcast Performance KPI Dashboard in Excel
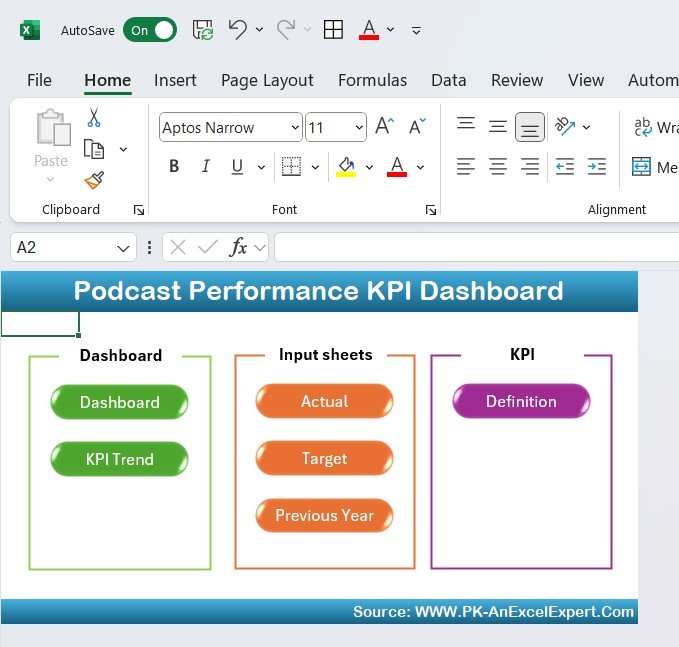
This is a dashboard rather than a strict scorecard, but it fills the same need for audio creators who track listeners and money in one place.
Who it is for: podcasters, marketing teams and content creators.
- Listener growth and new subscriber tracking
- Downloads per episode
- Engagement such as average listening time and retention
- Revenue from ads, sponsorships and product sales
- Weekly, monthly or quarterly time views
Use cases: find which episodes drive the most downloads; compare sponsorship income to listener growth; summarise a quarter for a sponsor.
Price: $14.99. View the Podcast Performance KPI Dashboard in Excel.
Best for: shows that need to prove audience and revenue growth.
6. Performance Marketing KPI Dashboard in Power BI

This is the Power BI sibling of number one. It tracks ROAS, CAC, CTR and conversion rates across channels such as Google Ads, Facebook and Instagram in a single view.
Who it is for: marketing teams already using Power BI, or running enough channels that Excel feels slow.
- Multi-channel campaign monitoring
- Daily, weekly or monthly time analysis
- Real-time data integration from marketing platforms
- Customisable KPIs and metrics
Use cases: see whether $1,000 of spend returned a ROAS of 5.0; compare CAC between channels; trim the channels that miss target.
Price: $11.99. Choose the Performance Marketing KPI Dashboard in Power BI.
Best for: multi-channel spend reviews in Power BI.
7. Distributor Performance KPI Dashboard in Power BI
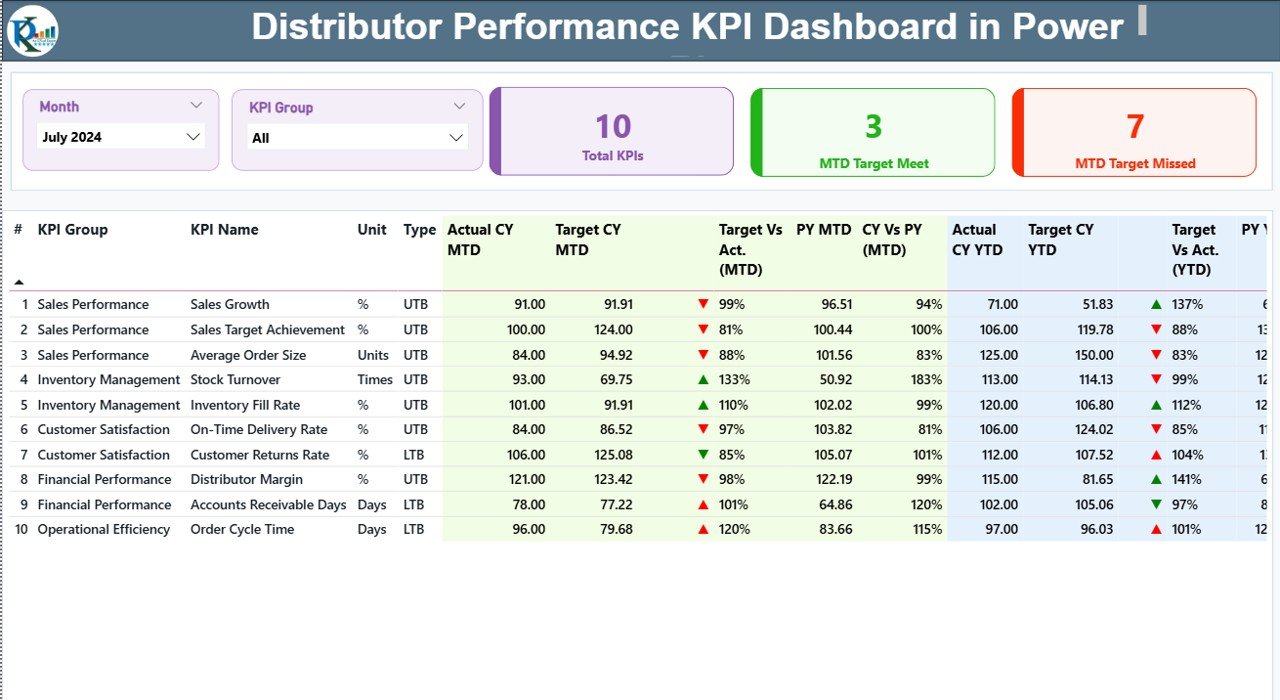
Three pages (Summary, KPI Trend and Definition) give a scorecard-style view of distributor sales and efficiency. It reads from Excel data sheets and refreshes the visuals.
Who it is for: sales managers, supply-chain heads and analysts who manage distributors.
- Month and KPI Group slicers
- Cards for total KPIs, MTD Target Met and MTD Target Missed
- Actual vs target for MTD and YTD, plus current vs previous year
- Green and red arrows for status
- Drill-through to the KPI calculation logic, with LTB and UTB types
Use cases: spot which distributors miss target this month; compare this year to last; explain how a KPI is calculated.
Price: $11.99. Open the Distributor Performance KPI Dashboard in Power BI.
Best for: distributor networks reported in Power BI.
8. Mobile App Performance KPI Dashboard in Google Sheets

A second Google Sheets option with six worksheets and a main dashboard sheet. It compares month-to-date, year-to-date and previous-year data.
Who it is for: developers, product managers and marketers who want a customisable sheet.
- Month selector dropdown
- Target vs actual comparison
- Up and down arrows with colour-coded conditional formatting
- Customisable metrics for acquisition, retention, in-app activity and revenue
Use cases: track retention against last year; adjust metrics to your own app; update a figure and watch the dashboard change.
Price: $9.99. See the Mobile App KPI Dashboard in Google Sheets.
Best for: teams that want the previous-year comparison in a sheet.
How do you choose between a free and a paid scorecard?
| Your situation | Choose |
|---|---|
| Under 10 KPIs, one report owner, no MTD or YTD | Free route or a blank Excel sheet |
| Marketing campaigns in Excel | Performance Marketing KPI Scorecard in Excel, $14.99 |
| Organic search reporting | SEO Performance KPI Scorecard in Excel, $14.99 |
| App team on Google Workspace, lowest cost | Mobile App Scorecard in Google Sheets, $8.99 |
| App team presenting in PowerPoint | Mobile App Scorecard in Excel, $12.99 |
| Power BI shop with ads or distributors | The two Power BI dashboards, $11.99 each |
If you are still unsure, start with the format. A Google Sheets team should not buy an Excel file just because the layout looks better.
For broader dashboards beyond scorecards, see our guides to free Excel dashboard templates, free Google Sheets dashboard templates and free Power BI dashboard templates. If marketing is your function, the free marketing calendar templates and free social media content calendar templates posts pair well with a scorecard. For planning work, try the free project plan templates.
When is a paid KPI scorecard NOT the right answer?
A scorecard is a reporting layer. It does not collect data for you, so you still type or paste in actuals each month. If you want live feeds from an ad platform with no manual entry and have budget for it, dedicated BI or SaaS software is the better answer.
Skip the paid route if you track fewer than ten KPIs once a quarter. A blank Excel sheet built with the steps above will do the job, and you will understand every formula in it.
These templates are also built around specific functions. If your KPIs are in finance, HR or manufacturing, none of the eight above is a direct fit, and you should search the catalog for a template in your own area rather than bend a marketing scorecard to fit.
Finally, a template cannot fix a missing target. If nobody agrees what good looks like, the colours will mean nothing. Settle targets first, then pick a tool.
Frequently asked questions
Is there a free KPI scorecard template?
Yes, several free routes exist, including Microsoft Create, Vertex42 and the Google Sheets template gallery, or you can build one in a blank Excel sheet. Next Gen Templates has no free scorecard download. Free files suit a few metrics, while paid scorecards add MTD and YTD views and automatic status colours.
What is a KPI scorecard template?
A KPI scorecard template is a spreadsheet or report layout that lists your key metrics with their actual values, targets and a status indicator. It shows at a glance which KPIs are on track. Good ones add month-to-date and year-to-date views, variance and trend charts.
What should a KPI scorecard include?
At minimum it needs a KPI name, unit, direction (higher or lower is better), target, actual and a status colour. Better scorecards add MTD and YTD columns, a trend chart per KPI and a definition sheet that records the formula and data source for every metric.
How do I make a KPI scorecard in Excel?
List your KPIs with a unit and direction, add monthly targets, record actuals on an input sheet, and calculate variance as (actual minus target) divided by target. Apply conditional formatting for green, amber and red, then add MTD and YTD columns and a definition sheet.
What is the difference between a KPI scorecard and a KPI dashboard?
A scorecard compares each KPI to a target and shows status, usually in a compact table. A dashboard is broader and leans on charts to explore the data. In practice the terms overlap, and several products here combine a scorecard sheet with trend charts.
How much does a KPI scorecard template cost?
The paid scorecards in this post range from $8.99 for the Mobile App Performance KPI Scorecard In Google Sheets to $14.99 for the Performance Marketing and SEO Excel scorecards. Buying all eight would total $100.92, so most buyers only need one that matches their function.
Can I use a KPI scorecard in Google Sheets?
Yes. The Mobile App Performance KPI Scorecard In Google Sheets costs $8.99, tracks 20+ KPIs and offers an MTD and YTD dropdown with traffic-light status. A second option, the Mobile App Performance KPI Dashboard in Google Sheets, costs $9.99 and uses six worksheets.
How do you calculate variance in a KPI scorecard?
Variance percentage equals actual minus target, divided by target. With a target of 400 and an actual of 372, variance is minus 7%. For lower-is-better KPIs such as churn or crash rate, flip the sign so a positive result always means good performance.
When should I stop using a free template and upgrade?
Upgrade when you track more than about 15 KPIs, need MTD and YTD views with a month selector, or lose time fixing broken formulas each month. At $8.99 to $14.99, a paid scorecard usually pays for itself in the first few hours it saves.
Get more KPI scorecard templates
Start with the Performance Marketing KPI Scorecard in Excel at $14.99, or take the lowest-cost route with the Mobile App Performance KPI Scorecard In Google Sheets at $8.99. All eight options are listed in the table near the top of this page.
You can also watch walkthroughs on the Next Gen Templates YouTube channel. For other free-template guides, see our free invoice templates, free purchase order templates, free stock register templates and free Gantt chart templates.