

The core absenteeism rate calculation is (total days absent ÷ total scheduled workdays) × 100. Track it alongside seven partner metrics — attendance rate, the Bradford Factor, absence frequency, lost time rate, average duration, unplanned absence rate and cost of absenteeism — to see not just how much time is lost, but which patterns are costing you money.
Last updated: September 2026
Key takeaways
- The absenteeism rate calculation is (days absent ÷ scheduled workdays) × 100; US private-sector absence sits near 3.2% (Bureau of Labor Statistics), and unscheduled absence alone should stay under 1.5%.
- The Bradford Factor (S² × D) flags frequent short absences; a score above 125 usually triggers a formal HR review.
- Unplanned absenteeism, not planned leave, is the expensive kind — the CDC Foundation puts lost US productivity at roughly $225 billion a year.
- Every metric here has an exact formula and a benchmark range, so you can grade your own workforce today.
- The Employee Leave Dashboard in Excel ($17.99) calculates absence duration, leave cost and absence rate out of the box — our best overall pick of the 8 templates below.
Absenteeism & attendance templates compared
| Template | Format | Best for | Price |
|---|---|---|---|
| Employee Leave Dashboard (Best overall) | Excel | Absence rate, duration & leave-cost reporting | $17.99 |
| Attendance Management System – Lite | Excel VBA | Daily attendance capture & attendance rate | $19.99 |
| Employee Leave Dashboard | Power BI | Multi-department absence roll-up | $17.99 |
| Office Event Attendance Dashboard (Best value) | Excel | Meeting & event attendance rate | $17.99 |
| Leave Application Management System | Excel VBA | Absence request & approval workflow | $19.99 |
| Shift Scheduling Management System | Excel VBA | Roster coverage & shift attendance | $19.99 |
| Leave Balance Adjustment Management System | Excel VBA | Accurate leave balances feeding absence rate | $19.99 |
| Office Event Attendance Dashboard | Power BI | Interactive attendance analytics | $17.99 |
How we picked these
We searched the full NextGenTemplates catalogue of 500+ Excel, Google Sheets and Power BI products for tools that actually compute the eight metrics on this page — not spreadsheets that merely store dates. Every pick had to calculate at least two of the metrics automatically, ship with sample HR data, and work offline in Excel or Power BI Desktop. We excluded free single-tab trackers and any template without a working formula layer, because a metric you have to hand-calculate is a metric you will stop tracking by week three.
The 8 absenteeism & attendance metrics to track in 2026
For each metric you get a one-sentence definition, the exact formula, a realistic benchmark range, and the single mistake that quietly ruins the number. Later we map each one to the NGT dashboard that already calculates it.
1. Absenteeism rate
The share of scheduled working time lost to absence — the headline number every HR report opens with.
Formula: (Total days absent ÷ Total scheduled workdays) × 100.
Benchmark: US private-sector absence averages about 3.2% (BLS); best-in-class operations hold total absenteeism under 2% and unscheduled absence under 1.5%.
The mistake teams make: folding approved vacation and public holidays into “days absent.” That inflates the rate and hides the unplanned absence that actually disrupts staffing. Separate planned leave from unplanned before you divide.
2. Attendance rate
The mirror image of absenteeism — the percentage of scheduled time employees were actually present and working.
Formula: (Days actually worked ÷ Scheduled workdays) × 100.
Benchmark: 95% or higher is healthy for salaried teams; dropping below 90% signals a coverage or morale problem worth investigating.
The mistake teams make: counting a partial day (someone who left after two hours) as full attendance. Track hours, not just a present/absent flag, or your attendance rate will read artificially high.
3. Bradford Factor
A weighted score that punishes frequent short absences far more than one long, planned one — the classic tool for spotting disruptive absence patterns.
Formula: S² × D, where S = number of separate absence spells and D = total days absent, over a rolling 52 weeks. Ten one-day absences score 10² × 10 = 1,000; one ten-day absence scores 1² × 10 = 10.
Benchmark: under 50 is low concern; 51–124 warrants a conversation; 125+ typically triggers formal review; 500+ is a serious pattern.
The mistake teams make: applying the trigger mechanically to someone with a documented disability or chronic condition. Use it to start a conversation, not to auto-generate discipline, or you invite an equality claim.
4. Absence frequency rate
How often absence happens per head, regardless of how long each spell lasts — the metric that catches “Monday-itis” before it spreads.
Formula: (Number of absence spells ÷ Number of employees) over the period.
Benchmark: roughly 2–3 spells per employee per year is normal; more than 4 short spells per person points to disengagement or a culture issue.
The mistake teams make: tracking only total days lost. A team with the same absenteeism rate but double the frequency has a very different (and more fixable) problem.
5. Lost time rate
Absenteeism expressed in working hours rather than whole days — essential where shifts, part-timers and overtime make “a day” a fuzzy unit.
Formula: (Total hours lost to absence ÷ Total hours scheduled) × 100.
Benchmark: UK employers lose around 6–8 days per employee per year to sickness (CIPD); converted to hours that is roughly a 2.5–3.5% lost time rate.
The mistake teams make: mixing units — reporting some absences in days and some in hours in the same calculation. Pick hours for any workforce that isn’t 100% full-time salaried.
6. Average duration of absence
The typical length of a single absence spell — the fastest way to separate short-term sickness from long-term cases that need case management.
Formula: Total days absent ÷ Number of absence spells.
Benchmark: 2–4 days is normal for short-term sickness; anything averaging above 20 days means long-term absence is dominating and should be reported separately.
The mistake teams make: blending short-term and long-term absence into one average. One six-week case can drag the mean up until it hides the fact that most people take single days.
7. Unplanned absence rate
The slice of absence that arrives with no notice — the costliest kind, because it triggers last-minute cover, overtime and missed deadlines.
Formula: (Unplanned absent days ÷ Total scheduled days) × 100.
Benchmark: aim to keep it under 1.5%; unscheduled absence is estimated to cost employers thousands per hourly worker each year once backfill is counted.
The mistake teams make: lumping pre-approved sick leave and genuine no-shows together. Only truly unplanned absence should drive your coverage and overtime planning.
8. Cost of absenteeism
The dollar value of lost time — the number that turns an HR metric into a finance conversation and unlocks budget for fixes.
Formula: (Absent days × average daily wage) + replacement/overtime cost + estimated productivity loss.
Benchmark: US estimates put the fully loaded cost between roughly $1,685 and $3,600 per employee per year; the CDC Foundation pegs total US productivity loss near $225 billion annually.
The mistake teams make: counting only the absent employee’s wage. The expensive part is the overtime and temp cover you pay to keep the work moving — include it or you will under-state the case for change by half.
The metric cheat-sheet
| Metric | Formula | Healthy benchmark | Where to see it |
|---|---|---|---|
| Absenteeism rate | (Days absent ÷ scheduled days) × 100 | < 2% total; < 1.5% unscheduled | Employee Leave Dashboard |
| Attendance rate | (Days worked ÷ scheduled days) × 100 | 95%+ | Attendance Management System |
| Bradford Factor | S² × D (rolling 52 weeks) | < 125 | Attendance Management System |
| Absence frequency | Spells ÷ employees | 2–3 / year | Leave Application Management System |
| Lost time rate | (Hours lost ÷ hours scheduled) × 100 | 2.5–3.5% | Shift Scheduling Management System |
| Average duration | Days absent ÷ spells | 2–4 days short-term | Employee Leave Dashboard (Power BI) |
| Unplanned absence rate | (Unplanned days ÷ scheduled days) × 100 | < 1.5% | Office Event Attendance Dashboard |
| Cost of absenteeism | Days × wage + cover + lost output | < $1,700 / employee | Employee Leave Dashboard |
The 8 templates that already calculate these metrics
Formulas are only useful if something runs them on live data every week. These eight NGT templates do exactly that — pick by the format your team already uses and the metric you most need to move.
1. Employee Leave Dashboard in Excel — best overall
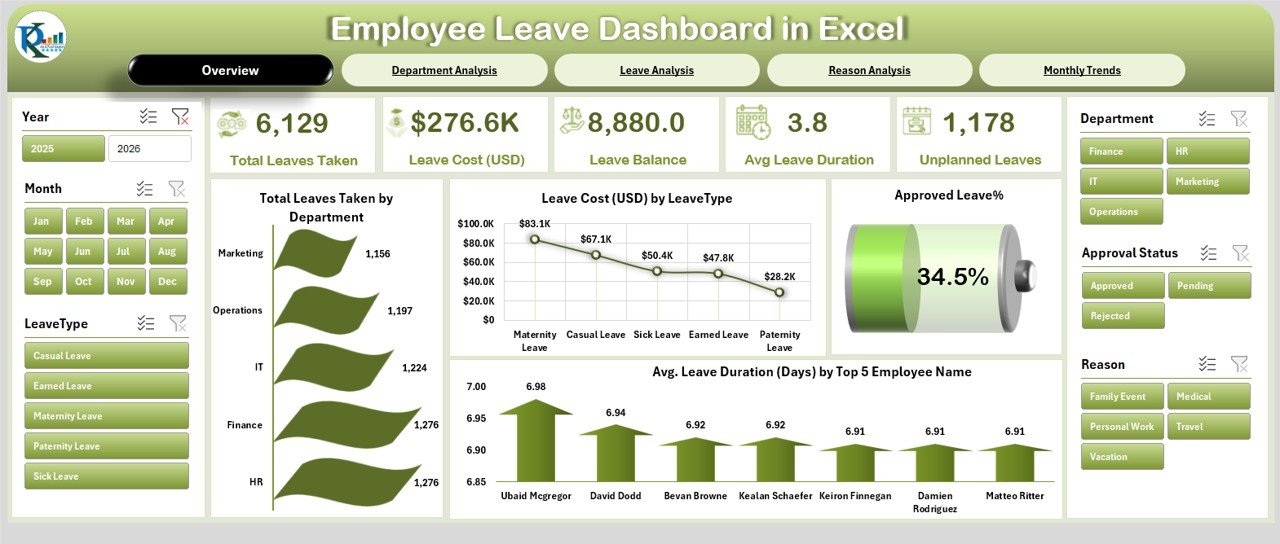
What it is: a ready-built Excel dashboard that turns a simple leave log into absence rate, average duration and leave-cost charts.
Who it is for: HR generalists and small-business owners who live in Excel and want absenteeism reporting without a formula project.
- Auto-calculates absence rate and average duration per employee
- Leave cost in USD by leave type
- Approved vs unplanned leave split — the exact separation metric #1 needs
- Top-absence employee ranking for Bradford follow-up
- Works offline in Excel 2016 and later
Load a 200-row leave log and you immediately see, say, a 2.8% absence rate concentrated in two departments and an $8,880 leave-cost balance — the same view HR teams pay analysts to build. It maps directly to the absenteeism rate, average duration and cost metrics above.
Price: $17.99. Get the Employee Leave Dashboard in Excel.
Best for: the single best starting point if you track absence in Excel.
2. Attendance Management System – Lite — best for daily capture
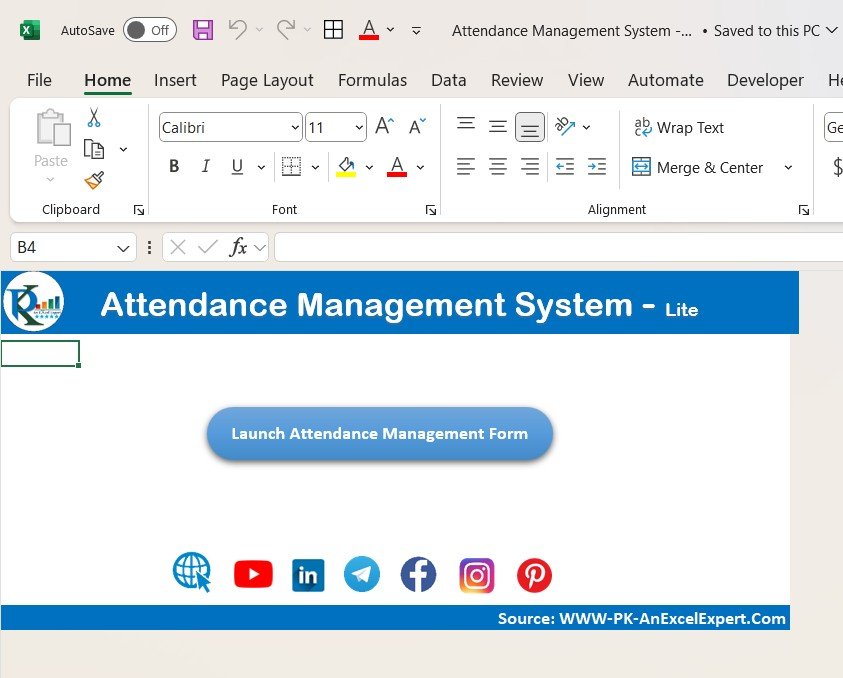
What it is: a VBA-driven Excel system for marking daily attendance and generating attendance-rate and absence summaries.
Who it is for: team leads who need a fast present/absent/late capture screen feeding a live attendance rate.
- One-click daily attendance marking
- Automatic attendance rate and absence count per employee
- Late and half-day handling so partial days don’t inflate the rate (metric #2’s trap)
- Month and employee filters for Bradford-style pattern spotting
Because it captures the raw present/absent event, it is the cleanest source for both attendance rate and the Bradford Factor. Use it as the data engine and feed the dashboards for reporting.
Price: $19.99. Get the Attendance Management System – Lite.
Best for: daily attendance capture and accurate attendance-rate data.
3. Employee Leave Dashboard in Power BI — best for multi-department roll-up
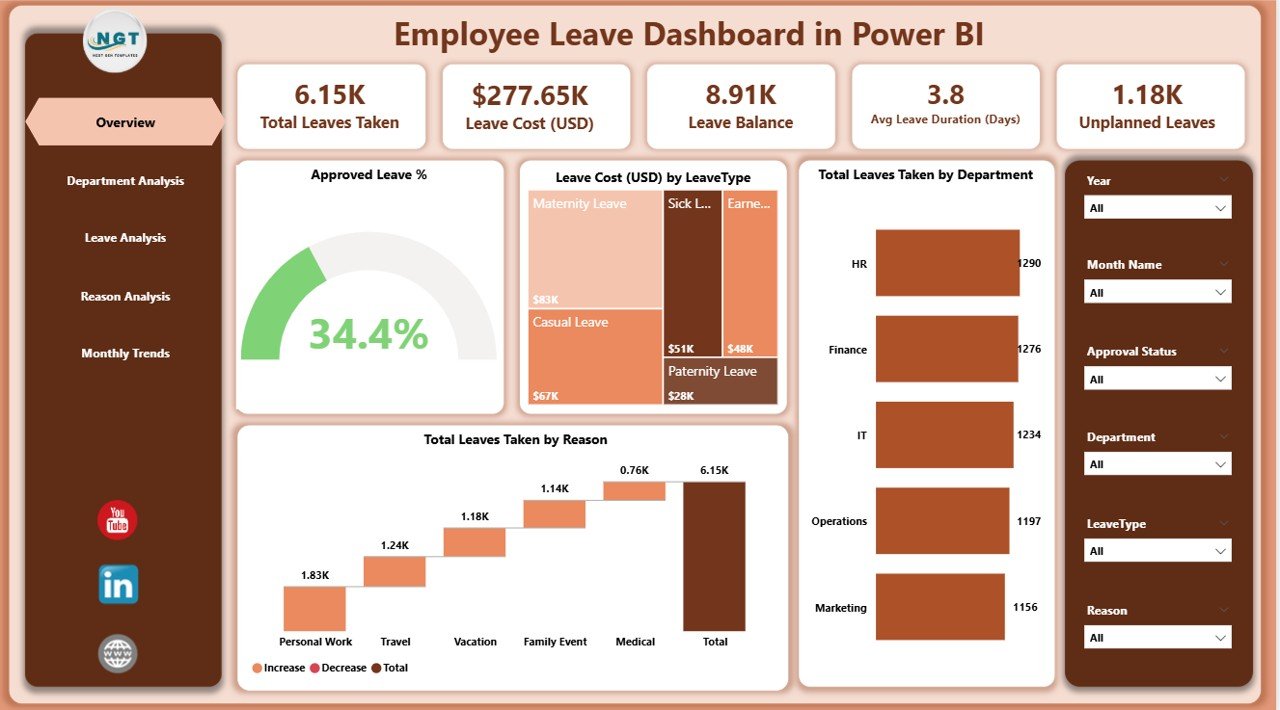
What it is: the Power BI twin of pick #1, built for slicing absence across departments, sites and managers.
Who it is for: HR analysts in larger organisations who need interactive absence roll-ups and DAX-ready measures.
- Absence rate and average duration as reusable DAX measures
- Department, location and manager slicers
- Trend visuals for rolling 12-month absenteeism
- Drill-through from company total to individual employee
When you have 300+ employees, average duration and absenteeism rate only mean something once you can slice them — this dashboard does that in a click, which is why it owns the average-duration metric.
Price: $17.99. Get the Employee Leave Dashboard in Power BI.
Best for: multi-department absence analytics.
4. Office Event Attendance Dashboard in Excel — best value

What it is: an Excel dashboard for tracking attendance across meetings, training and events rather than daily shifts.
Who it is for: L&D, operations and office managers measuring turnout and no-shows.
- Event-level attendance rate and no-show percentage
- Repeat-absentee tracking across sessions
- Unplanned absence flag — direct input to metric #7
- Clean charts you can drop into a board pack
At $17.99 with full charting and the unplanned-absence flag built in, it is the best value on this list for anyone whose “attendance” means events, not clock-ins.
Price: $17.99. Get the Office Event Attendance Dashboard in Excel.
Best for: event and meeting attendance on a budget.
5. Leave Application Management System — best for absence workflow
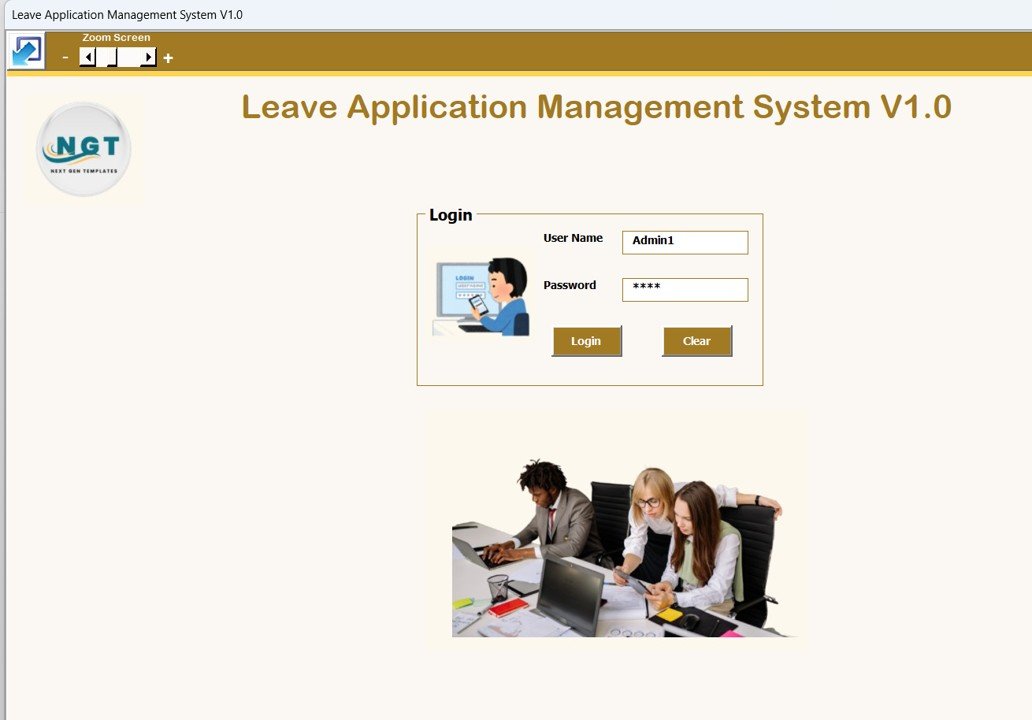
What it is: an Excel VBA system that captures leave requests, routes approvals and logs every spell.
Who it is for: teams that want the absence record created correctly at source, so the frequency metric is trustworthy.
- Structured leave request and approval flow
- Automatic spell counting for absence frequency (metric #4)
- Planned vs unplanned tagging at the point of request
- Employee leave history in one click
Because it records each discrete spell with a planned/unplanned tag, it produces the cleanest absence-frequency and unplanned-rate data of any tool here.
Price: $19.99. Get the Leave Application Management System.
Best for: absence request and approval workflow.
6. Shift Scheduling Management System — best for shift coverage
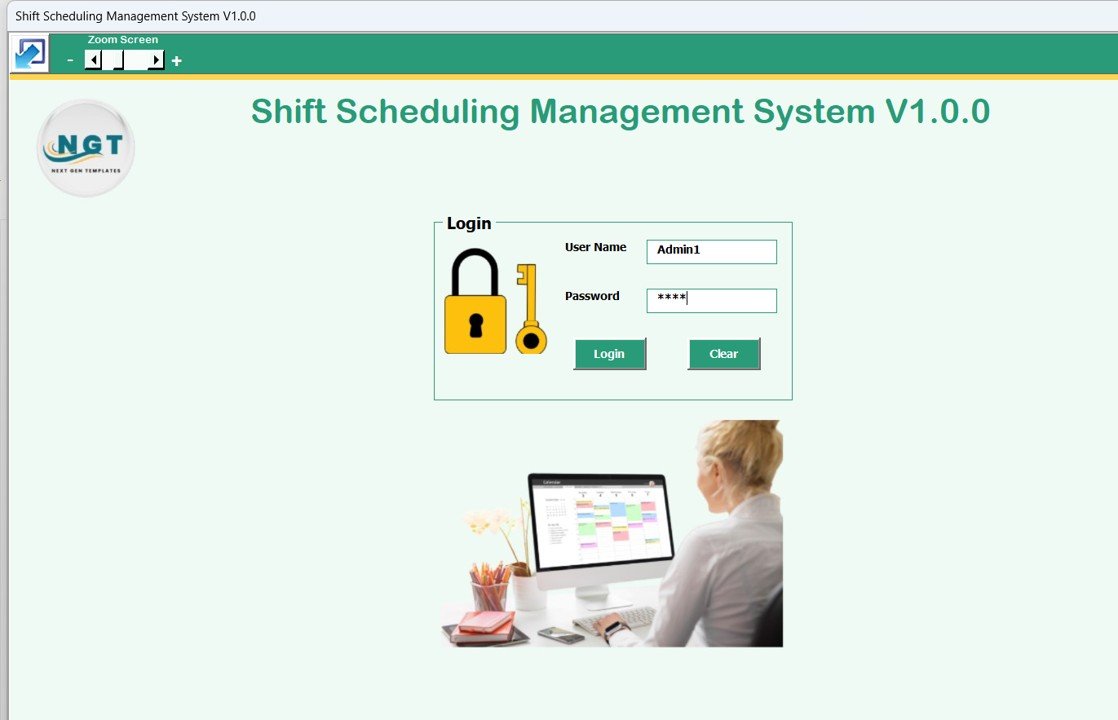
What it is: a VBA rostering system that plans shifts and exposes coverage gaps when someone is absent.
Who it is for: retail, hospitality and manufacturing schedulers who measure absence in hours, not days.
- Shift-level scheduling with hours per employee
- Coverage and gap view when absence hits
- Hours-based data ideal for the lost time rate (metric #5)
- Overtime visibility that feeds the cost of absenteeism
Shift work is exactly where “days” break down; this system tracks hours, making it the right home for lost time rate and the overtime side of absence cost.
Price: $19.99. Get the Shift Scheduling Management System.
Best for: roster coverage and hours-based lost time.
7. Leave Balance Adjustment Management System — best for balance accuracy
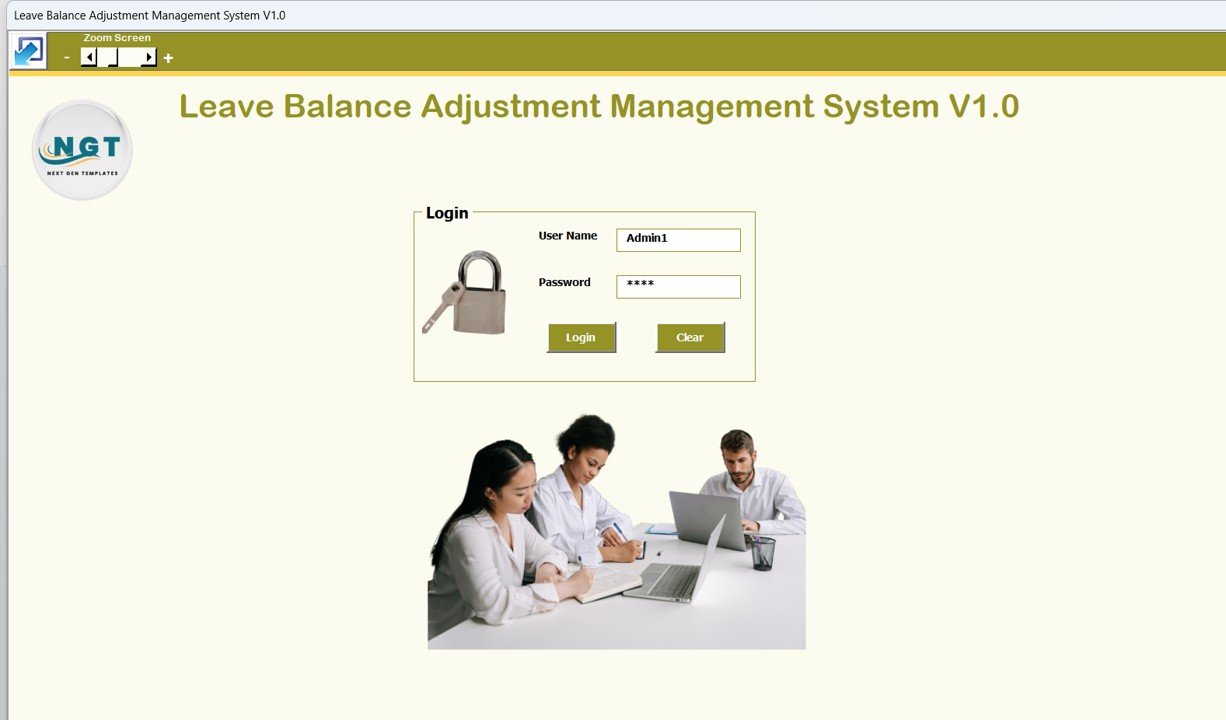
What it is: an Excel VBA tool for accruals, adjustments and carry-over so every leave balance is correct.
Who it is for: HR admins whose absenteeism numbers are only as good as the balances underneath them.
- Automated accrual and carry-over calculations
- Manual adjustment log with audit trail
- Accurate entitlement that keeps the absenteeism rate denominator honest
- Per-employee balance history
Garbage balances produce garbage absence rates. This system keeps entitlements clean, which is why it underpins a trustworthy absenteeism rate calculation.
Price: $19.99. Get the Leave Balance Adjustment Management System.
Best for: accurate leave balances feeding your metrics.
8. Office Event Attendance Dashboard in Power BI — best for interactive analytics
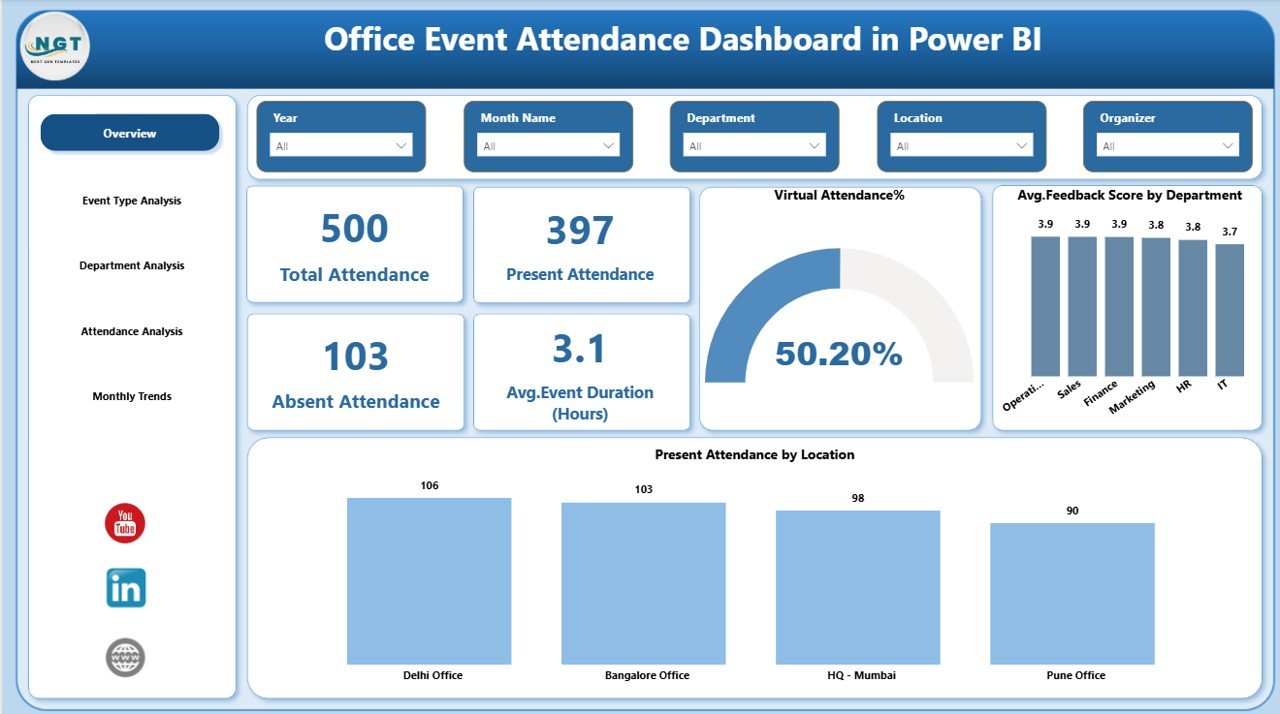
What it is: the Power BI version of pick #4, for teams that want fully interactive attendance analytics.
Who it is for: analysts presenting event and programme attendance to leadership.
- Interactive slicers by event, department and date
- Attendance rate and no-show trends over time
- Drill-through to individual attendee history
- Refreshable from Excel or CSV source data
If you already run Power BI, this gives you the unplanned-absence and attendance-rate story in a format leadership can click through themselves.
Price: $17.99. Get the Office Event Attendance Dashboard in Power BI.
Best for: interactive attendance analytics.
How to choose between them
| If you need to… | Start with | Format |
|---|---|---|
| Report absence rate, duration and cost fast | Employee Leave Dashboard | Excel |
| Capture daily attendance and attendance rate | Attendance Management System – Lite | Excel VBA |
| Slice absence across many departments | Employee Leave Dashboard | Power BI |
| Measure event and meeting turnout | Office Event Attendance Dashboard | Excel / Power BI |
| Fix absence frequency at the request stage | Leave Application Management System | Excel VBA |
| Track lost time in a shift environment | Shift Scheduling Management System | Excel VBA |
Rule of thumb: buy the dashboard in the format you present in, and the management system in the format you capture data in. Many NGT customers run the Attendance Management System as the engine and an Employee Leave Dashboard for reporting. If you also run payroll in-house, pair these with the payroll calculation in Excel template so absence and pay stay in sync, and see our HR dashboard format comparison before you commit to Excel, Sheets or Power BI.
When a template is NOT the right answer
A spreadsheet template is the right tool for teams up to a few hundred people who want control and zero per-seat cost. It is the wrong tool in three cases. First, if you have 1,000+ employees across time zones with self-service portals and payroll integration, buy a dedicated HRIS — a workbook will not scale to that. Second, if local law requires biometric or tamper-proof time records, you need certified time-and-attendance hardware and software, not Excel. Third, if nobody owns the weekly update, no template will save you; the absenteeism rate calculation only works when someone runs it on fresh data. For a longer look at when spreadsheets replace an HRIS and when they don’t, read our guide to attendance tracker templates that replace your HRIS. Being honest about these limits is why buyers trust our picks — and why refund rates stay low.
Frequently asked questions
What is the absenteeism rate calculation?
The absenteeism rate calculation is (total days absent ÷ total scheduled workdays) × 100 for a chosen period. If 12 people miss a combined 40 days out of 1,600 scheduled workdays, the absenteeism rate is 2.5%. Separate planned leave from unplanned absence before you calculate for a meaningful number.
What is a good absenteeism rate?
Total absenteeism under 2% is strong, and US private-sector absence averages about 3.2% according to the Bureau of Labor Statistics. More important than the headline figure is the unscheduled portion: keep unplanned absence under 1.5%, because that is the absence that forces last-minute cover and overtime.
How is the Bradford Factor calculated?
The Bradford Factor is S² × D, where S is the number of separate absence spells and D is the total days absent over a rolling 52 weeks. It deliberately penalises frequent short absences: ten one-day absences score 1,000, while one ten-day absence scores just 10. Scores above 125 usually prompt a formal review.
What is the difference between absenteeism rate and attendance rate?
They are mirror images. Attendance rate is (days worked ÷ scheduled days) × 100 and rises when people show up; absenteeism rate is (days absent ÷ scheduled days) × 100 and rises when they don’t. If attendance rate is 96%, absenteeism-related absence is roughly 4%. Track both so partial days don’t hide in either figure.
How do you calculate the cost of absenteeism?
Multiply absent days by the average daily wage, then add replacement or overtime cost and estimated lost productivity. The wage alone understates it badly — the expensive part is the cover you pay to keep work moving. US estimates land between roughly $1,685 and $3,600 per employee per year once all three components are included.
What counts as unplanned absence?
Unplanned or unscheduled absence is any time off taken with little or no notice — same-day sick calls, no-shows and emergencies. Pre-approved holiday, booked medical appointments and scheduled leave do not count. Only unplanned absence should drive coverage and overtime planning, so tag it separately at the point the absence is recorded.
Which Excel template calculates absenteeism metrics automatically?
The Employee Leave Dashboard in Excel ($17.99) auto-calculates absence rate, average duration and leave cost from a simple leave log, while the Attendance Management System – Lite ($19.99) computes attendance rate and supports Bradford-style pattern spotting. Both work offline in Excel 2016 or later.
How often should I measure these attendance metrics?
Calculate absenteeism rate, attendance rate and unplanned absence monthly for trend spotting, and review the Bradford Factor on a rolling 52-week basis so seasonal spikes don’t distort it. Cost of absenteeism is best reviewed quarterly, when you can pair it with overtime and temp-cover spend for a full financial picture.
Can I track attendance in Power BI instead of Excel?
Yes. The Employee Leave Dashboard in Power BI and the Office Event Attendance Dashboard in Power BI (both $17.99) deliver the same metrics as their Excel twins with interactive slicers and drill-through. Choose Power BI when you need to roll absence up across many departments or present clickable reports to leadership.
What is the biggest mistake in tracking absenteeism?
Mixing planned leave into the absenteeism rate. Vacation and public holidays are scheduled and shouldn’t count as “absence,” yet lumping them in inflates the rate and buries the unplanned absence that actually hurts. Always split planned from unplanned before you calculate — every template on this page does it for you.
Get more attendance & HR templates
Track the metric, then fix it. The fastest start is the Employee Leave Dashboard in Excel at $17.99 for reporting, paired with the Attendance Management System – Lite at $19.99 for capture — under $40 for a complete absenteeism tracking stack. For wider HR reporting, explore our employee satisfaction dashboards and corporate compliance dashboards, and see how these metrics compare to production tracking in our OEE and downtime metrics guide. Prefer to watch it built? Subscribe on YouTube @NextGenTemplates for step-by-step template walkthroughs.
Authoritative benchmark data in this guide draws on the US Bureau of Labor Statistics absence figures.