

The best startup reporting stack templates give you enterprise-grade dashboards — MRR, burn rate, CAC and runway — for a one-time $4.99–$14.99 each, not a per-seat SaaS bill. This guide ranks 10 Excel, Google Sheets, Power BI and HTML templates and shows the exact bundle-vs-single maths so you buy only the stack you need.
Last updated: September 2026
Key takeaways
- A complete startup reporting stack of 10 templates costs $111.90 bought individually — less than one month of a single enterprise BI seat.
- The Startup Growth KPI Dashboard in Power BI ($11.99) is our best overall pick: MRR, CAC, CLTV and runway in one refreshable model.
- Cash is the number investors ask first — the Startup Burn Rate Dashboard in HTML ($12.99) tracks burn and runway with zero software to install.
- A pre-seed founder needs four templates, not ten: a realistic core stack runs about $37.96 one-time.
- Every template here is a one-time purchase with lifetime use — no per-user fees, no annual renewal, no vendor lock-in.
Startup reporting stack templates compared
| Template | Format | Best for | Price |
|---|---|---|---|
| Startup Growth KPI Dashboard (Best overall) | Power BI | Board & investor reporting | $11.99 |
| Startup Burn Rate Dashboard | HTML | Cash runway & burn | $12.99 |
| Startup Growth KPI Dashboard (Best value) | Google Sheets | Free-tier, no-license teams | $9.99 |
| Sales KPI Scorecard | Google Sheets | Revenue & pipeline teams | $9.99 |
| Startup Hubs KPI Dashboard | Excel | Accelerators & portfolios | $14.99 |
| Agri Tech Startups KPI Dashboard | Power BI | Agri-tech sector metrics | $11.99 |
| Agri Tech Startups KPI Dashboard | Excel | Agri-tech, offline teams | $14.99 |
| Travel Tech Startups KPI Dashboard | Excel | Travel-tech sector metrics | $14.99 |
| Finance Sales Supply Chain Resilience Calendar | Excel | Operating cadence | $4.99 |
| Finance Sales Remote Work Calendar | Excel | Cheapest entry point | $4.99 |
The full pricing table for a startup reporting stack
Enterprise reporting is priced per seat, per month, forever. A startup reporting stack of templates is priced once. Here is every template in this guide with its format, the reporting job it does, and its one-time price — nothing hidden, no “contact sales”.
| # | Template | Reporting job | Format | One-time price |
|---|---|---|---|---|
| 1 | Startup Growth KPI Dashboard | Growth, MRR, CAC, CLTV, runway | Power BI | $11.99 |
| 2 | Startup Burn Rate Dashboard | Burn, runway, cash months left | HTML | $12.99 |
| 3 | Startup Growth KPI Dashboard | Same model, no BI license | Google Sheets | $9.99 |
| 4 | Sales KPI Scorecard | Quota, win rate, pipeline coverage | Google Sheets | $9.99 |
| 5 | Startup Hubs KPI Dashboard | Portfolio & cohort reporting | Excel | $14.99 |
| 6 | Agri Tech Startups KPI Dashboard | Agri-tech sector KPIs | Power BI | $11.99 |
| 7 | Agri Tech Startups KPI Dashboard | Agri-tech, offline edition | Excel | $14.99 |
| 8 | Travel Tech Startups KPI Dashboard | Travel-tech sector KPIs | Excel | $14.99 |
| 9 | Finance Sales Supply Chain Resilience Calendar | Risk & resilience cadence | Excel | $4.99 |
| 10 | Finance Sales Remote Work Calendar | Remote operating rhythm | Excel | $4.99 |
| Full 10-template stack, bought individually | $111.90 |
Bundle vs single: the maths that actually matters
Two questions decide your spend: how many of these ten you actually need, and how that total compares to paying for enterprise reporting software. Both have honest answers.
Single templates vs the whole stack
You almost never need all ten. The three sector dashboards (agri-tech, travel-tech) and the duplicate-format editions exist so different founders self-select — they are not a checklist. A worked example of a realistic pre-seed stack:
- Startup Growth KPI Dashboard (Google Sheets) — $9.99
- Startup Burn Rate Dashboard (HTML) — $12.99
- Sales KPI Scorecard (Google Sheets) — $9.99
- Finance Sales Remote Work Calendar (Excel) — $4.99
Core stack total: $37.96, one-time. That is your MRR-and-growth view, your cash-runway view, your revenue view and your operating cadence — the four reports a seed investor will ask for — for less than $40, paid once, owned forever.
The stack vs enterprise reporting software
Now the comparison that makes this a money page. Enterprise reporting is a per-seat subscription. Microsoft’s published Power BI Pro price is $14 per user, per month; Tableau Creator lists at roughly $75 per user, per month; a dedicated FP&A platform such as Cube or Mosaic runs into four figures a year before a single dashboard is built.
Put a five-person startup on Power BI Pro and you pay $14 × 5 × 12 = $840 in year one — and $840 again every year after. The full 10-template stack is $111.90, once. Even the four-template core stack at $37.96 is under 5% of one year of a single BI subscription. You trade automatic live connectors for a spreadsheet you refresh yourself — a fair trade at pre-seed, a bad one at Series B. That crossover is the whole decision, and we spell it out in the honest-limits section below.
How we picked these
We searched the full NextGenTemplates catalogue of 400-plus paid templates for the reports a startup actually presents to a board or an investor: growth, unit economics, burn, runway, sales performance and operating cadence. We kept only paid, self-contained dashboards priced between $4.99 and $14.99, covered every format a lean team might already live in — Excel, Google Sheets, Power BI and HTML — and excluded anything requiring a paid connector or a subscription to function. The ranking weights breadth of investor-facing KPIs first, then format flexibility, then price.
The 10 best startup reporting stack templates for 2026
1. Startup Growth KPI Dashboard in Power BI — best overall
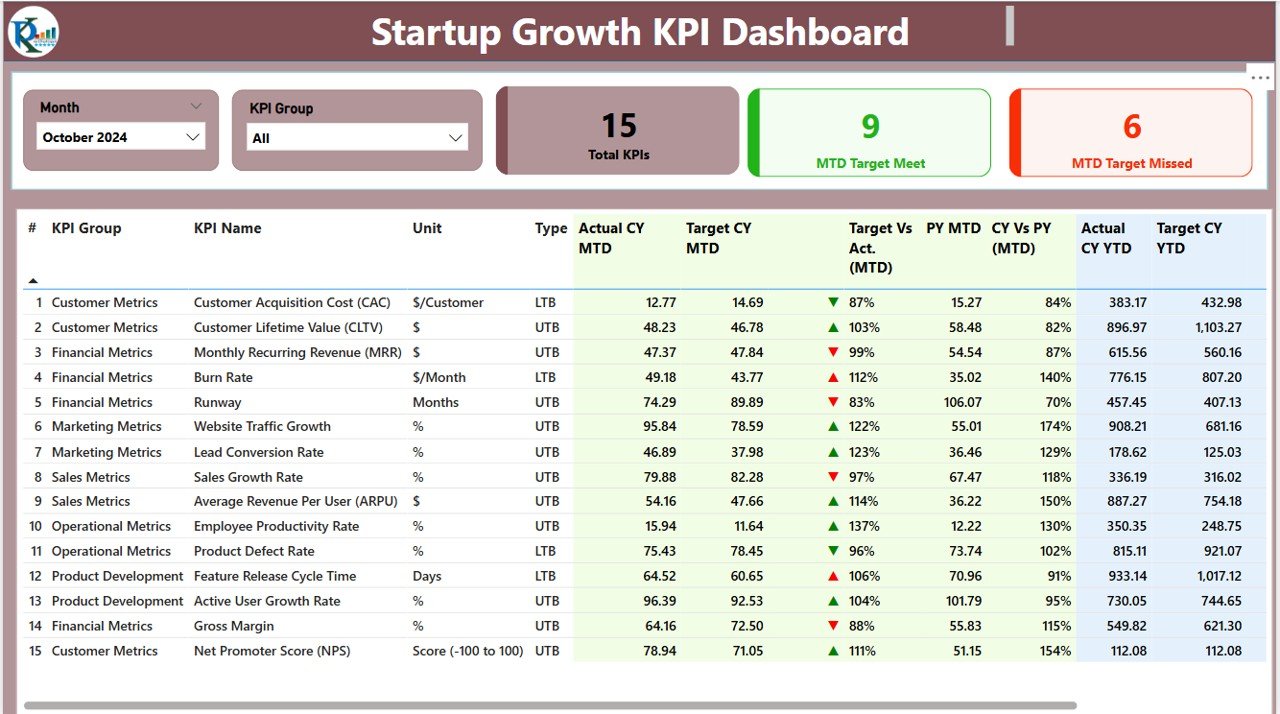
What it is: a single-pane board dashboard covering the metrics investors score you on — MRR, CAC, CLTV, growth rate and runway — in a refreshable Power BI model.
Who it is for: founders and operators who want one authoritative report the whole board reads the same way.
What is inside:
- MTD vs target and CY-vs-PY comparison for 15 startup KPIs
- Customer Acquisition Cost, Lifetime Value and the LTV:CAC ratio
- Monthly Recurring Revenue, growth rate and Net Promoter Score
- A month slicer and KPI-group filter for board-ready slides
Use it to show a 15% MoM growth trend, prove your LTV:CAC cleared 3:1, or flag the month your runway drops below nine. It is the anchor of the stack because it is the report you present most often. Price: $11.99. Get the Startup Growth KPI Dashboard in Power BI.
Best for: the one dashboard your investors see every month.
2. Startup Burn Rate Dashboard in HTML — best for cash and runway
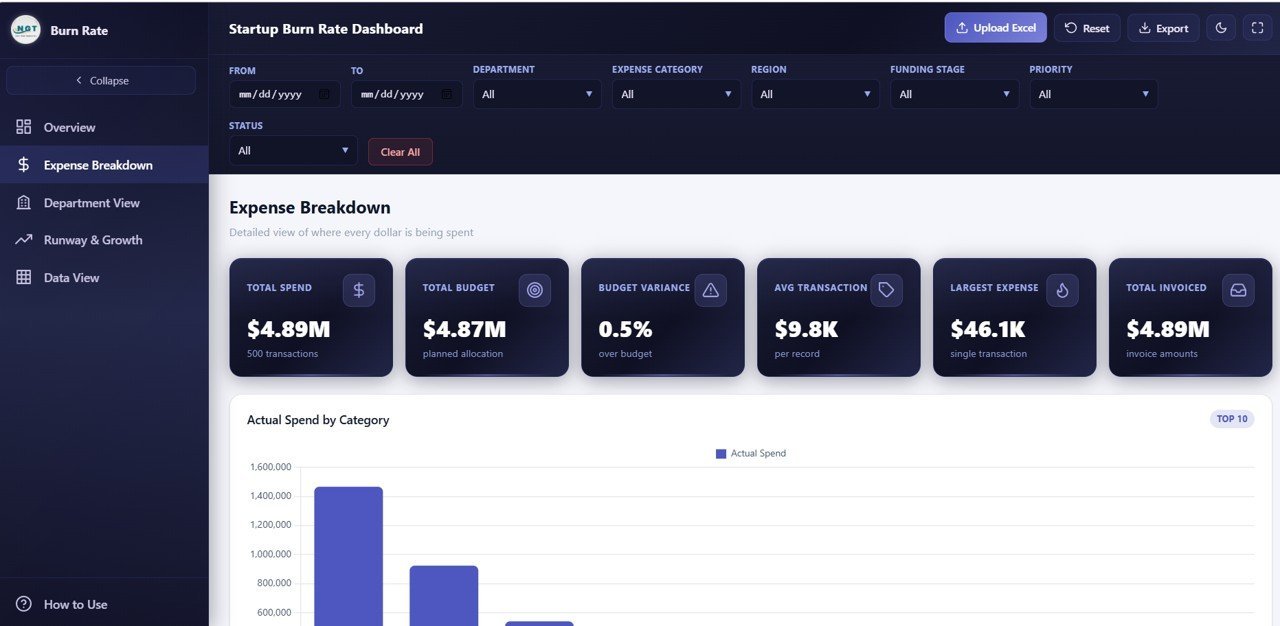
What it is: a self-contained HTML dashboard for gross burn, net burn and months of runway — opens in any browser, nothing to install.
Who it is for: any founder whose first investor question is “how long is your runway?”
What is inside:
- Gross and net monthly burn with a rolling trend
- Cash-in-bank and months-of-runway countdown
- Expense breakdown by category to find the fat
- A zero-dependency HTML file that runs offline or embeds anywhere
Model the runway impact of a new hire, watch net burn fall as revenue scales, or paste the runway number straight into a board deck. Cash is the one metric that ends companies, which is why this sits at number two. Price: $12.99. Get the Startup Burn Rate Dashboard in HTML.
Best for: the runway number, kept honest and always current.
Build your core stack for under $40. Growth, burn, sales and cadence — four templates, one-time from $4.99 each. Start with the Startup Growth KPI Dashboard ($11.99).
3. Startup Growth KPI Dashboard in Google Sheets — best value
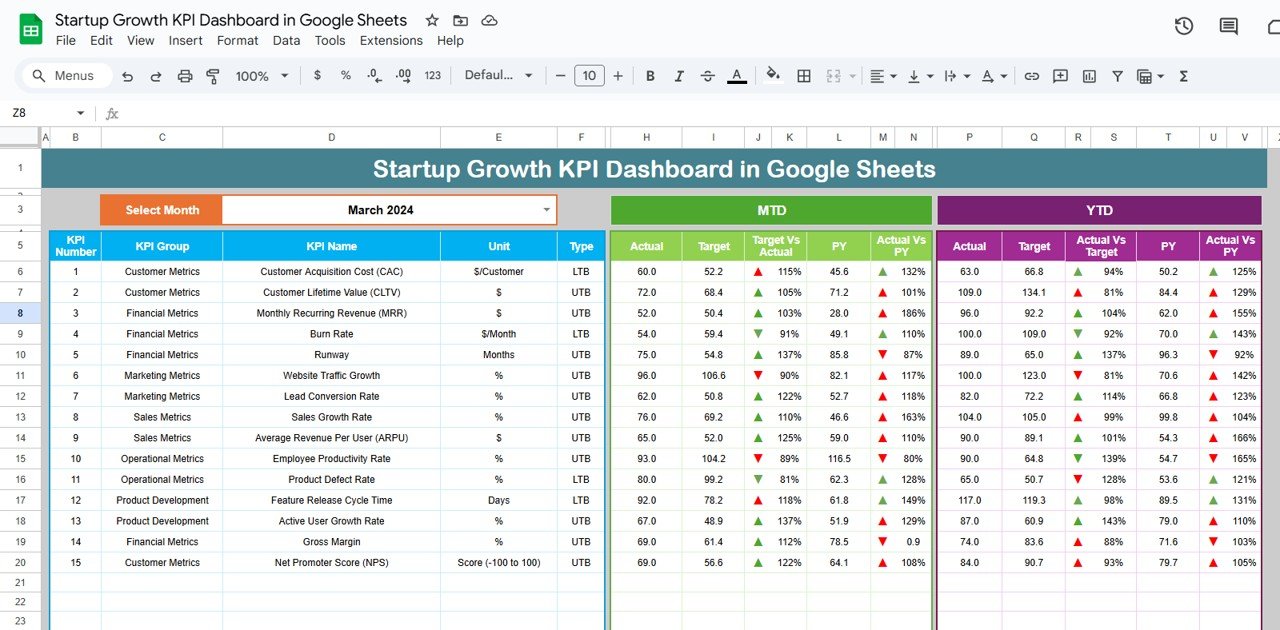
What it is: the same growth model as our number-one pick, rebuilt natively in Google Sheets so you need no Power BI licence at all.
Who it is for: lean, remote-first teams already living in Google Workspace.
What is inside:
- The full startup KPI set — MRR, CAC, CLTV, growth, NPS
- MTD-vs-target and year-on-year logic in plain formulas
- Shareable by link, editable by the whole team live
- Works on the free Google tier — genuinely $0 in software cost
At $9.99 with no licence behind it, this is the cheapest way to get board-grade growth reporting. Share it with a co-founder in another country and you are both editing the same live numbers within a minute. Price: $9.99. Get the Startup Growth KPI Dashboard in Google Sheets.
Best for: the best growth reporting per dollar, no license required.
4. Sales KPI Scorecard in Google Sheets — best for revenue teams
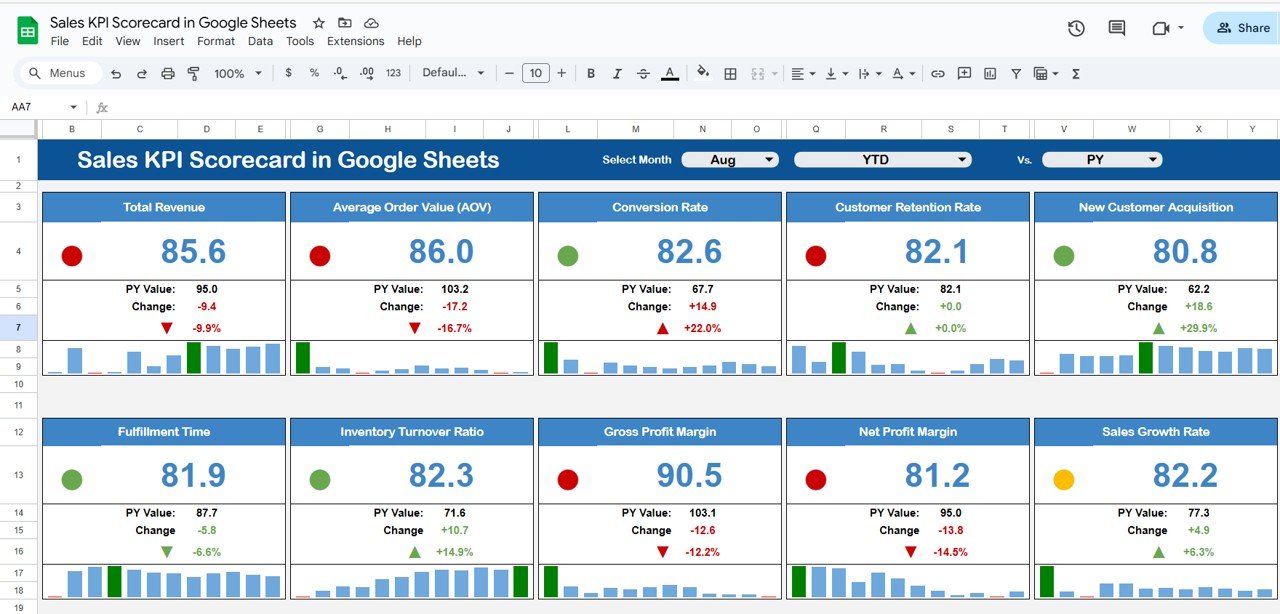
What it is: a scorecard for the revenue engine — quota attainment, win rate, pipeline coverage and rep performance.
Who it is for: founder-led sales and the first sales hires who need a number to stand behind.
What is inside:
- Quota vs actual by rep and by month
- Win rate, average deal size and sales-cycle length
- Pipeline coverage ratio against target
- Traffic-light scoring so a miss is obvious at a glance
Run a Monday pipeline review off it, spot the rep at 60% of quota before the quarter ends, or prove a 3x pipeline-coverage ratio to your board. It plugs into the growth dashboard as the revenue detail layer. Price: $9.99. Get the Sales KPI Scorecard in Google Sheets.
Best for: holding the sales number to account every week.
5. Startup Hubs KPI Dashboard in Excel — best for accelerators
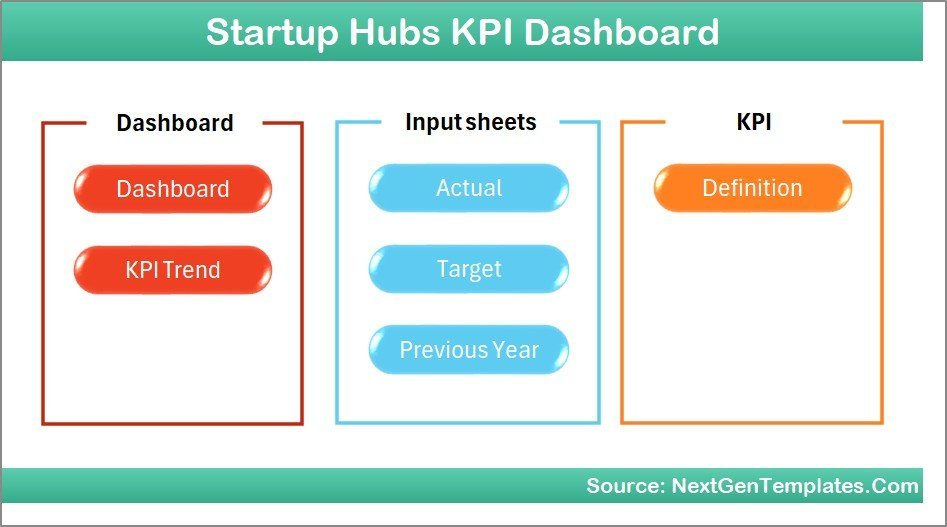
What it is: a portfolio-level dashboard for accelerators, incubators and studios reporting across many startups at once.
Who it is for: programme managers and fund operators who report on a cohort, not a single company.
What is inside:
- Cohort and portfolio roll-ups of core startup KPIs
- Cross-company comparison and ranking views
- Funding, survival and traction tracking by stage
- Standard Excel — no add-ins, works offline
Use it to brief your LPs on cohort performance, spot the two portfolio companies burning fastest, or compare traction across a 20-startup batch on one page. It is the only template here built for the one-to-many reporting an accelerator lives on. Price: $14.99. Get the Startup Hubs KPI Dashboard in Excel.
Best for: reporting across a whole portfolio at once.
6. Agri Tech Startups KPI Dashboard in Power BI — sector fit
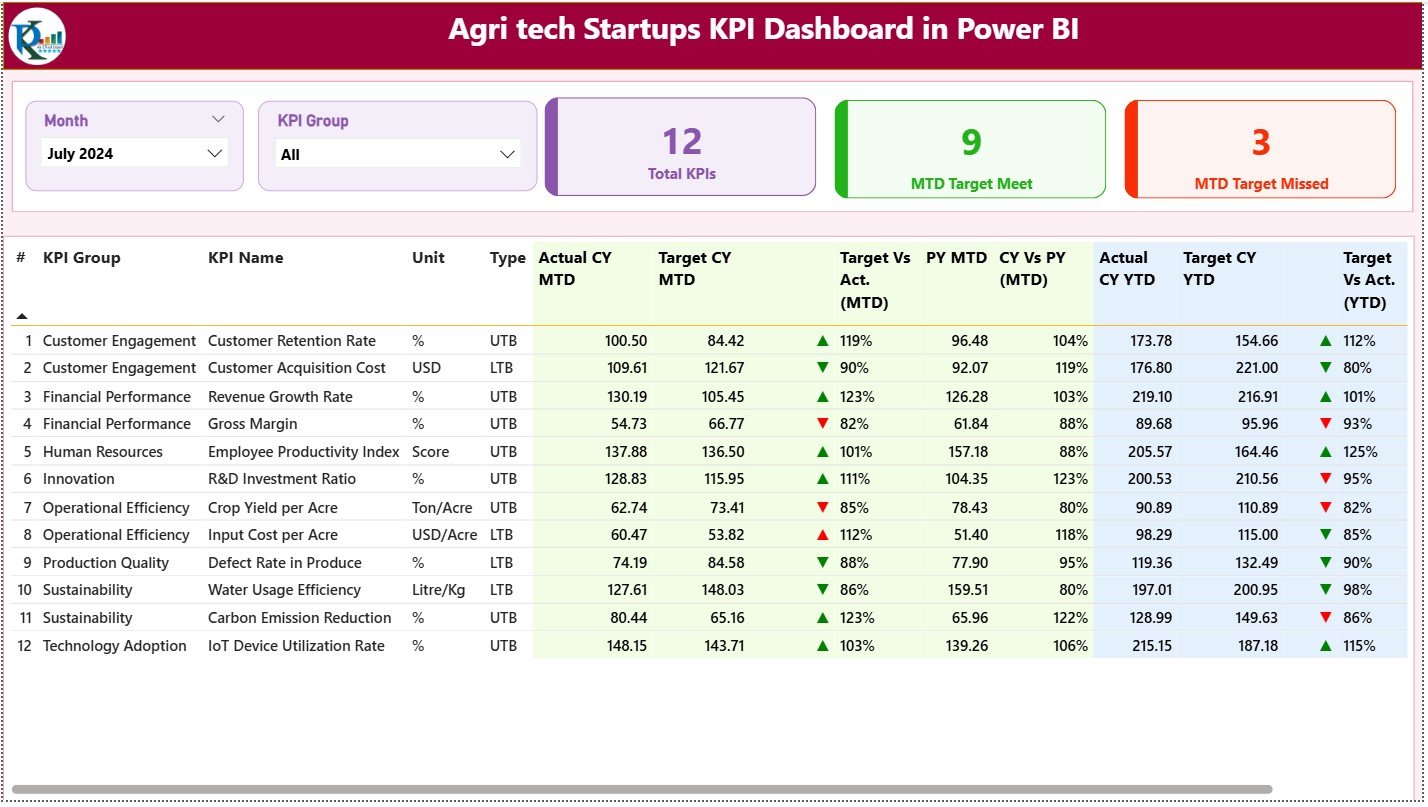
What it is: the startup growth model tuned for agri-tech — yield, adoption, unit economics and sustainability metrics in Power BI.
Who it is for: agri-tech founders whose investors want sector KPIs, not generic SaaS metrics.
What is inside:
- Agri-tech-specific KPIs alongside standard startup metrics
- Adoption, retention and revenue-per-account tracking
- Power BI slicers for region, crop or product line
- Board-ready visuals that refresh from your own data
Show acreage under management, farmer adoption curves and revenue per hectare in the language your agri-tech investors already speak. Price: $11.99. Get the Agri Tech Startups KPI Dashboard in Power BI.
Best for: agri-tech metrics in a live Power BI model.
7. Agri Tech Startups KPI Dashboard in Excel — the offline edition

What it is: the same agri-tech KPI coverage delivered in plain Excel for teams that never left the spreadsheet.
Who it is for: agri-tech operators in the field who need reporting that works offline and prints cleanly.
What is inside:
- Agri-tech KPIs in a self-contained Excel workbook
- Charts and summary tables ready for a board pack
- No add-ins, no internet dependency
- Editable formulas you can extend to your own data
Choose this over the Power BI edition when your team lives in Excel, works with patchy connectivity, or wants to print the pack for an in-person board meeting. Price: $14.99. Get the Agri Tech Startups KPI Dashboard in Excel.
Best for: agri-tech reporting with no software beyond Excel.
8. Travel Tech Startups KPI Dashboard in Excel — sector fit
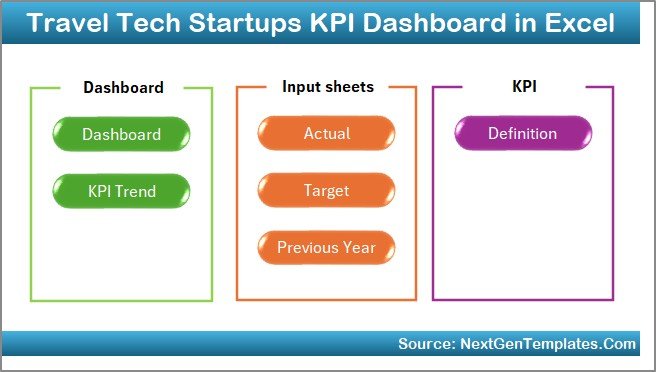
What it is: a startup KPI dashboard tuned for travel-tech — bookings, take rate, repeat rate and unit economics in Excel.
Who it is for: travel and mobility startups whose metrics do not fit a generic SaaS template.
What is inside:
- Bookings, gross booking value and take-rate tracking
- Repeat-booking and retention cohorts
- Standard startup KPIs (CAC, MRR, runway) alongside them
- Excel-native, offline, print-ready
Report gross booking value, the take rate on each transaction and the repeat rate that proves product-market fit — the numbers a travel-tech investor actually benchmarks. Price: $14.99. Get the Travel Tech Startups KPI Dashboard in Excel.
Best for: travel-tech bookings and take-rate reporting.
9. Finance Sales Supply Chain Resilience Calendar in Excel — operating cadence
What it is: a planning calendar that keeps finance, sales and supply-chain reviews on a fixed rhythm so reporting never slips.
Who it is for: operators who know that a dashboard nobody reviews on schedule is worthless.
What is inside:
- A structured cadence for finance and sales reviews
- Supply-chain and risk checkpoints across the year
- Colour-coded scheduling in plain Excel
- Editable to your own close and board calendar
Pair it with the dashboards above so your monthly close, pipeline review and risk check all happen on the same predictable dates. Reporting is a habit before it is a template. Price: $4.99. Get the Supply Chain Resilience Calendar.
Best for: keeping your reporting cadence from slipping.
10. Finance Sales Remote Work Calendar in Excel — cheapest entry point
What it is: a remote-team operating calendar that maps finance and sales rituals across a distributed workforce — the $4.99 way to add cadence to your stack.
Who it is for: remote-first startups coordinating reviews across time zones.
What is inside:
- Finance and sales rhythm laid out for remote teams
- Time-zone-friendly scheduling structure
- Plain Excel, no add-ins, instant to edit
- The lowest-cost template in the whole stack
At $4.99 it is the cheapest single purchase here and the easiest add-on: drop it on top of any dashboard to give a distributed team a shared reporting rhythm. Price: $4.99. Get the Remote Work Calendar.
Best for: a $4.99 cadence layer for remote teams.
How to choose between them
Match the template to the report you are missing, not the other way round:
- Need a board dashboard? Start with Startup Growth — Power BI if you present slides, Google Sheets if you share links.
- Investor asking about cash? Add the Startup Burn Rate Dashboard first.
- Running founder-led sales? The Sales KPI Scorecard is your weekly review.
- In agri-tech or travel-tech? Buy the sector dashboard instead of the generic one — not both.
- Reports keep slipping? A $4.99 calendar fixes the cadence, not another dashboard.
For a wider view of enterprise tools you are replacing, compare our Power BI Premium alternative templates and the Looker Studio alternative reporting templates.
When a startup reporting stack is NOT the right answer
These templates are the right call for most pre-seed and seed startups. They are the wrong call in four honest cases — do not buy this stack if:
- You need live, automatic data connectors. Templates are refreshed by you or a paste from your source system. If you require real-time pipelines from Stripe, a warehouse or a CRM without manual work, buy the BI subscription — that is what the per-seat fee pays for.
- You are past Series B with a data team. Once you employ analysts and run a warehouse, a governed BI platform beats spreadsheets on lineage, permissions and version control. The stack is a bridge to that, not a permanent home.
- Your metrics are wildly non-standard. Deep-tech, biotech or hardware startups with bespoke KPIs may spend more customising a template than building fresh. Compare against our Oracle Fusion alternative reporting templates before deciding.
- You will not maintain them. A dashboard nobody updates is worse than no dashboard, because it lies with confidence. If you cannot commit to a refresh cadence, start with the $4.99 calendar and build the habit first.
For ERP-scale reporting comparisons, our SAP alternative templates and NetSuite alternative templates cover where a spreadsheet stack stops being enough.
Frequently asked questions
What is a startup reporting stack?
A startup reporting stack is the small set of dashboards a startup uses to report its core metrics — growth, cash runway, sales and cadence — to founders, boards and investors. Using templates, the whole stack costs $4.99 to $14.99 per template instead of a monthly per-seat software subscription.
How much does a full startup reporting stack cost?
Bought individually, all 10 templates in this guide total $111.90 as a one-time purchase. Most startups need only a core stack of four — growth, burn, sales and a cadence calendar — which runs about $37.96, paid once and owned for life with no renewal.
Are these templates better than Power BI or Tableau?
For a pre-seed or seed startup, usually yes on cost: the stack is a one-time $111.90 versus $840-plus per year for five Power BI Pro seats. Enterprise BI wins when you need automatic live connectors, data governance and a dedicated analytics team — typically from Series B onward.
Which template should a pre-seed founder buy first?
Start with the Startup Growth KPI Dashboard, then add the Startup Burn Rate Dashboard. Together for about $22 to $25 they cover the two questions every early investor asks first: is the business growing, and how long is the runway. Add sales and cadence templates as the team grows.
Do I need both the Excel and Power BI versions?
No. The duplicate-format editions exist so you can pick the tool your team already uses — buy the Power BI version if you present live slides, or the Excel version if you work offline and print board packs. Buying both is only worth it if different teams genuinely use different tools.
Can I use these on the free Google Sheets tier?
Yes. The Google Sheets templates — the Startup Growth KPI Dashboard and the Sales KPI Scorecard — run entirely on the free Google Workspace tier. You pay once for the template and nothing for the software, which is why the Sheets editions are the best value in the stack.
How often should I update a startup reporting dashboard?
Monthly at minimum, aligned to your financial close, with a weekly refresh of the sales scorecard. The included finance and sales calendars exist to lock that cadence in. A dashboard reviewed on a fixed schedule is worth far more than a fancier one that goes stale.
Are the startup reporting stack templates a one-time purchase?
Yes. Every template here is bought once and used for life — no per-user fees, no annual renewal and no vendor lock-in. That one-time model is the core reason a startup reporting stack of templates undercuts enterprise reporting software so heavily over any multi-year horizon.
Do these dashboards work for agri-tech or travel-tech startups?
Yes — there are sector-specific editions. The Agri Tech Startups KPI Dashboard (Excel and Power BI) and the Travel Tech Startups KPI Dashboard in Excel carry the metrics investors in those sectors benchmark, such as adoption curves, gross booking value and take rate, alongside the standard startup KPIs.
Can I customise these templates to my own metrics?
Yes. Every template is built on editable formulas and standard Excel, Google Sheets, Power BI or HTML — no locked cells or proprietary add-ins. You can rename KPIs, add your own rows and rewire the calculations to match how your startup measures growth, burn and revenue.
Get more startup reporting templates
Build enterprise-grade reporting on a startup budget. The full 10-template stack is $111.90 bought individually, or start with the four-template core stack for about $37.96 — one-time, owned for life. Begin with the Startup Growth KPI Dashboard ($11.99) or the free-tier Google Sheets edition ($9.99).
Weighing up where to buy? Read Someka vs Vertex42 vs NextGenTemplates, and see the Shopify Analytics alternative reporting templates for e-commerce startups. Watch the dashboards in action on our YouTube channel: youtube.com/@NextGenTemplates.