

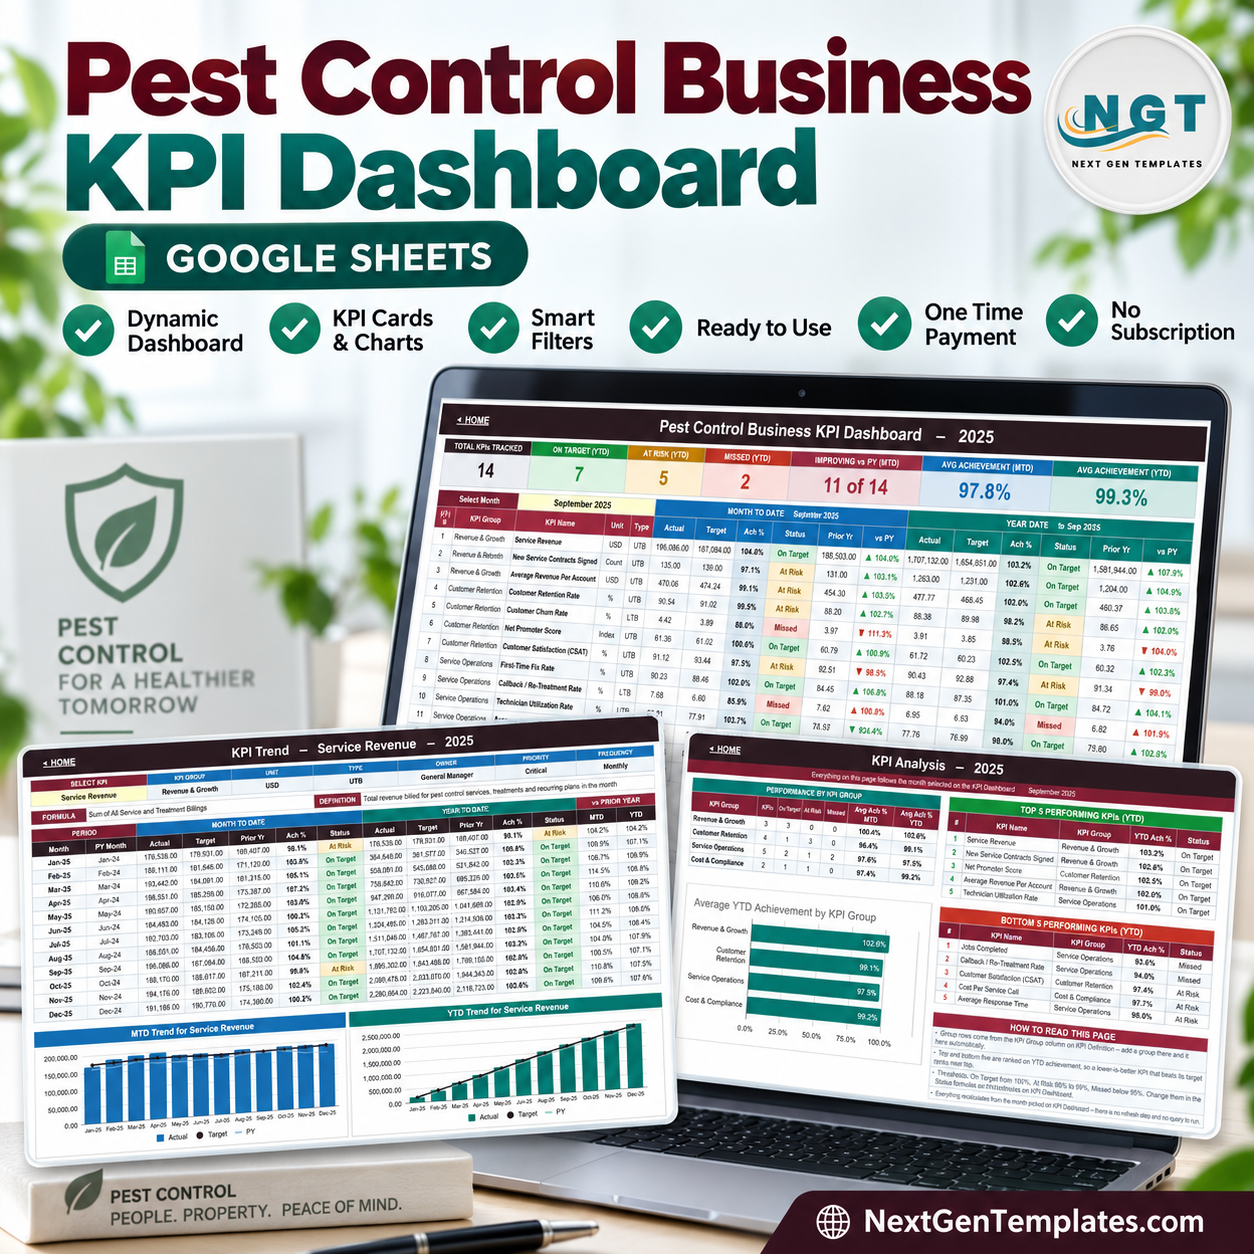

Track 14 pest control business KPIs across four operating groups in one formula-driven Google Sheets scorecard. The Pest Control Business KPI Dashboard in Google Sheets compares monthly and year-to-date actuals with targets and prior-year results, then classifies performance as On Target, At Risk, or Missed. It includes three editable monthly input areas, KPI trend charts, group analysis, and a definition library. The current sale price is a one-time $8.99, with no subscription or add-on required. Replace the demonstration figures with your own approved business data; if the template is not right for your workflow, review it before publication or customer use.
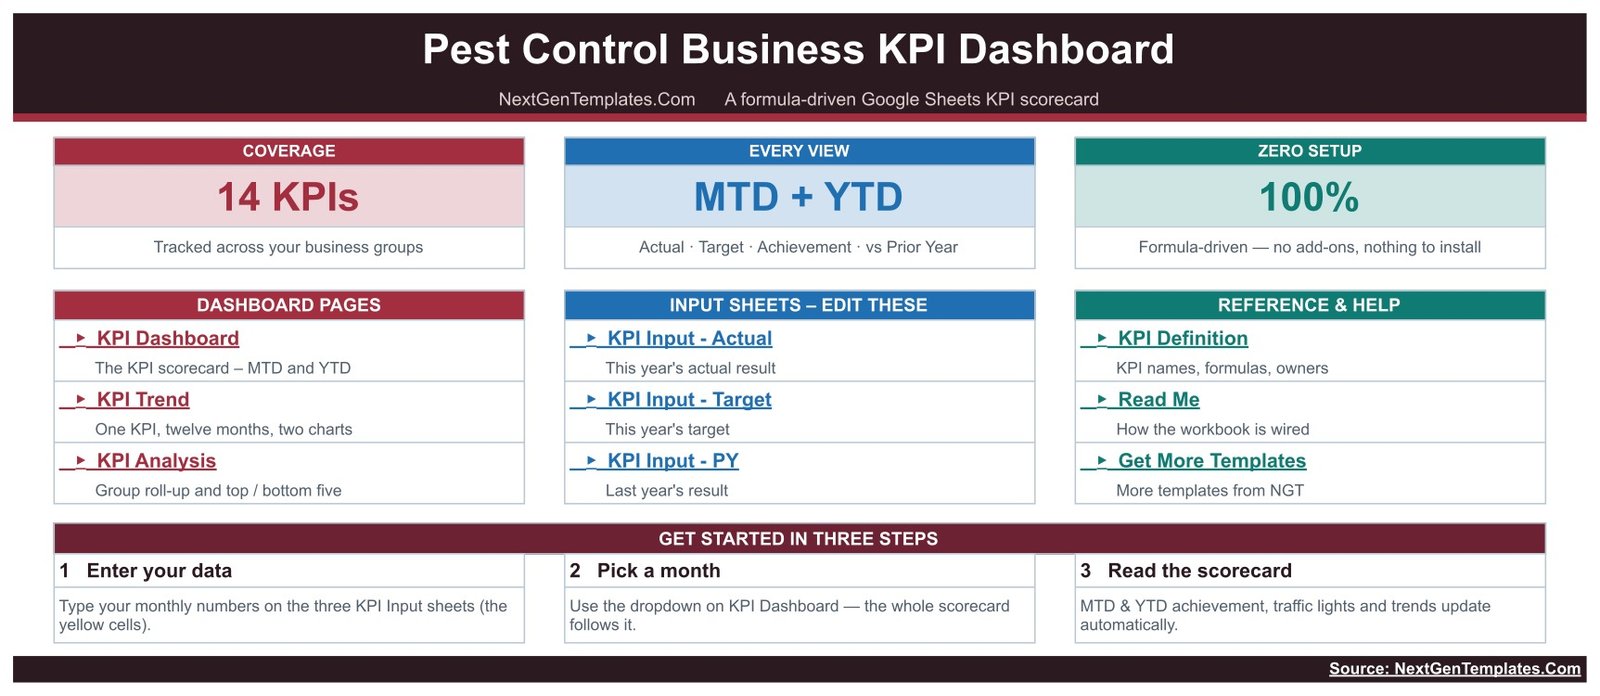
Overview of the formula-driven pest control KPI workbook
Key Features of Pest Control Business KPI Dashboard in Google Sheets
- 14 ready-made KPIs: monitor revenue, customer retention, service delivery, and cost-and-compliance activity.
- MTD and YTD views: see actual, target, achievement, status, prior-year result, and comparison with prior year.
- Month selector: choose a reporting month and let the scorecard and analysis pages follow it.
- Direction-aware scoring: upper-the-better and lower-the-better KPI types are handled separately.
- Traffic-light status: quickly separate On Target, At Risk, and Missed results.
- KPI trend page: inspect twelve months of actual, target, and prior-year performance for one selected KPI.
- Group analysis: compare average achievement by KPI group and review the top and bottom five performers.
- Editable definition master: maintain names, formulas, units, owners, priorities, frequency, and KPI direction.
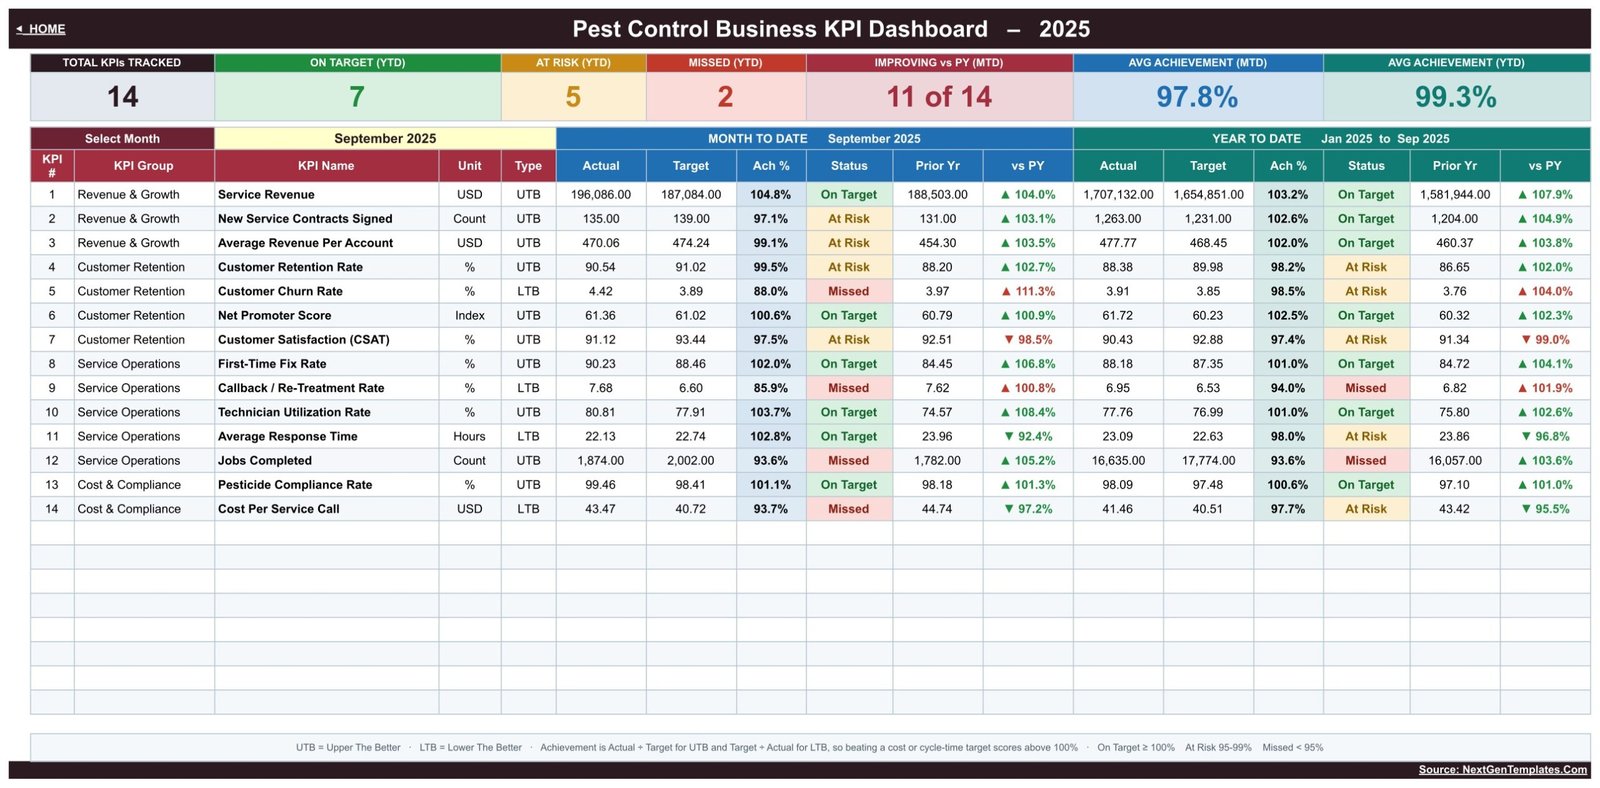
Monthly and year-to-date KPI scorecard
What’s Inside the Pest Control Business KPI Dashboard in Google Sheets
The main KPI Dashboard shows 14 records for the selected month. The sample build includes Service Revenue, New Service Contracts Signed, Average Revenue Per Account, Customer Retention Rate, Customer Churn Rate, Net Promoter Score, Customer Satisfaction, First-Time Fix Rate, Callback or Re-Treatment Rate, Technician Utilization Rate, Average Response Time, Jobs Completed, Pesticide Compliance Rate, and Cost Per Service Call. These are editable operational labels, not prescribed benchmarks.
The KPI Trend page presents one selected metric over twelve months, including month-to-date and cumulative year-to-date tables plus two charts. The KPI Analysis page rolls performance into Revenue & Growth, Customer Retention, Service Operations, and Cost & Compliance, then ranks the five strongest and five weakest YTD results. Three input areas hold current-year actuals, targets, and previous-year numbers. The KPI Definition master controls formula text, definition, unit, owner, priority, frequency, and whether higher or lower is better.
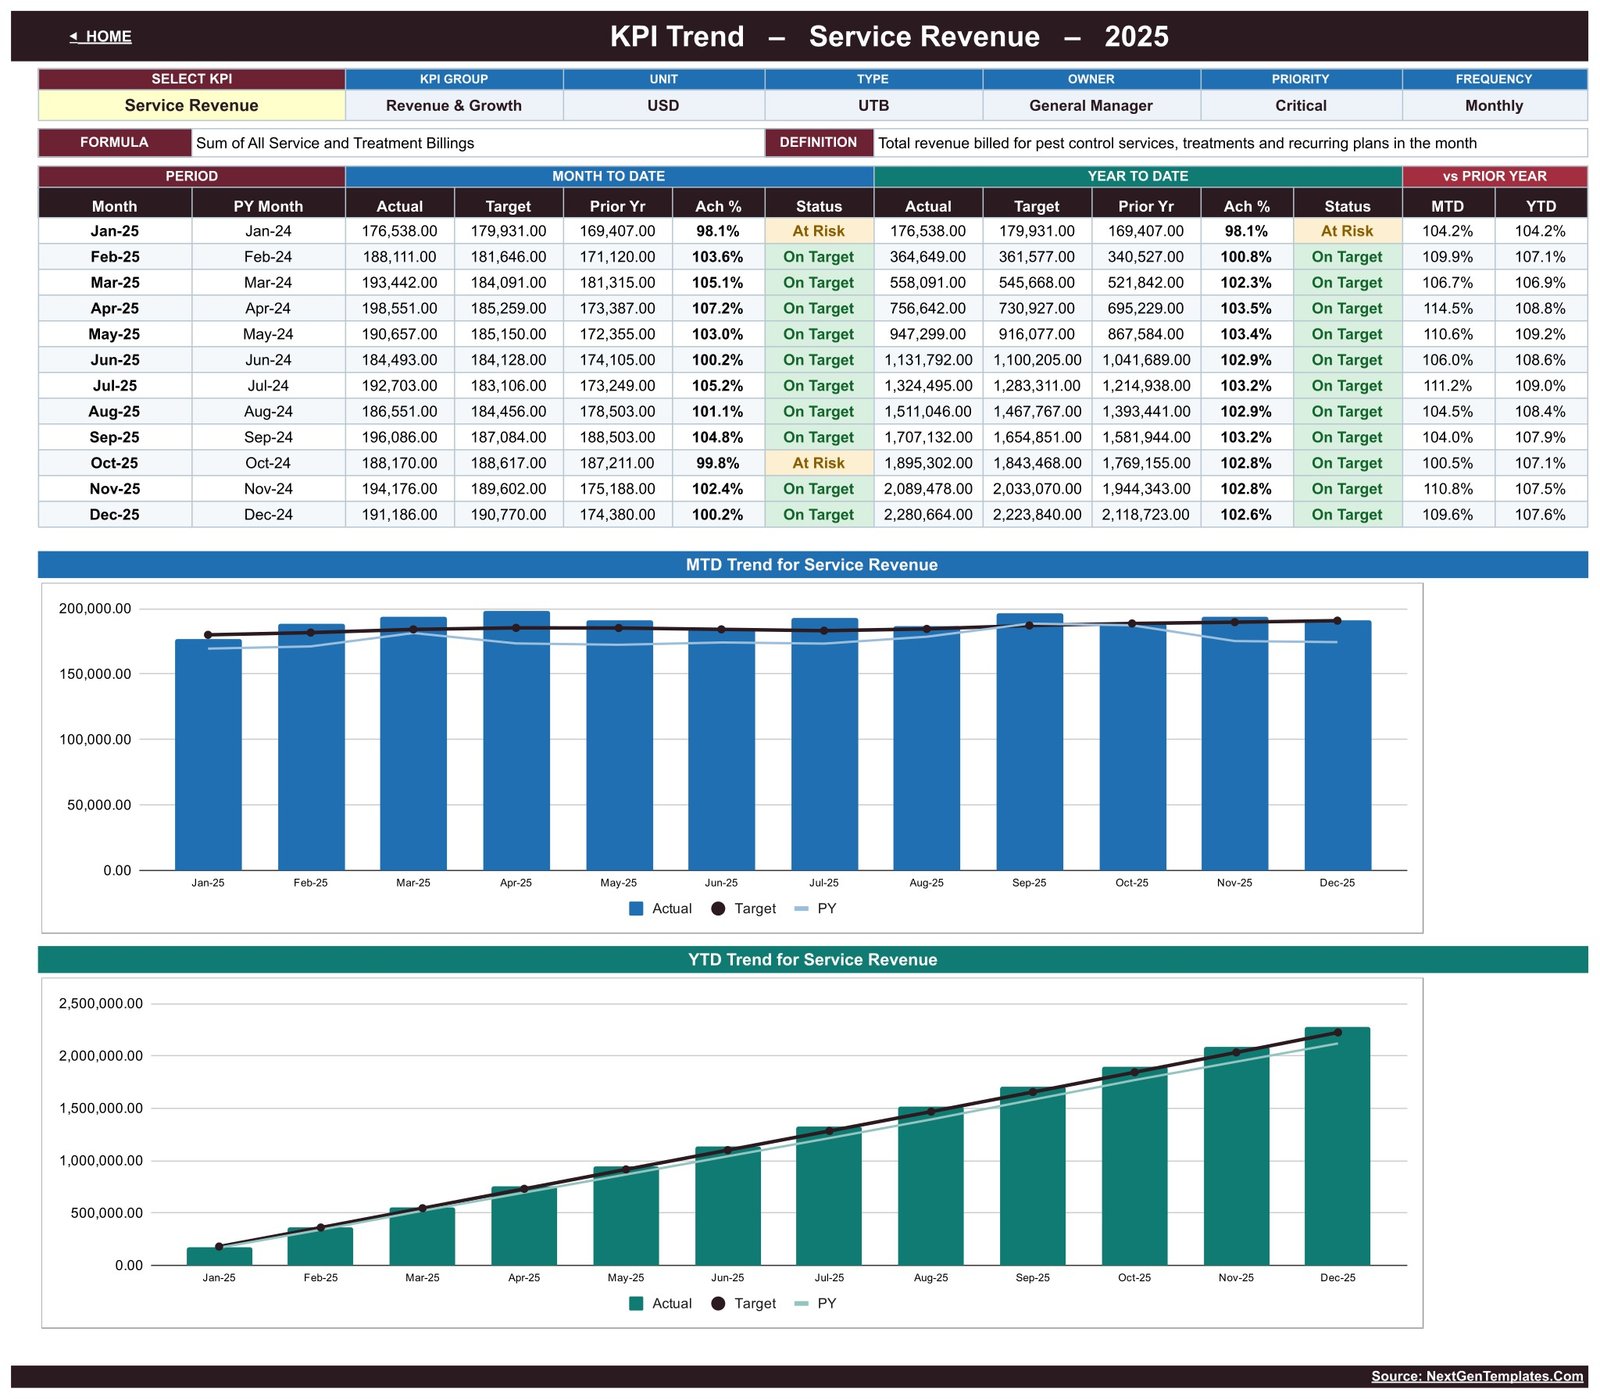
Selected-KPI monthly and year-to-date trend
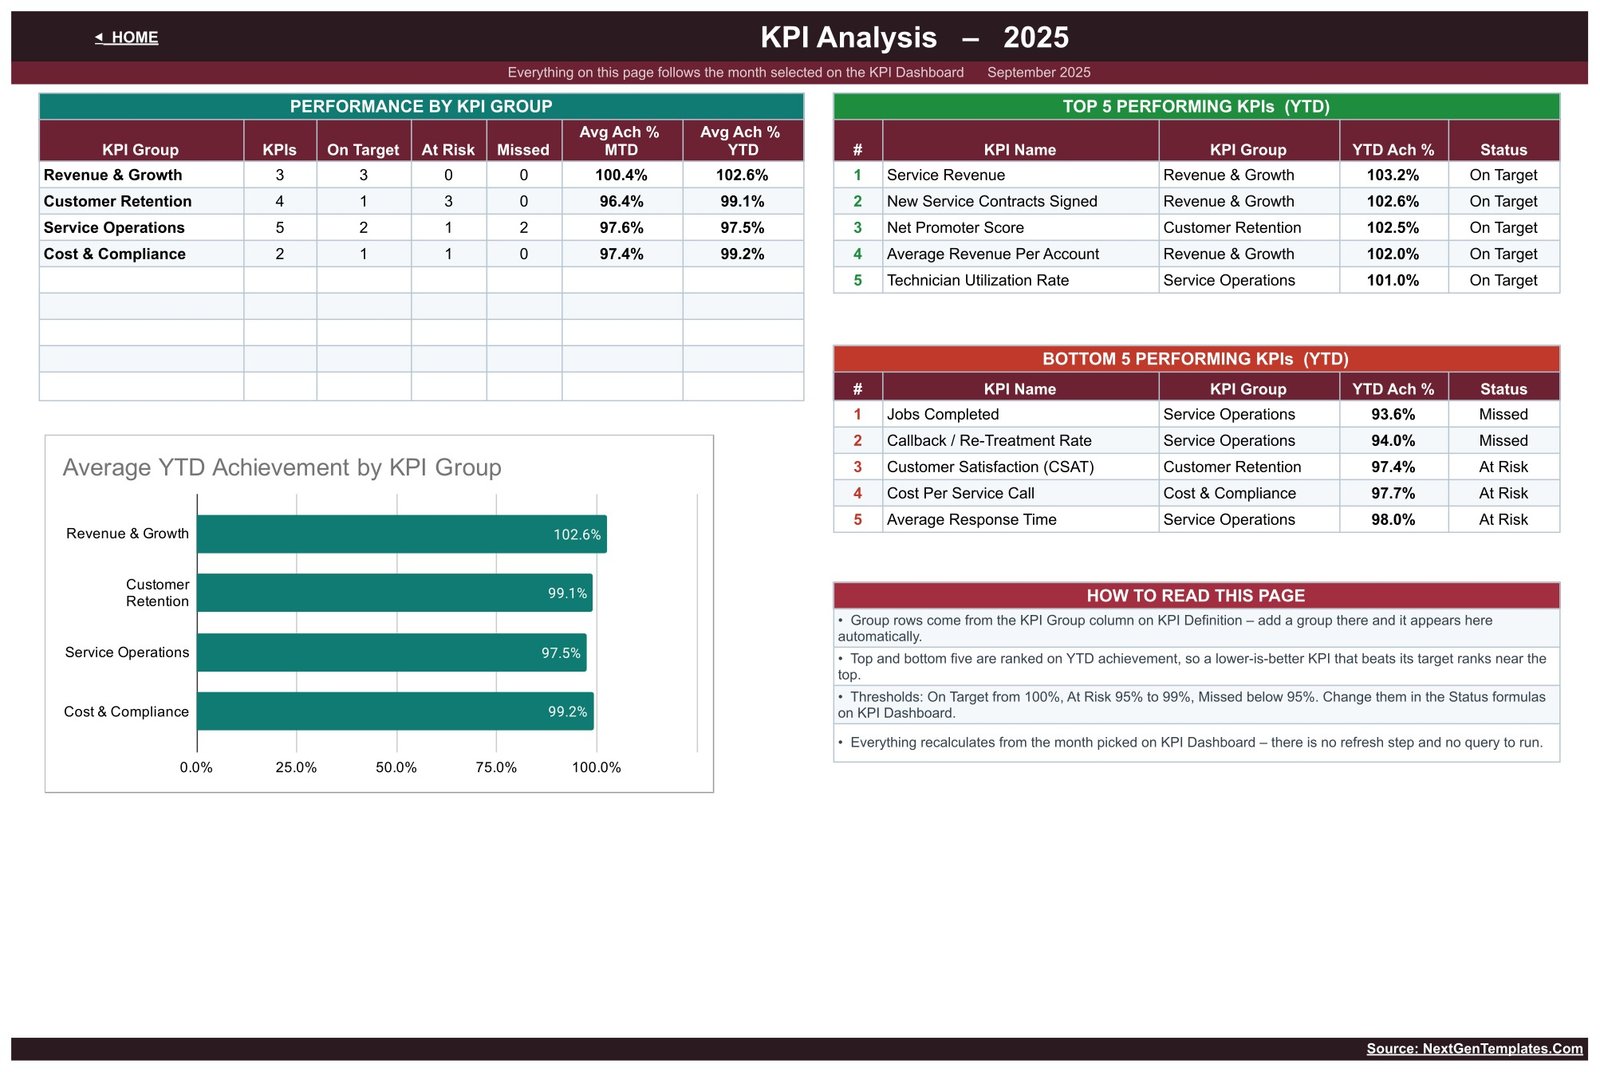
KPI group analysis and performance ranking
Pest Control Business KPI Dashboard in Google Sheets vs. Excel vs. Paid Field-Service SaaS – Where This Fits
| Consideration | This Google Sheets template | Excel dashboard | Paid field-service SaaS |
|---|---|---|---|
| Cost | One-time $8.99 sale price | Usually one-time workbook cost | Recurring subscription |
| Platform | Google Sheets in a browser | Microsoft Excel | Vendor web or mobile app |
| Setup | Copy the sheet and replace sample values | Download and open locally | Account, configuration, and onboarding |
| Collaboration | Native link sharing and simultaneous editing | Depends on storage and Excel version | Built in |
| Customization | Edit labels, groups, inputs, and formulas | Deep workbook control | Limited by vendor settings |
| Job scheduling and dispatch | Not included | Not normally included | Often included |
| Best fit | Management KPI review from prepared monthly totals | Desktop-led analysis | End-to-end field operations |
Who This Template Is For – and Who It’s Not For
This template suits pest control owners, general managers, operations managers, dispatch supervisors, customer-success leads, sales managers, and finance managers who already have monthly operating totals and want a repeatable review page. It is especially useful for small and mid-sized teams that prefer a transparent spreadsheet over another software subscription.
It is not a CRM, route optimizer, technician dispatch system, chemical inventory register, invoicing tool, payroll system, or regulatory filing application. The Pesticide Compliance Rate is a buyer-maintained operational KPI; the workbook does not interpret pesticide law, validate chemical use, prove compliance, or replace required records, labels, permits, training, or professional advice.
How to Use the Pest Control Business KPI Dashboard in Google Sheets
- Download the PDF and use its Google Sheets copy link to create your editable Drive copy.
- Review the KPI Definition master. Rename metrics, groups, units, owners, and formula descriptions to match your process.
- Enter monthly actual values on KPI Input – Actual.
- Enter approved monthly targets and previous-year results on the matching input sheets.
- Select a month on KPI Dashboard and review MTD and YTD achievement and status.
- Use KPI Trend for one-metric investigation and KPI Analysis for group-level prioritization.
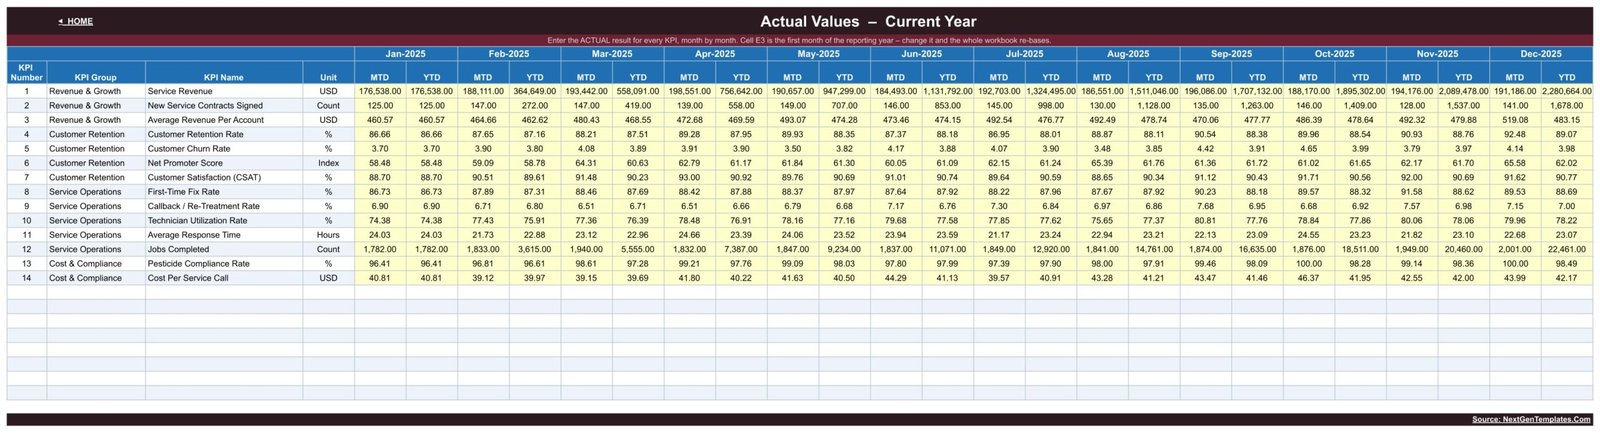
Editable current-year actual values input
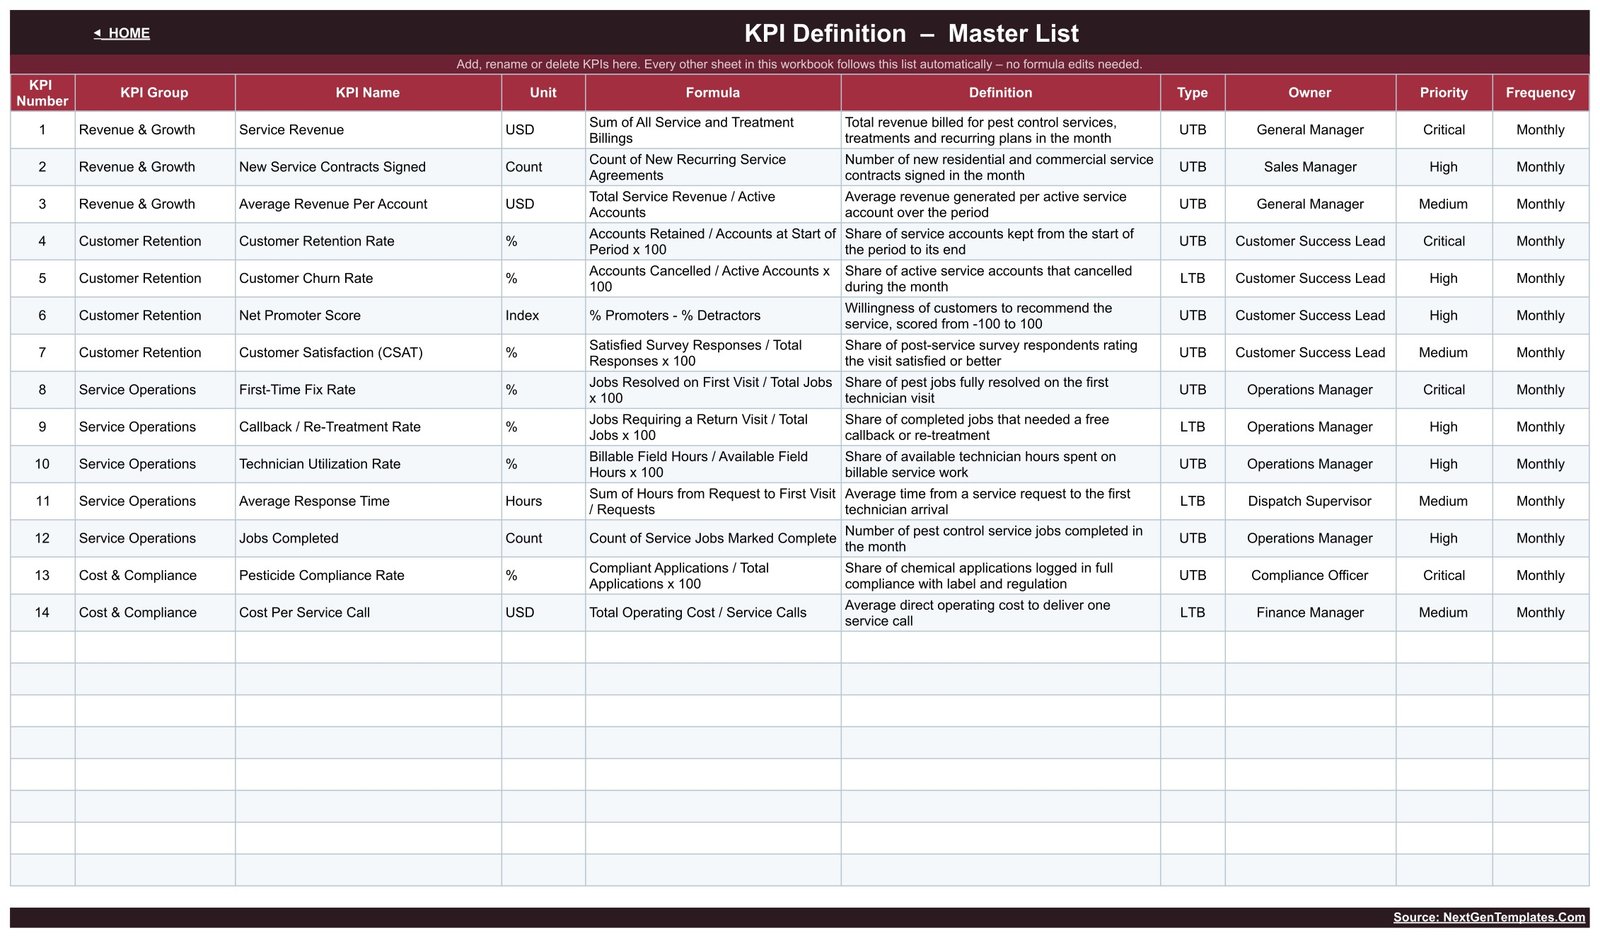
Editable KPI definition master list
Real-World Use Cases
Owner preparing a monthly review
An owner can compare service revenue, new contracts, completed jobs, and average cost per service call without rebuilding a presentation each month.
Operations manager investigating callbacks
An operations manager can select Callback / Re-Treatment Rate on the trend page, compare it with its target and prior year, and discuss the pattern with field supervisors.
Customer-success lead monitoring retention
A customer-success lead can review retention, churn, NPS, and CSAT together, while keeping the exact formulas and survey definitions documented in the master list.
Frequently Asked Questions
Does this work in Microsoft Excel?
This product is built for Google Sheets. For a desktop workflow, consider the Pest Control Dashboard in Excel.
Does it include a pest control CRM or scheduling system?
No. It is a KPI reporting template for prepared monthly figures, not an operational database, CRM, dispatch board, or appointment scheduler.
Can I change the 14 KPIs?
Yes. The definition master is designed for editable names, groups, units, formula text, owners, priorities, frequency, and KPI direction. Structural changes should be tested in a spare copy.
Does the dashboard update automatically?
The formula-driven views recalculate when you replace inputs and change the selected month. It does not connect automatically to field-service software.
Can my team collaborate?
Yes. Standard Google Sheets sharing can support real-time collaboration, subject to the access settings you choose.
Does it certify pesticide compliance?
No. It only records a user-supplied operational percentage. You remain responsible for applicable law, records, labels, safety requirements, and professional guidance.
What do I receive?
You receive a PDF containing the copy link for the Google Sheets template. Use it to create your own editable copy.
About the Author
Built by PK – Microsoft Certified Professional with 15+ years of Excel, Google Sheets, and Power BI experience. Founder of NextGenTemplates, reaching 300K+ subscribers across YouTube channels. Every template is hand-built and tested before release.
Explore Related Templates
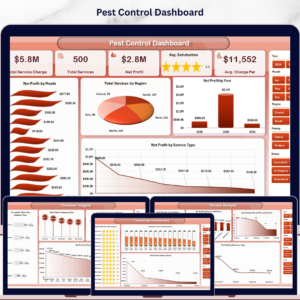
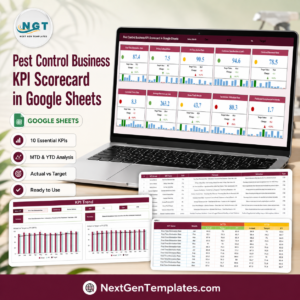
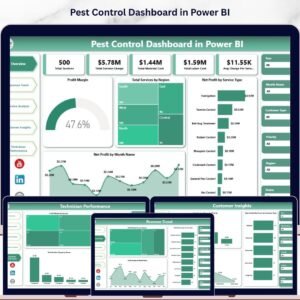
Compare this KPI dashboard with the more compact Pest Control Business KPI Scorecard in Google Sheets, the broader analytical Pest Control Dashboard in Google Sheets, the desktop Excel edition, and the interactive Power BI edition. Browse more Google Sheets KPI dashboards and Google Sheets templates.
Turn monthly pest control results into a consistent management conversation. Get the Pest Control Business KPI Dashboard in Google Sheets, make your own copy, and adapt the definitions before using it for decisions.
Watch the step-by-step video Demo:
Last updated: September 5, 2026.
Compatibility and Requirements
- Works in Google Sheets. You need a free Google account and a web browser.
- The download is a PDF with a copy link, which creates your own editable copy in Google Drive. Google explains how to get started with Google Sheets.
- You pick the reporting month on the KPI Dashboard sheet.





























Reviews
There are no reviews yet.