

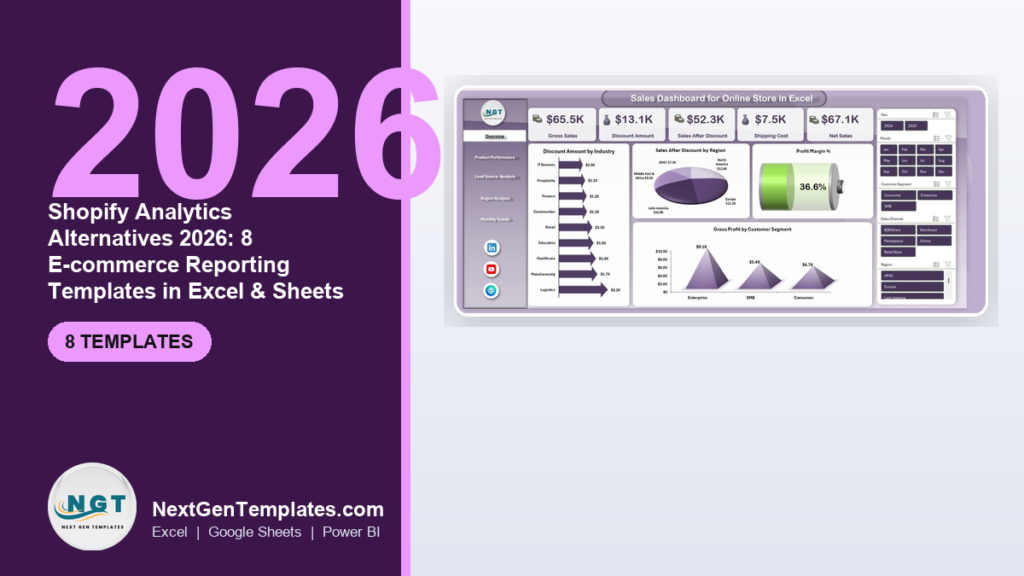
The best Shopify Analytics alternatives in 2026 are spreadsheet and Power BI reporting templates that give you the same e-commerce metrics—gross sales, product performance, margin, order tracking—for a one-time $6.99–$17.99 instead of a recurring platform fee. For most small stores, the Sales Dashboard for Online Store in Excel ($17.99) replaces the analytics tab entirely.
Last updated: September 2026
Key takeaways
- Shopify’s full analytics (custom reports, cohort analysis) is gated behind the Shopify $105/mo and Advanced $399/mo tiers—you cannot buy reporting on its own.
- An Excel or Google Sheets dashboard covers the same core metrics for a one-time $6.99 to $17.99, with no seat limits and no monthly bill.
- The Sales Dashboard for Online Store in Excel ($17.99) is the closest one-file replacement for Shopify’s sales overview.
- Teams that need real-time storefront data, multi-channel POS, or automated tax reporting should stay on Shopify—a template is a reporting layer, not a store backend.
- All 8 templates below export to PDF, work offline, and let you keep historical data forever—even after you leave a platform.
 Launch offer
SUMIFS, XLOOKUP, FILTER, LAMBDA and checking AI-written formulas, with real business projects. 11h 47m of video by PK, with practice files, quizzes and a capstone.
Shopify Analytics vs the alternatives compared
| Template | Format | Best for | Price |
|---|---|---|---|
| Sales Dashboard for Online Store (Best overall) | Excel | Replacing the Shopify sales overview | $17.99 |
| Product-wise Sales Dashboard | Power BI | SKU and product-level analytics | $17.99 |
| Sales Productivity & Target Management Dashboard (Best value) | Google Sheets | Team targets and quota tracking | $9.99 |
| Sales Order Tracker | Google Sheets | Order status and fulfilment | $6.99 |
| Sales & Marketing Product Development KPI Dashboard | Excel | Marketing + product KPIs together | $14.99 |
| Product Launch KPI Dashboard | Excel | Tracking new-product launches | $14.99 |
| Product Development KPI Dashboard | Excel | Roadmap and development metrics | $14.99 |
| Product Development KPI Dashboard | Power BI | Interactive product KPIs | $12.99 |
What Shopify Analytics actually costs in 2026
Shopify Analytics is not sold on its own—it is bundled into your store plan, and the depth of reporting you get is tied to the tier you pay for. As published on Shopify’s official pricing page at the time of writing, the standard plans are:
- Basic – $39/month: finance reports and a limited analytics dashboard only.
- Shopify (Grow) – $105/month: unlocks the full report suite and professional reports.
- Advanced – $399/month: adds the custom report builder and deeper segmentation.
- Plus – from $2,300/month: enterprise analytics and unlimited staff.
That structure is exactly why small teams churn off Shopify’s analytics, and the reasons cluster into three:
1. Seat and tier cost. The reports most owners actually want—custom reports, cohort retention, sales by segment—only appear on the $105 and $399 tiers. You are not paying for a dashboard; you are paying for a plan upgrade you would not otherwise need.
2. Unused modules. Shopify bills you for a full commerce platform—checkout, POS, shipping labels, tax engine—when all you needed this month was a clean sales and margin report. A single-purpose e-commerce reporting template strips that down to the part you use.
3. Admin overhead. Building a custom report inside Shopify, or bolting on a third-party reporting app at $10–$50/month each, adds setup, learning curve and yet another subscription to manage. A spreadsheet you already know removes all of it.
None of this makes Shopify a bad platform. It makes it an expensive reporting tool for a store doing a few hundred orders a month. That is the gap these templates fill.
Head-to-head: Shopify feature vs the NGT template that covers it
| Shopify Analytics feature | NGT template that covers it | Price |
|---|---|---|
| Sales overview (gross / net sales) | Sales Dashboard for Online Store (Excel) | $17.99 one-time |
| Sales by product / SKU report | Product-wise Sales Dashboard (Power BI) | $17.99 one-time |
| Sales by staff / target tracking | Sales Productivity & Target Dashboard (Sheets) | $9.99 one-time |
| Orders & fulfilment report | Sales Order Tracker (Sheets) | $6.99 one-time |
| Marketing & conversion reports | Sales & Marketing KPI Dashboard (Excel) | $14.99 one-time |
| Product / catalogue performance | Product Development KPI Dashboard (Excel) | $14.99 one-time |
Across a year, the $399 Advanced plan costs $4,788; the six templates above together cost roughly $82 once. You lose real-time sync and gain permanent ownership of your data.
How we picked these
We searched the full NextGenTemplates catalogue of 300+ paid Excel, Google Sheets and Power BI templates and shortlisted only those that map directly onto a report you would otherwise run inside Shopify Analytics: sales, product performance, orders, targets and marketing KPIs. We excluded generic finance and HR dashboards, and anything under $6 that lacked a working formula layer. Every template listed here is a paid, maintained product with a live demo image, priced between $6.99 and $17.99.
The 8 best Shopify Analytics alternatives for 2026
1. Sales Dashboard for Online Store in Excel — best overall
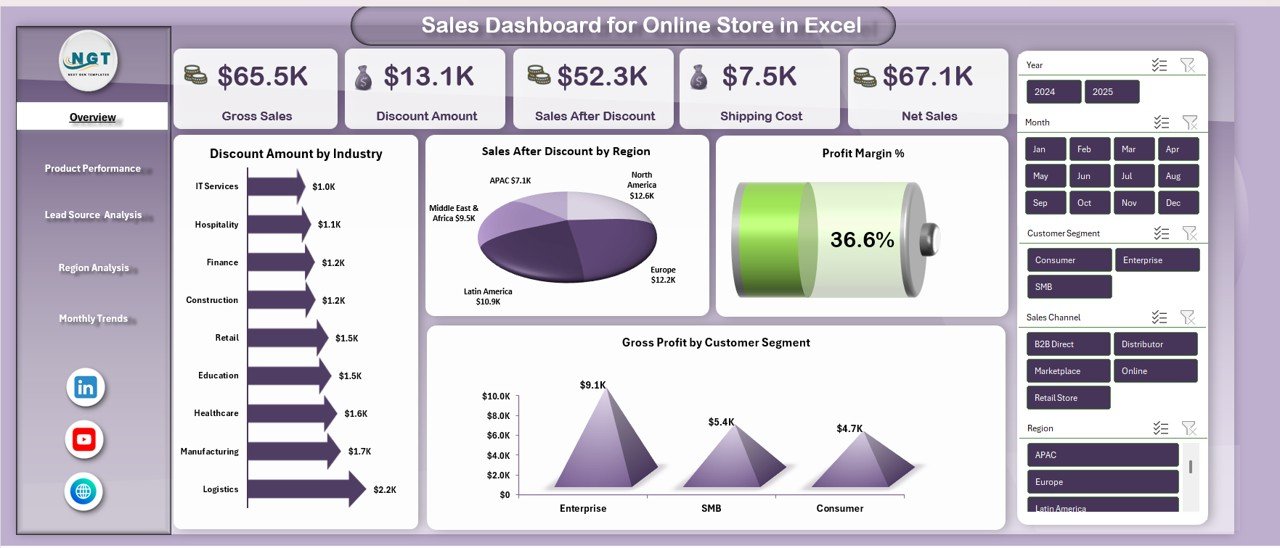
What it is: a single-file Excel dashboard purpose-built for online stores, showing gross sales, discounts, net sales, shipping cost and profit margin at a glance—the exact panel Shopify puts on its analytics home.
Who it is for: Shopify, WooCommerce or Etsy sellers who want the sales overview without paying for the $105+ tier.
What is inside:
- KPI cards for gross sales, discount, net sales, shipping and margin %
- Sales-after-discount breakdown by region and customer segment
- Gross-profit-by-segment and industry views with slicers
- Month and year filters that recalculate the whole board
Drop your monthly order export into the data sheet and the KPIs refresh instantly. A store doing $67K net can see a 36.6% margin, $13K in discounts and $7.5K shipping spend in one screen—no report builder, no upgrade. Price: $17.99. Get the Sales Dashboard for Online Store.
Best for: the single closest replacement for Shopify’s sales overview.
2. Product-wise Sales Dashboard in Power BI — best for SKU analytics
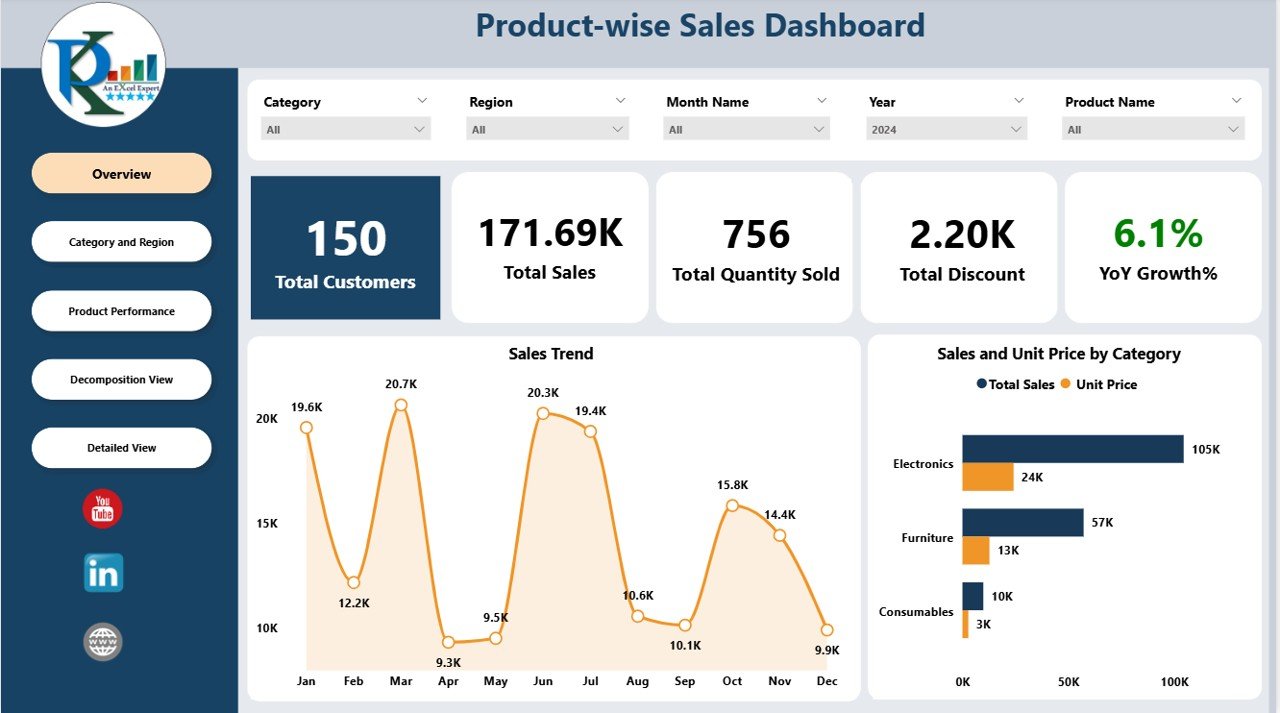
What it is: an interactive Power BI report that slices revenue by product, category and time—Shopify’s “sales by product” report, but fully filterable and free of tier limits.
Who it is for: catalogue-heavy stores that need to know which SKUs actually drive profit.
What is inside:
- Product- and category-level revenue and quantity visuals
- Top- and bottom-performer ranking
- Trend lines by month with cross-filtering
- Drill-through from category to individual product
Because it is Power BI, you can publish it to the free desktop app and refresh it from a CSV export in seconds. For a store with 400 SKUs, spotting the 20 products that make 80% of margin takes one click. Price: $17.99. Get the Product-wise Sales Dashboard. If you are weighing Power BI against paid BI suites, see our Tableau alternatives and Power BI Premium alternatives guides.
Best for: product- and SKU-level profit analysis.
3. Sales Productivity & Target Management Dashboard in Google Sheets — best value
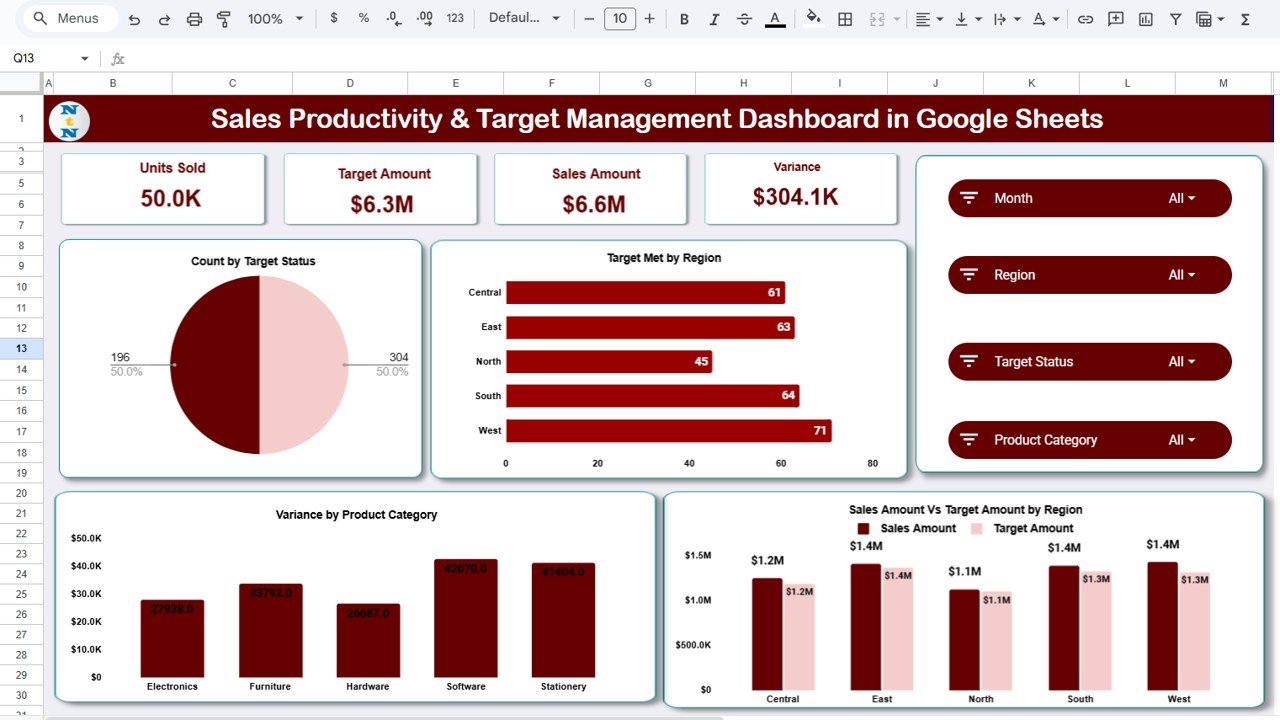
What it is: a Google Sheets dashboard for setting sales targets and tracking actuals against them by rep, period and product line.
Who it is for: small e-commerce teams with two or more people selling, who want Shopify’s staff-performance view without the Advanced plan.
What is inside:
- Target-vs-actual tracking with attainment %
- Per-rep and per-period productivity views
- Colour-coded status against quota
- Cloud-shared, multi-user editing
Because it lives in Google Sheets it is genuinely free to run and share—no seat charges when you add a second or third team member. A team chasing a $50K quarter can see who is at 92% and who is at 61% without opening Shopify at all. Price: $9.99. Get the Sales Productivity Dashboard.
Best for: the most capability per dollar.
4. Sales Order Tracker in Google Sheets — cheapest entry point
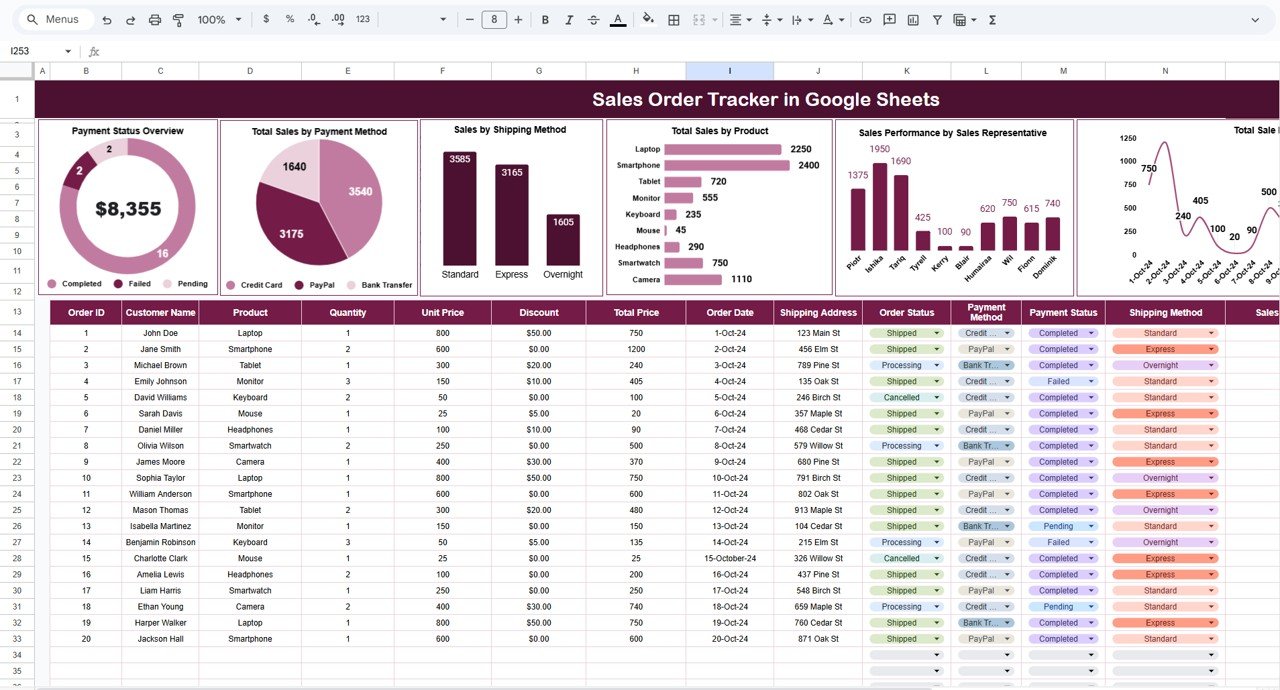
What it is: a lightweight Google Sheets tracker for order status, fulfilment and payment—the “orders” report distilled to its essentials.
Who it is for: new or side-hustle stores that just need to know what shipped, what is pending and what is paid.
What is inside:
- Order log with status, value and date
- Fulfilled / pending / cancelled summary counts
- Simple revenue roll-up by period
- Filter and sort by customer or status
At $6.99 it is the lowest-risk way to leave Shopify’s reporting behind and keep a permanent order history you own. Many sellers start here and add the sales dashboard once volume grows. Price: $6.99. Get the Sales Order Tracker.
Best for: the cheapest way to start.
5. Sales & Marketing Product Development KPI Dashboard in Excel
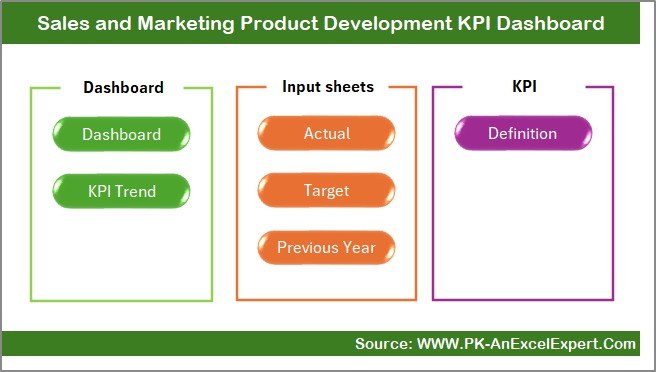
What it is: an Excel KPI dashboard that combines sales, marketing and product-development metrics on one board—useful when your Shopify reports and your marketing numbers live in different places.
Who it is for: owner-operators tracking acquisition, conversion and product metrics together.
What is inside:
- Sales and revenue KPIs with targets
- Marketing funnel and conversion metrics
- Product-development progress indicators
- Trend charts and variance flags
This is the template that goes furthest beyond what Shopify shows, because it pulls marketing performance into the same view as sales. Price: $14.99. Get the Sales & Marketing KPI Dashboard.
Best for: combining marketing and sales KPIs in one file.
6. Product Launch KPI Dashboard in Excel
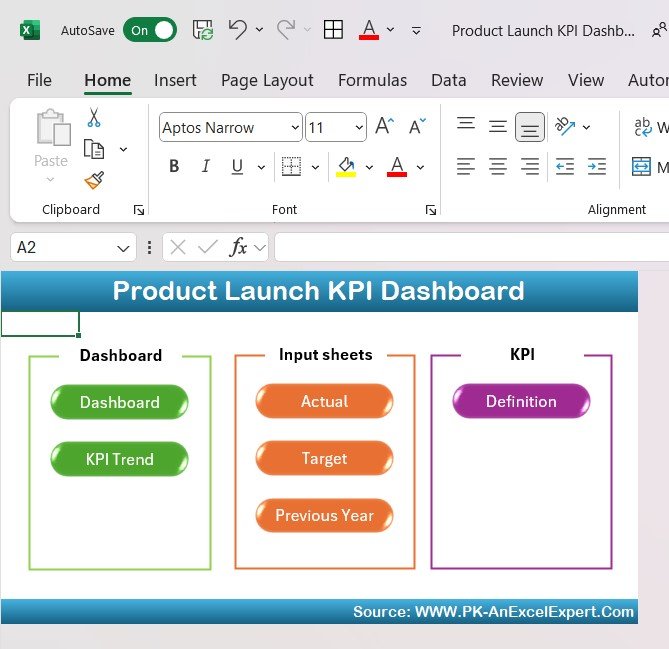
What it is: an Excel dashboard built to track a new-product launch—pre-orders, first-30-day sales, sell-through and launch targets.
Who it is for: stores that launch collections or drops and need a focused launch scorecard Shopify does not provide out of the box.
What is inside:
- Launch timeline and milestone tracking
- Units sold vs launch target
- Sell-through and revenue-to-date KPIs
- Comparison across multiple launches
For a brand that drops new products monthly, this answers “did the launch work?” far more clearly than a generic sales report. Price: $14.99. Get the Product Launch KPI Dashboard.
Best for: measuring individual product launches.
7. Product Development KPI Dashboard in Excel

What it is: an Excel dashboard for the product side of the business—roadmap progress, development KPIs and portfolio health.
Who it is for: stores that build or curate their own catalogue and want to manage the product pipeline, not just sales output.
What is inside:
- Development-stage and milestone tracking
- Portfolio and roadmap KPIs
- Resource and timeline views
- Status dashboards with variance
Shopify reports on what sells; this reports on what you are building. Together they cover both ends of a product-led store. Price: $14.99. Get the Product Development KPI Dashboard.
Best for: managing the product pipeline behind the store.
8. Product Development KPI Dashboard in Power BI
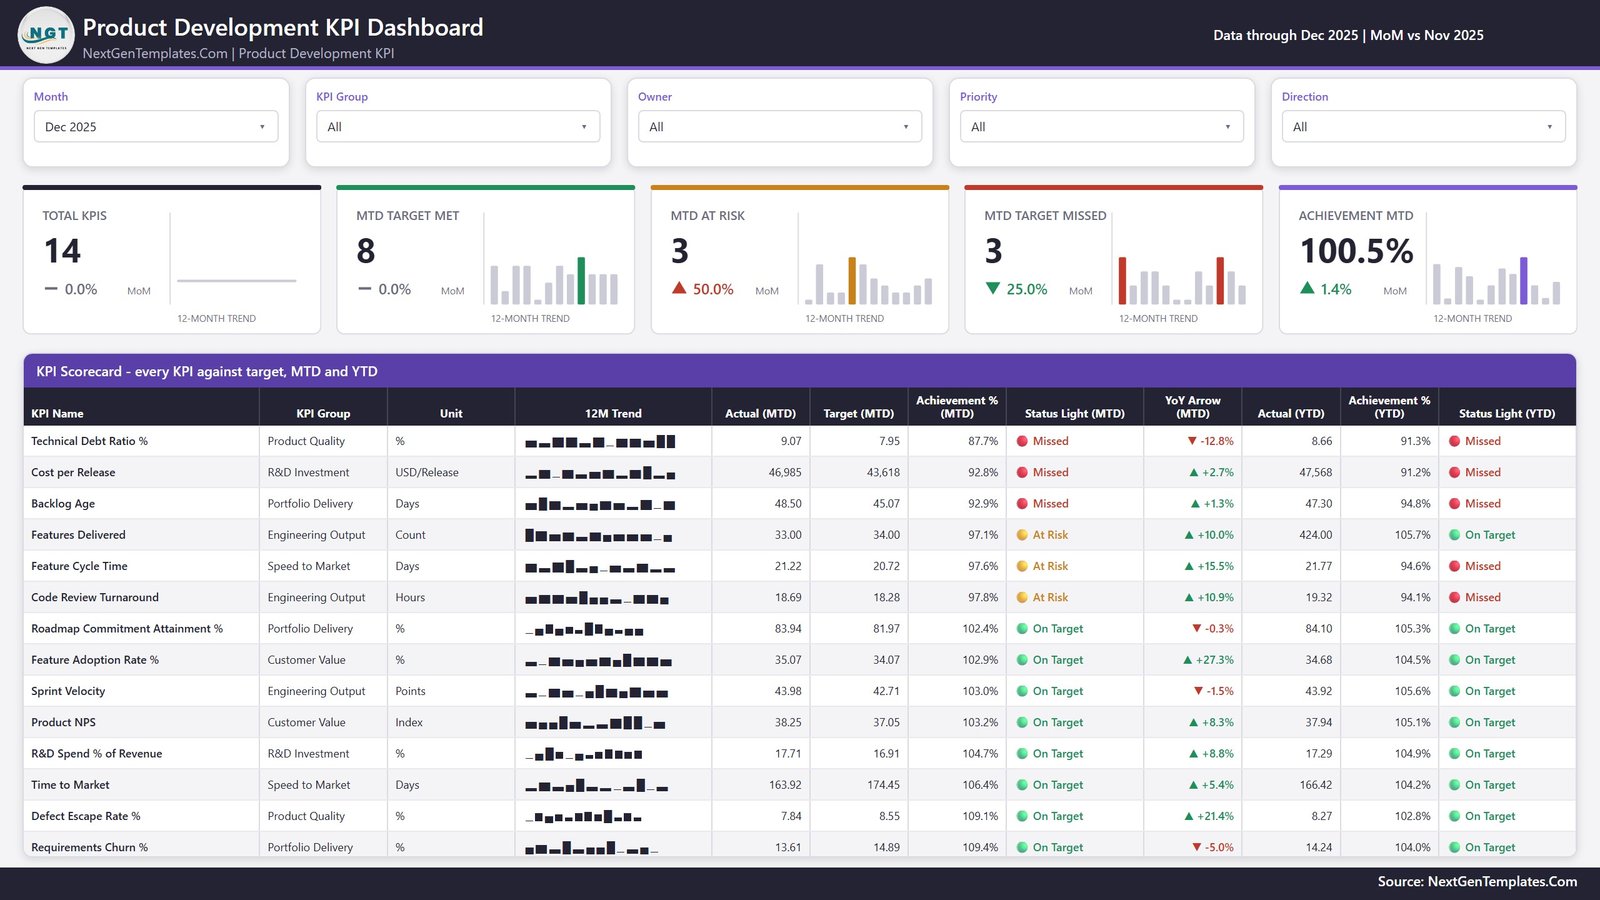
What it is: the interactive Power BI version of the product-development scorecard, with cross-filtering and drill-down.
Who it is for: teams already comfortable in Power BI who want product KPIs they can slice live.
What is inside:
- Interactive KPI cards and trend visuals
- Filterable development-stage breakdowns
- Drill-through to individual products
- Refresh from CSV or Excel source
At $12.99 it is the cheapest way into interactive product analytics, and it pairs naturally with the Product-wise Sales Dashboard above for a full Power BI reporting stack. Price: $12.99. Get the Power BI Product Development Dashboard.
Best for: interactive product KPIs on a budget.
How to choose between them
| If you want to… | Choose | Price |
|---|---|---|
| Replace the Shopify sales overview | Sales Dashboard for Online Store (Excel) | $17.99 |
| Analyse which products make money | Product-wise Sales Dashboard (Power BI) | $17.99 |
| Track a team against targets | Sales Productivity Dashboard (Sheets) | $9.99 |
| Start as cheaply as possible | Sales Order Tracker (Sheets) | $6.99 |
| See marketing + sales together | Sales & Marketing KPI Dashboard (Excel) | $14.99 |
Quick rule: if you live in Excel, start with the Online Store dashboard; if your team collaborates in the cloud, start with the Google Sheets productivity dashboard; if you want interactivity, go Power BI. You can own all three formats for less than one month of the Advanced plan.
When Shopify Analytics is still the right call
A template is a reporting layer, not a store backend—so be honest about where Shopify wins. Stay on (or upgrade) Shopify Analytics when:
- You need real-time data. Templates refresh when you import an export. If you make decisions minute-to-minute during a flash sale, native analytics is worth the money.
- You sell across many channels. Shopify stitches POS, online, and marketplace data automatically. Reconciling that by hand in a spreadsheet every day is not worth $17.99.
- You need automated tax and finance reports. Shopify’s finance reports feed accounting and tax filing directly; a template does not.
- You are at real scale. Above a few thousand orders a month, a manual export-and-refresh loop becomes the bottleneck, and the Advanced or Plus tier earns its keep.
For everyone else—stores doing tens to a few hundred orders a month who mostly review reporting weekly—a one-time template is the rational choice. The two approaches also coexist: many owners keep Basic at $39 for the storefront and do all their reporting in these dashboards.
How to move your reporting off Shopify in 4 steps
Switching from native analytics to a template is a 30-minute job, not a migration project. Here is the exact sequence.
- Export your data. In Shopify, go to Analytics → Reports (or Orders) and export the last 12 months of orders as CSV. Do the same for products if you want SKU-level views. This is your source data and it is yours to keep.
- Paste into the data sheet. Open the template—say the Sales Dashboard for Online Store—and paste the export into the labelled data tab. The columns are pre-mapped for order date, value, discount, shipping and product.
- Check the KPI cards. The dashboard recalculates automatically. Confirm gross sales and net sales match your Shopify totals for the same period—a two-minute sanity check that your columns landed in the right place.
- Set a monthly refresh habit. Once a month, export the new orders and append them. Because the file is yours, your history grows indefinitely instead of being capped by a plan tier. Save a dated copy each quarter and you have a permanent, audit-ready archive.
That loop—export, paste, verify, append—is all it takes to run e-commerce reporting for a one-time template price instead of a monthly bill. Teams that report weekly rather than in real time rarely feel the difference, and they keep every historical row forever. For a broader look at building owned reporting outside a paid suite, our Tableau alternatives guide walks through the same trade-off for BI tools.
Frequently asked questions
What is the best Shopify Analytics alternative in Excel?
The Sales Dashboard for Online Store in Excel ($17.99) is the closest single-file replacement. It reproduces Shopify’s sales overview—gross sales, discounts, net sales, shipping and margin—in one screen, refreshed from your order export, with no monthly fee or plan-tier gating.
Can I replace Shopify Analytics with a spreadsheet?
Yes, for reporting. Export your orders as CSV, drop them into an Excel or Google Sheets dashboard, and you get the same core metrics Shopify shows. You lose real-time sync and automated multi-channel stitching, but you gain permanent data ownership and no recurring cost.
How much does Shopify Analytics cost on its own?
It is not sold separately. Full analytics is bundled into the Shopify ($105/month) and Advanced ($399/month) plans; the Basic ($39/month) plan includes only limited reports. That bundling is the main reason small teams look for a cheaper standalone reporting tool.
Do these templates work with Shopify data?
Yes. Every store platform—Shopify, WooCommerce, Etsy, Amazon—lets you export orders and products to CSV. You paste that export into the template’s data sheet and the dashboard recalculates. No API connection or app install is required.
Are Excel or Google Sheets templates better for e-commerce reporting?
Excel is stronger for complex formulas and offline single-user work; Google Sheets is better for cloud sharing and multi-person teams with no seat cost. Both cover the same metrics—pick the tool your team already uses daily.
Is Power BI a good Shopify Analytics alternative?
Yes, when you want interactivity. Power BI Desktop is free, and templates like the Product-wise Sales Dashboard let you slice revenue by product and period with drill-down—closer to Shopify’s report experience than a static spreadsheet, without the plan fee.
Will I lose my historical data if I stop paying Shopify?
Inside Shopify, deeper historical reports can be tied to your plan tier. A template stores data in a file you own permanently, so exporting to a spreadsheet dashboard is also a way to keep a long-term archive independent of your subscription.
How many orders can a spreadsheet dashboard handle?
Comfortably into the tens of thousands of rows for Excel and Power BI, and a few thousand for Google Sheets before it slows. For most small and mid-size stores that is well beyond monthly volume; only high-scale merchants outgrow it.
What is the cheapest way to get e-commerce reporting?
The Sales Order Tracker in Google Sheets at $6.99 is the lowest-cost entry point. It covers order status and revenue roll-up, runs free in Google Sheets, and can be paired later with the $17.99 sales dashboard as your store grows.
Get more e-commerce reporting templates
Ready to leave the recurring bill behind? The Sales Dashboard for Online Store in Excel ($17.99) is the fastest one-file replacement for Shopify’s analytics home, and the Sales Order Tracker ($6.99) is the cheapest way to start. Browse related switcher guides too: Salesforce alternatives, Zoho CRM alternatives, Looker Studio alternatives, Sisense alternatives and Domo alternatives.
For walkthroughs and setup demos of these dashboards, subscribe to the NextGenTemplates YouTube channel.
Before you commit to another monthly bill, compare the numbers in our one-time purchase vs subscription software guide — it breaks down the real 5-year cost of buying once versus subscribing.