

The best Fishbowl alternatives in 2026 are spreadsheet-based inventory and order templates that replace Fishbowl’s $329-per-month seats with a one-time purchase from $9.99. For small teams tracking stock, fulfillment and order cycle time, eight Excel, Google Sheets and Power BI KPI dashboards from NextGenTemplates cover the reports most Fishbowl users actually open.
Last updated: August 2026
Key takeaways
- Fishbowl’s published pricing starts around $329/month billed annually for Fishbowl Drive, and Fishbowl Advanced is quote-only, so a five-seat team can clear $4,000+ a year before add-ons.
- Eight NextGenTemplates inventory and order templates cover the same core reports for a one-time $9.99–$14.99, with no per-seat renewal.
- The Construction & Real Estate Inventory Management KPI Dashboard in Excel is the best overall Fishbowl stand-in for stock-level tracking.
- The Order Fulfillment KPI Dashboard in Google Sheets at $9.99 is the best value and mirrors Fishbowl Drive’s cloud, multi-user model.
- Templates replace Fishbowl’s reporting and KPI layer, not its live barcode scanning or manufacturing work orders — we say plainly below when Fishbowl is still the right call.
 Launch offer
SUMIFS, XLOOKUP, FILTER, LAMBDA and checking AI-written formulas, with real business projects. 11h 47m of video by PK, with practice files, quizzes and a capstone.
Why small teams churn off Fishbowl
Fishbowl is a capable inventory and manufacturing platform, and for the right company it earns its price. But three costs push small teams to look for a Fishbowl alternative Excel inventory setup instead of renewing.
Seat cost. Per their official Fishbowl pricing page, Fishbowl Drive starts at roughly $329/month billed annually, and Fishbowl Advanced is quote-only through a sales call. A three-to-five person operation that just needs to see stock levels and fulfillment KPIs is paying platform money for reporting it could run in a spreadsheet.
Unused modules. Manufacturing work orders, barcode hardware integration, and multi-warehouse transfers are powerful — and mostly idle for a team that sells from one location. You still pay for them.
Admin overhead. Fishbowl needs setup, a QuickBooks or Xero sync, and someone who owns it. A template opens in software your team already knows and is editable on day one. If you are auditing your whole stack, our Xero accounting alternatives in Excel guide covers the bookkeeping side of the same decision.
Fishbowl vs the NGT template that covers it
| Fishbowl feature | NGT template that covers it | Format | Price |
|---|---|---|---|
| Inventory / stock-level tracking | Construction & Real Estate Inventory Management KPI Dashboard (Best overall) | Excel | $12.99 |
| Stockout & reorder alerts | Out-of-Stock Rate KPI Dashboard | Power BI | $11.99 |
| Sales-order fulfillment | Order Fulfillment KPI Dashboard | Excel | $12.99 |
| Order lead / cycle time | Order Cycle Time KPI Dashboard | Excel | $14.99 |
| Cloud, multi-user fulfillment (like Fishbowl Drive) | Order Fulfillment KPI Dashboard (Best value) | Google Sheets | $9.99 |
| Shared cloud order-speed tracking | Order Cycle Time KPI Dashboard | Google Sheets | $9.99 |
| Import / export & landed-cost inventory | Cross-border Trade Services KPI Dashboard | Excel | $14.99 |
| Trade & logistics BI reporting | Cross-border Trade Services KPI Dashboard | Power BI | $11.99 |
How we picked these
We searched the full NextGenTemplates catalog of 900+ paid templates for the inventory, stock and order-management dashboards that map to what Fishbowl users actually report on: on-hand stock, out-of-stock rate, order fulfillment and order cycle time. We kept only paid, ready-to-edit KPI dashboards priced $9.99–$14.99, and we deliberately included the same tools in Excel, Google Sheets and Power BI so you can match your existing stack. We excluded free trackers and single-metric sheets that could not stand in for a Fishbowl report screen.
The 8 best Fishbowl alternatives for 2026
Each template below is ranked by how directly it replaces a Fishbowl report screen, then by price. We lead with overall stock visibility, move through stockout and order-fulfillment coverage, and finish with the trade and import/export dashboards for businesses whose inventory crosses borders. Every one is a one-time purchase you own outright, and each is available so you can match your existing Excel, Google Sheets or Power BI stack rather than learning a new platform.
1. Construction & Real Estate Inventory Management KPI Dashboard in Excel — best overall
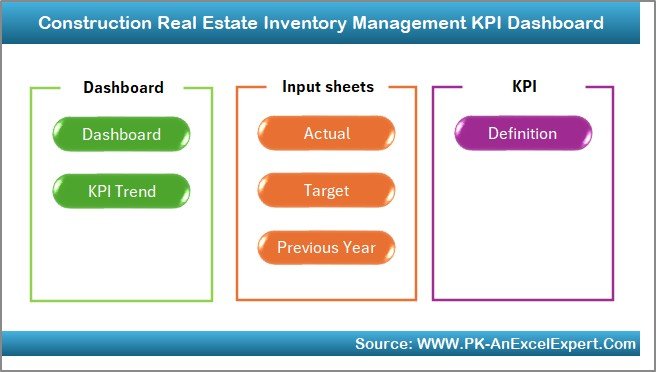
This is the closest single-file stand-in for Fishbowl’s inventory screen. It tracks on-hand quantities, target versus actual stock, and prior-year movement with a definition tab so anyone can read the numbers.
Who it is for: a small builder, materials supplier or property team that needs live stock visibility without a platform login.
- Actual vs target vs previous-year stock in one view
- KPI trend page for stock movement over time
- Editable input sheets — no macros to unlock
- Definition tab that documents every metric
Use it to flag slow-moving SKUs before they tie up cash, to reconcile a monthly physical count against your book quantity, or to show a lender a clean stock-value snapshot in minutes. At $12.99 one-time it costs less than a single day of a Fishbowl Drive subscription. Get the inventory management Excel template →
Best for: teams that want Fishbowl’s stock report without Fishbowl’s monthly bill.
2. Out-of-Stock Rate KPI Dashboard in Power BI — best for stockout prevention
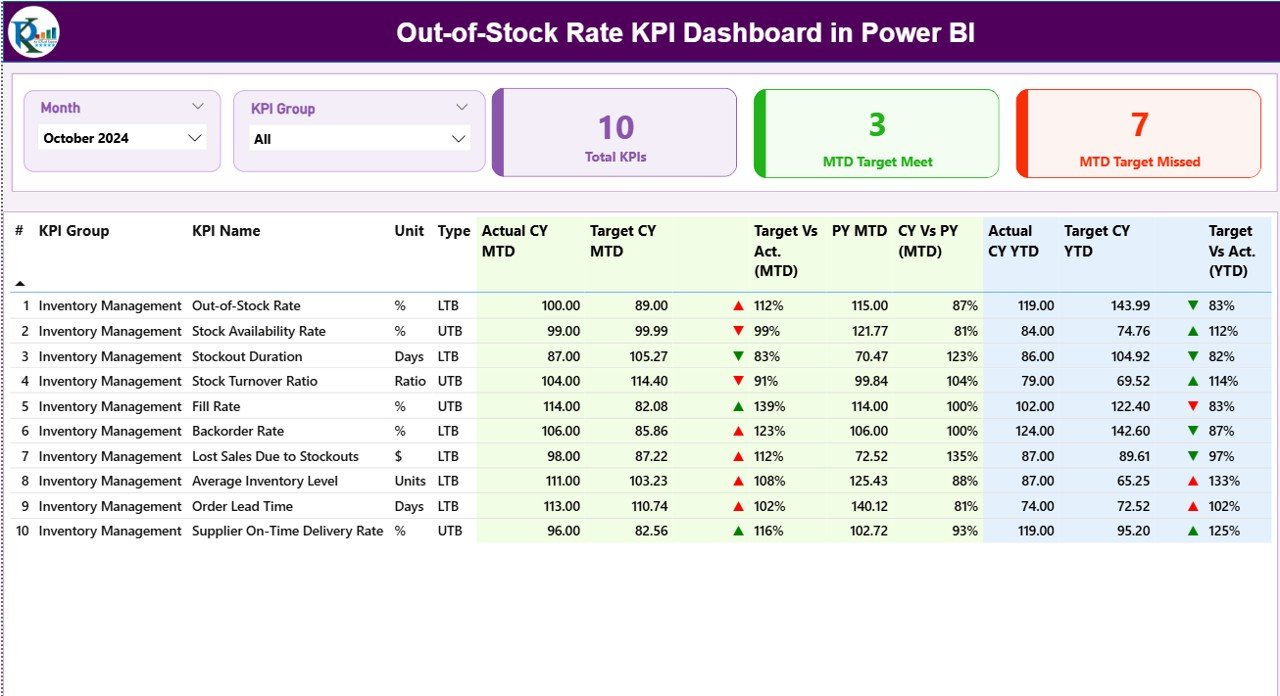
Fishbowl’s reorder points exist to stop stockouts; this dashboard measures how well you are doing it. It surfaces out-of-stock rate by product and period so you see the lost-sales risk Fishbowl only hints at.
Who it is for: retail and ecommerce teams that live and die by availability.
- Out-of-stock rate trended by SKU and month
- Interactive Power BI slicers by category and location
- Drill-down from summary tile to line item
- Refreshable from your own exported stock file
Track whether a new supplier actually cut your stockout rate, spot the 20% of SKUs causing 80% of lost sales, or set an internal availability target and watch it weekly. For deeper BI comparisons, see our Domo BI dashboard alternatives and Qlik Sense Power BI alternatives. At $11.99. Get the out-of-stock Power BI dashboard →
Best for: availability-obsessed sellers who want the stockout metric front and center.
3. Order Fulfillment KPI Dashboard in Excel — best for order accuracy
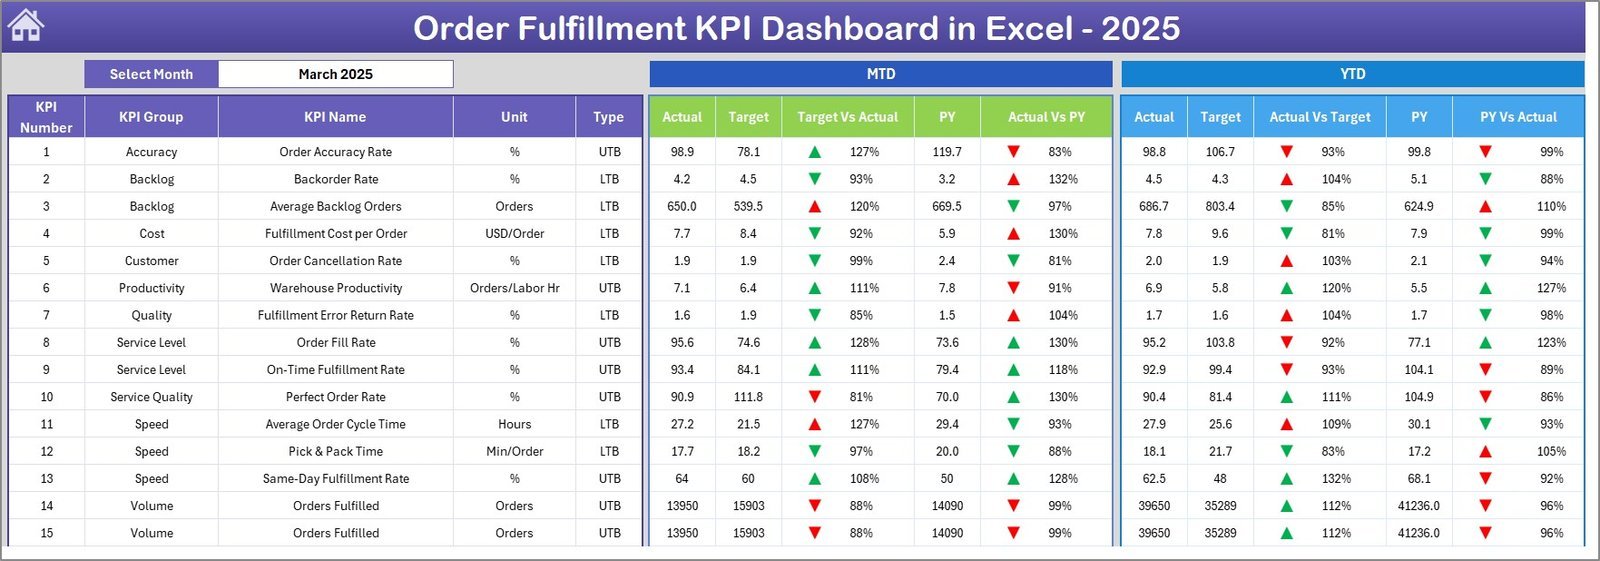
Fishbowl’s sales-order module is really about getting orders out correctly and on time. This dashboard isolates that: fulfillment rate, on-time delivery and order accuracy in a single Excel file.
Who it is for: operations leads who ship physical orders and answer for the numbers.
- Fulfillment rate, on-time %, and accuracy KPIs
- Actual vs target for each fulfillment metric
- Trend page to catch drift before customers complain
- Clean print layout for a weekly ops review
Use it to prove a 3PL is hitting its SLA, to find the warehouse shift where accuracy dips, or to justify a packing-process change with before-and-after numbers. At $12.99 one-time. Get the order fulfillment Excel dashboard →
Best for: replacing Fishbowl’s order reporting for a single-warehouse operation.
4. Order Cycle Time KPI Dashboard in Excel — best for speed tracking

Cycle time — order placed to order delivered — is the number customers feel. This dashboard breaks the cycle into stages so you can see where the days go, something Fishbowl reports rarely make obvious.
Who it is for: teams competing on delivery speed against Amazon-trained expectations.
- End-to-end cycle time with stage-by-stage breakdown
- Actual vs target vs previous period
- Trend chart to confirm process changes stick
- Definition tab so the metric is measured consistently
Pinpoint whether picking, packing or carrier hand-off is your bottleneck, benchmark this quarter against last, or set a cycle-time target for a new-product launch. At $14.99 it is the premium pick in the set and still a rounding error next to a subscription. Get the order cycle time Excel template →
Best for: operations that need to shrink the days between order and doorstep.
5. Order Fulfillment KPI Dashboard in Google Sheets — best value

This is the closest match to Fishbowl Drive’s cloud, multi-user model — without the seat fee. It lives in Google Sheets, so your whole team can open the same fulfillment numbers from any browser.
Who it is for: distributed or remote teams that need shared, always-current reporting.
- Same fulfillment, on-time and accuracy KPIs as the Excel edition
- Real-time collaboration — no version emailing
- Works on any device with a browser
- Share view-only with a client or supplier in one link
Give a warehouse partner live view access, run a shared ops standup off one tab, or connect it to a Google Form for order intake. At $9.99 it is the cheapest full dashboard here and the natural swap for a Fishbowl Drive seat. Get the Google Sheets fulfillment template →
Best for: teams that chose Fishbowl Drive mainly for cloud access.
6. Order Cycle Time KPI Dashboard in Google Sheets — best for shared speed reporting
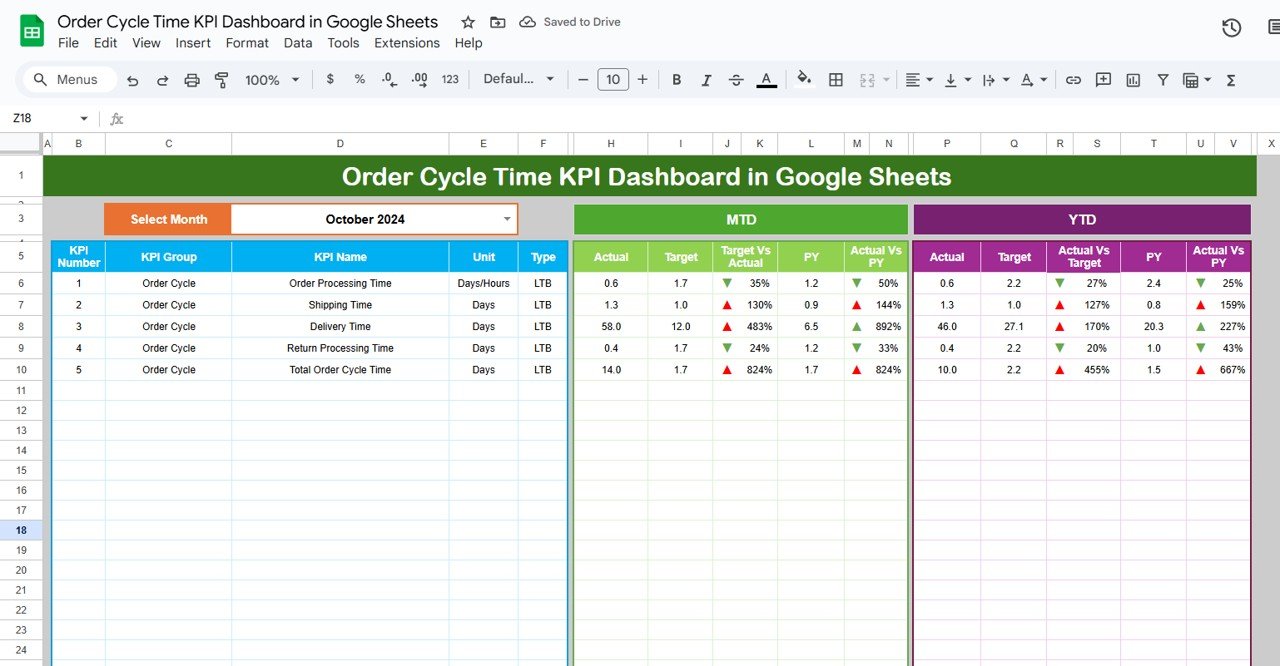
The cloud twin of the cycle-time dashboard, for teams that want speed metrics visible to everyone without an Excel license. Same stage breakdown, live in Google Sheets.
Who it is for: lean startups and remote ops teams standardizing on Google Workspace.
- Stage-by-stage cycle time in a shared sheet
- Live edits reflected for every viewer instantly
- No software to install or license to buy
- Easy to fork per client or per product line
Run a weekly speed review off a shared link, let a supplier update their own hand-off times, or keep a rolling 12-week trend the whole team can see. At $9.99 one-time. Get the Google Sheets cycle time template →
Best for: Google Workspace teams tracking delivery speed together.
7. Cross-border Trade Services KPI Dashboard in Excel — best for import/export inventory
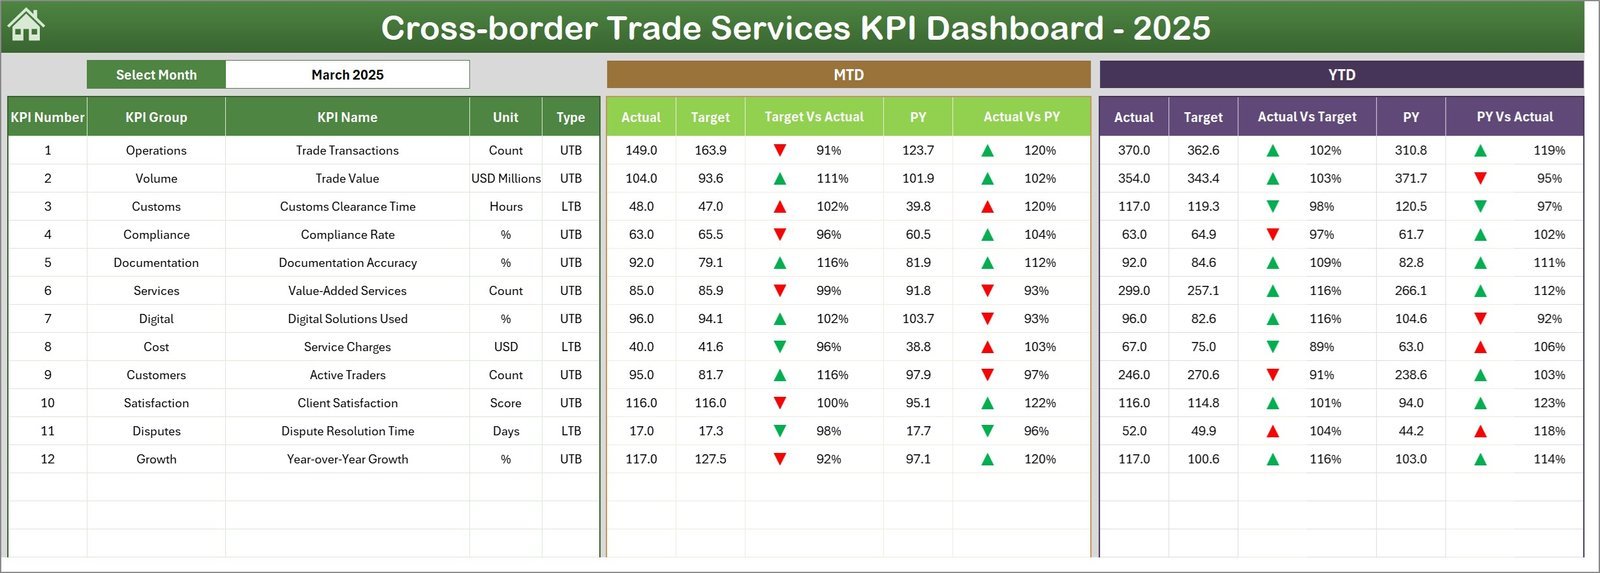
If your inventory crosses borders, Fishbowl alone rarely tells the whole landed-cost story. This dashboard tracks trade-service KPIs — shipment volumes, clearance timing and cost — alongside your stock flow.
Who it is for: importers, exporters and distributors managing international stock.
- Shipment and clearance KPIs with actual vs target
- Cost and volume trends by trade lane
- Definition tab documenting each trade metric
- Editable to your own HS codes and lanes
Watch customs clearance days by lane, compare freight cost per unit across suppliers, or model the inventory impact of a slower port. At $14.99. Get the cross-border trade Excel dashboard →
Best for: businesses whose inventory pain is at the border, not just the shelf.
8. Cross-border Trade Services KPI Dashboard in Power BI — best for trade BI
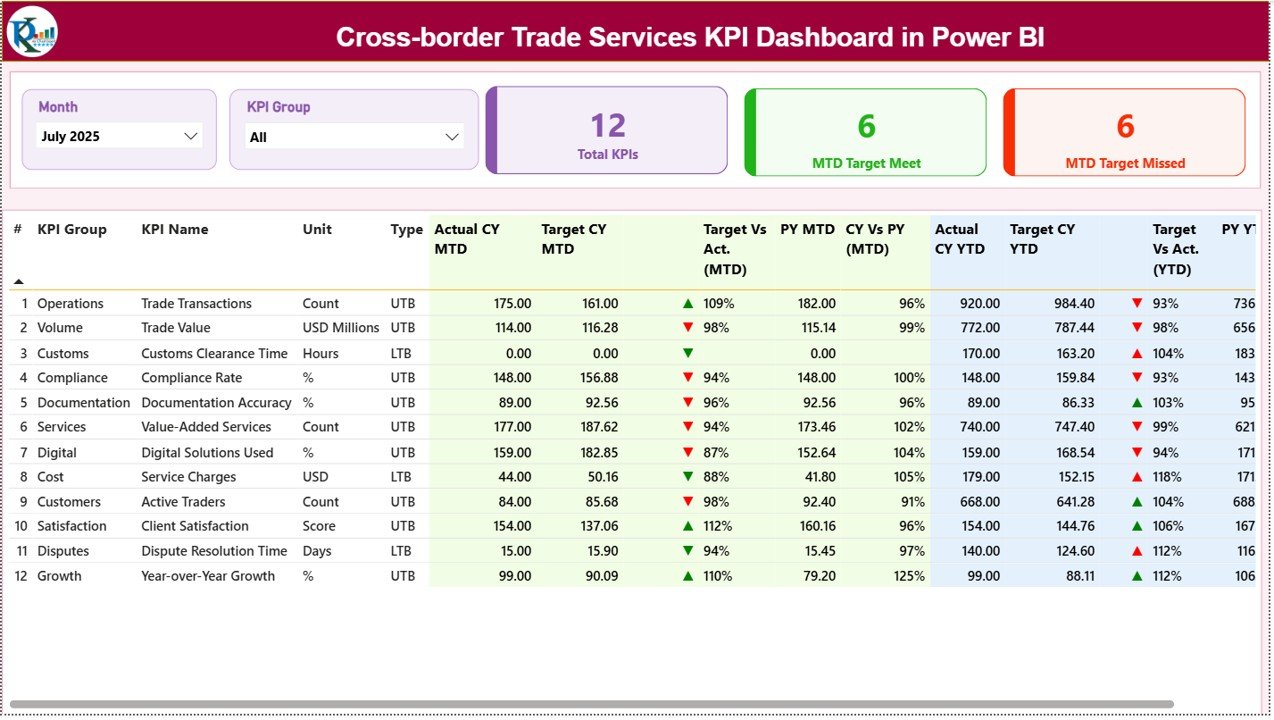
The Power BI edition for teams that want interactive, refreshable trade analytics on top of their inventory data. Slice shipment and cost KPIs the way a BI tool would, at a template price.
Who it is for: data-forward logistics teams already using Power BI.
- Interactive slicers by lane, supplier and period
- Refreshable from your trade and stock exports
- Drill-through from summary to shipment detail
- Shareable in the Power BI service
Build a self-serve trade view for finance, monitor duty and freight as a share of landed cost, or fold trade KPIs into a wider ops report. At $11.99. Get the cross-border trade Power BI dashboard →
Best for: Power BI shops that want trade analytics without a new platform.
How to choose between them
| If your priority is… | Pick this | Format |
|---|---|---|
| Overall stock visibility | Construction & Real Estate Inventory Management | Excel |
| Never running out of stock | Out-of-Stock Rate KPI Dashboard | Power BI |
| Getting orders out accurately | Order Fulfillment KPI Dashboard | Excel |
| Shipping faster | Order Cycle Time KPI Dashboard | Excel |
| Cheapest cloud, multi-user option | Order Fulfillment KPI Dashboard | Google Sheets |
| International / landed-cost stock | Cross-border Trade Services | Excel or Power BI |
Rule of thumb: choose the format your team already lives in. If everyone shares Google Workspace, take the $9.99 Sheets editions. If your data is already in Power BI, take the Power BI pair. If you build reports in Excel, start with the inventory management dashboard and add order KPIs as you grow.
The switching math: Fishbowl vs a template stack
Here is the arithmetic that drives the decision. Using Fishbowl’s published starting price of roughly $329/month billed annually, a single Fishbowl Drive plan is about $3,948 per year. Add extra users or Fishbowl Advanced modules and it climbs from there. That is a recurring cost every year you keep the software.
| Cost line | Fishbowl (Drive, published start) | NGT template stack |
|---|---|---|
| Year 1 | ~$3,948 | $9.99–$14.99 per template |
| Year 2 | ~$3,948 again | $0 (you already own it) |
| Year 3 | ~$3,948 again | $0 |
| All four core dashboards | — | ~$50 one-time |
| 3-year total | ~$11,844+ | ~$50 |
Buy the four core dashboards in this guide — inventory, out-of-stock, fulfillment and cycle time — and you spend roughly $50 once against Fishbowl’s ~$3,948 every year. Over three years that is about $11,844 versus $50. The trade-off is real and worth stating plainly: you give up live transaction control and automation to keep the reporting. For teams whose true need is visibility, the savings fund a lot of other tools. Compare the same math on the BI side in our Domo dashboard alternatives breakdown.
When Fishbowl is still the right call
Being honest about this earns your trust and saves you a refund. A template is the wrong answer — and Fishbowl (or a full inventory platform) is worth its price — when:
- You need live barcode scanning. Templates report on data; they do not run a handheld scanner or update stock in real time as items move. Fishbowl does.
- You run manufacturing with work orders and BOMs. Multi-level bills of materials, work-order routing and component consumption are exactly what Fishbowl Advanced is built for. A dashboard cannot replace that.
- You have deep QuickBooks/Xero two-way sync needs. Fishbowl writes back to your accounting system automatically; a template is a manual reconciliation layer.
- Multiple warehouses with live transfers. If stock moves between locations hourly and must stay accurate to the unit, you need transactional software, not a periodic report.
- Regulatory lot/serial traceability. Recall-grade lot tracking belongs in a validated system of record.
If any of those describe you, keep Fishbowl — and consider using these templates alongside it as a lightweight KPI reporting layer for leadership. The templates shine when your real need is visibility and reporting, not live transaction control.
Once you have chosen a Fishbowl alternative, measure whether it is actually working: our guide to the 12 inventory KPIs to track in 2026 gives the formula and benchmark range for every metric these dashboards report.
Frequently asked questions
What is the best Fishbowl alternative for a small team?
For most small teams, the Construction & Real Estate Inventory Management KPI Dashboard in Excel ($12.99) is the best Fishbowl alternative. It covers stock levels, targets and trends in one editable file, with no monthly seat fee and no platform to administer.
How much does Fishbowl cost in 2026?
Per Fishbowl’s official pricing page, Fishbowl Drive starts around $329/month billed annually, and Fishbowl Advanced is quote-only through a sales call. Exact figures depend on seats and modules, so a five-person team commonly exceeds $4,000 per year before add-ons.
Can an Excel template really replace Fishbowl?
For reporting and KPI tracking, yes. Excel and Google Sheets templates replace Fishbowl’s stock, fulfillment and order-speed reports for a one-time $9.99–$14.99. They do not replace live barcode scanning, manufacturing work orders or automatic accounting sync — keep Fishbowl if you need those.
Is there a free Fishbowl alternative?
Free spreadsheet trackers exist but usually break past a few hundred SKUs and lack proper KPI logic. A paid template at $9.99–$14.99 gives you tested formulas, a definition tab and a clean dashboard — still a one-time cost far below any subscription. If you want to start free, our guide to free inventory templates lists 8 tested options.
Which format should I choose: Excel, Google Sheets or Power BI?
Pick the tool your team already uses. Choose Google Sheets ($9.99) for shared cloud access like Fishbowl Drive, Excel ($12.99–$14.99) for offline power and printing, and Power BI ($11.99) for interactive, refreshable analytics you can slice and drill through.
Do these templates track out-of-stock and reorder points?
The Out-of-Stock Rate KPI Dashboard in Power BI ($11.99) tracks stockout rate by SKU and period so you can act before you sell out. You set your own reorder thresholds; the dashboard shows how often you breach them and where the risk concentrates.
Will these work for a manufacturing business?
They report on manufacturing inventory and order KPIs, but they do not run work orders, bills of materials or component consumption. If manufacturing control is your core need, keep Fishbowl Advanced and use these dashboards as a leadership reporting layer on top.
Are the templates one-time purchases or subscriptions?
Every template here is a one-time purchase between $9.99 and $14.99 — you own the file and can edit it forever. There is no per-seat renewal, unlike Fishbowl’s monthly subscription. That is the core saving that makes switching worthwhile for small teams.
Can multiple people use the template at once?
The Google Sheets editions ($9.99) support real-time multi-user collaboration in any browser, closely matching Fishbowl Drive’s cloud model. Excel files can be co-authored via OneDrive or SharePoint, and Power BI reports can be shared through the Power BI service.
What other business tools can I replace with templates?
NextGenTemplates offers the same swap for other SaaS categories — see our Salesforce CRM alternatives in Excel, Zoho CRM alternatives and BambooHR HR alternatives for the CRM and HR sides of your stack.
Get more inventory templates
Ready to drop the monthly Fishbowl bill? Start with the Construction & Real Estate Inventory Management KPI Dashboard in Excel at $12.99 for stock visibility, or the Order Fulfillment KPI Dashboard in Google Sheets at $9.99 for a cloud, multi-user swap for Fishbowl Drive. Every template is a one-time purchase you own and edit forever.
See more inventory and dashboard walkthroughs on the NextGenTemplates YouTube channel, and browse the full range of order and inventory KPI dashboards to build the exact reporting layer your team needs — without a subscription.