

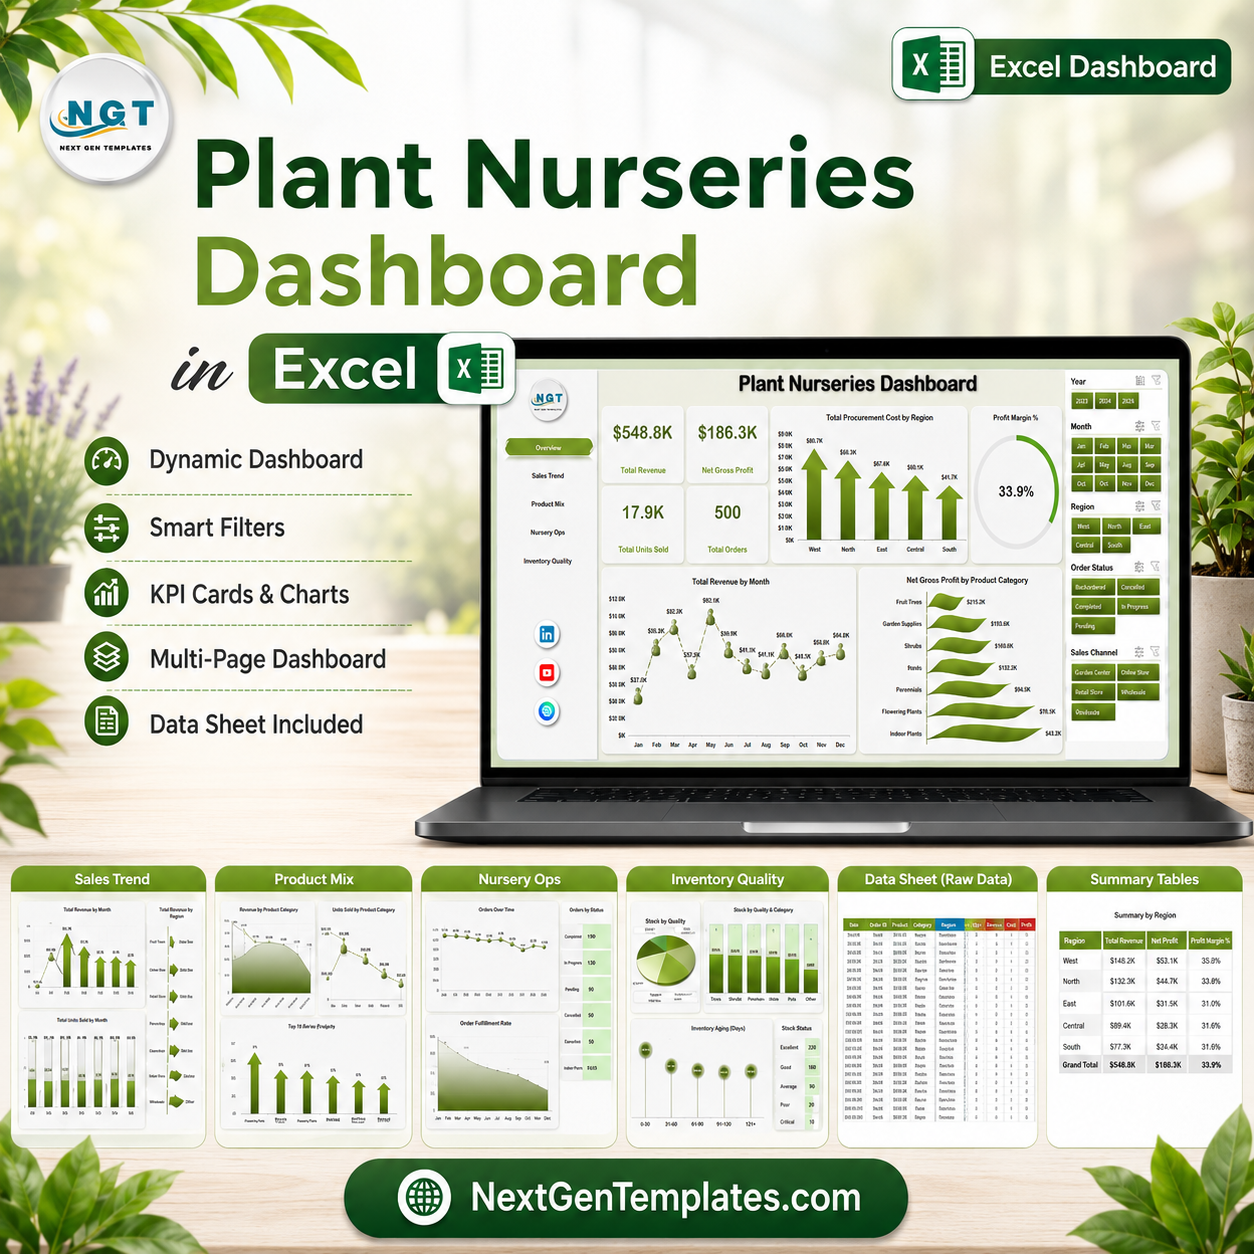


Plant Nurseries Dashboard in Excel helps nursery owners, garden center managers, procurement teams, and operations analysts track revenue, gross profit, units sold, orders, procurement cost, loss %, fulfillment %, product mix, quality rating, regions, nurseries, sales channels, cities, customer types, and staff performance in one editable workbook. Many plant nurseries manage 500+ monthly order, inventory, and fulfillment records across plants, pots, supplies, and sales channels, but reporting gets slow when sales, procurement, and quality data live in separate files. For $17.99 one-time, this Excel dashboard gives you 5 reporting pages, KPI cards, slicers, a structured Data Sheet, and a pivot-powered Support Sheet.
Key Features of Plant Nurseries Dashboard in Excel
- 5 dashboard pages for Overview, Sales Trend, Product Mix, Nursery Ops, and Inventory Quality analysis.
- 4 executive KPI cards for Total Revenue, Net Gross Profit, Total Units Sold, and Total Orders.
- Procurement and profitability tracking using procurement cost, gross profit, profit margin %, loss %, and region-level performance.
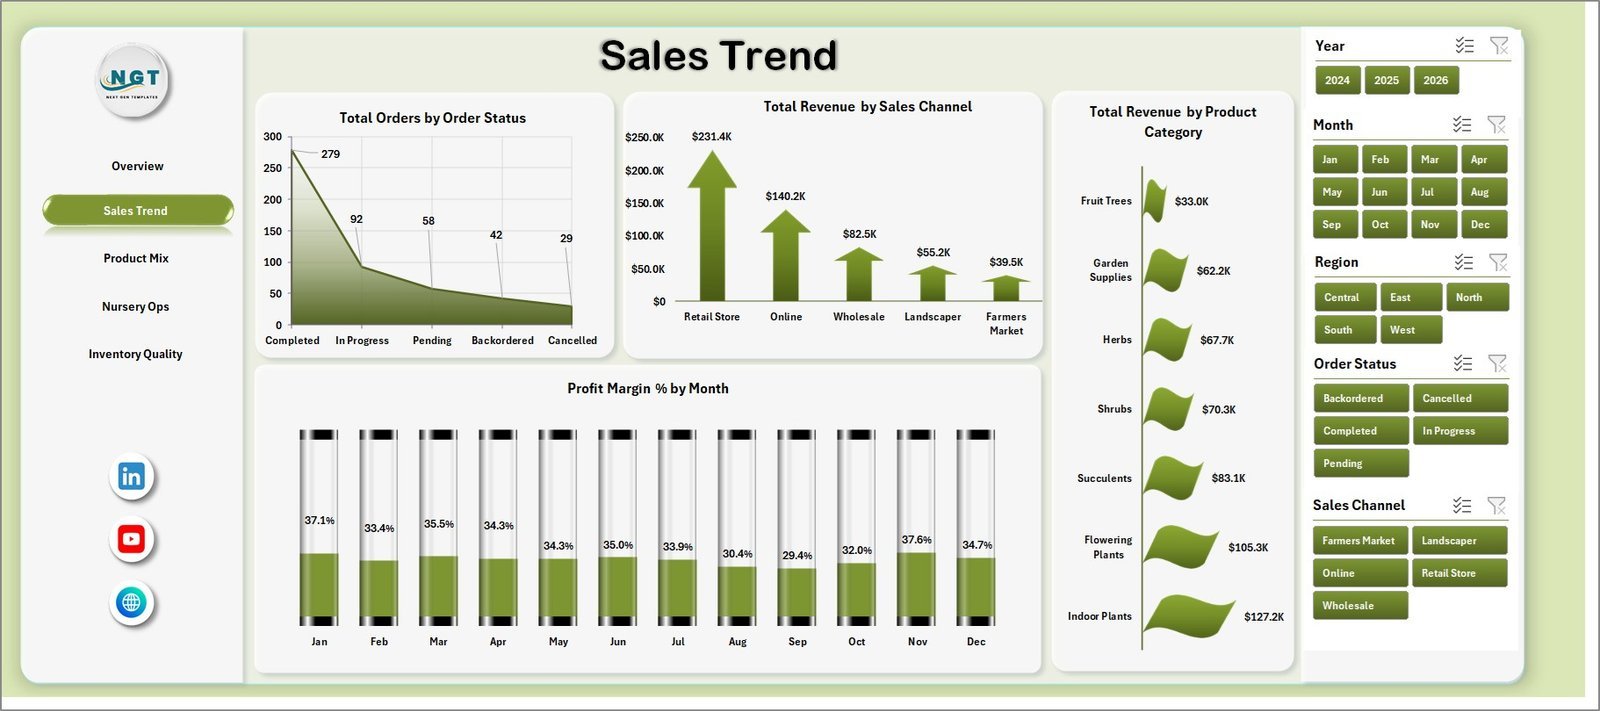
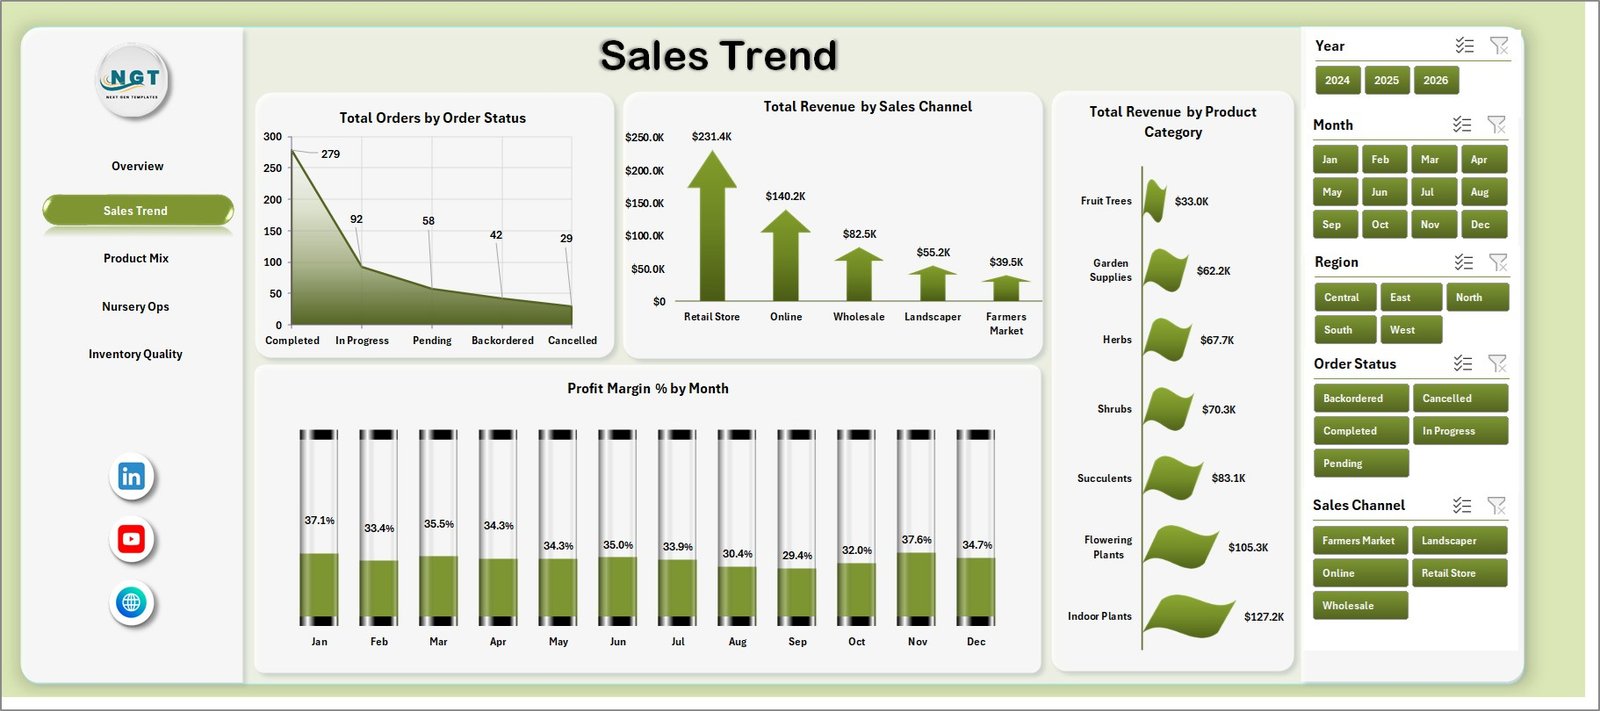
- Sales trend reporting by order status, sales channel, product category, and monthly profit margin.
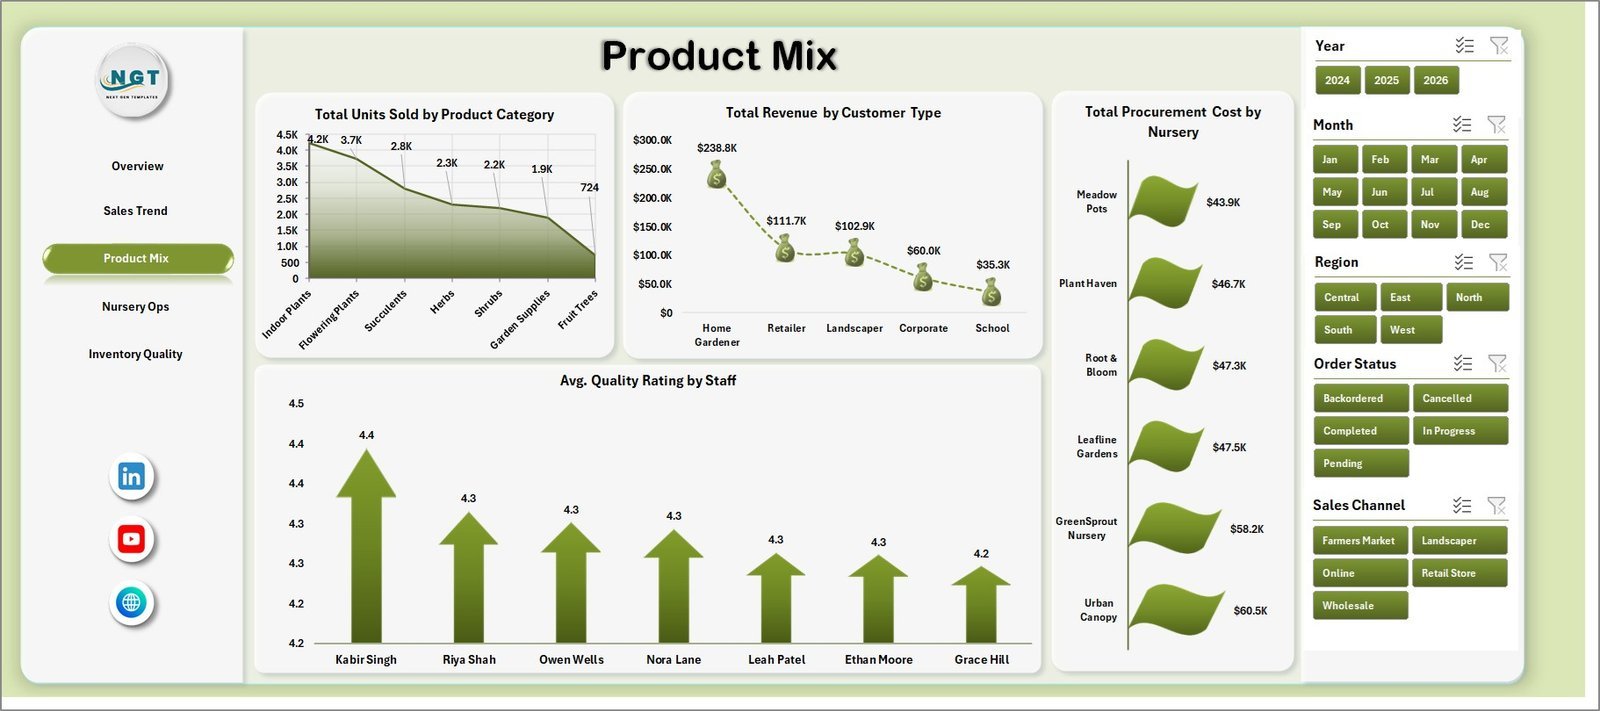
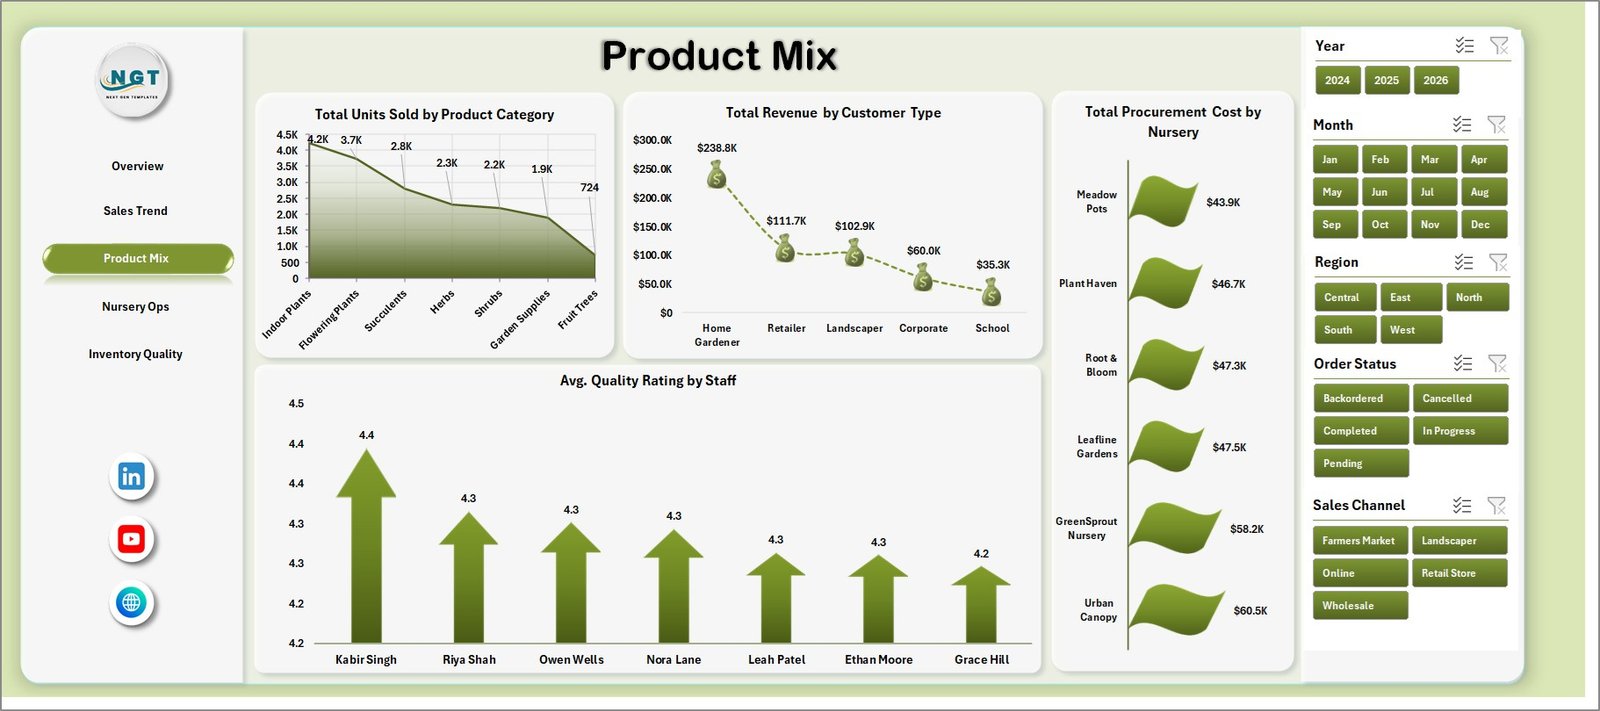
- Product mix analysis by units sold, customer type, nursery, procurement cost, and staff quality rating.
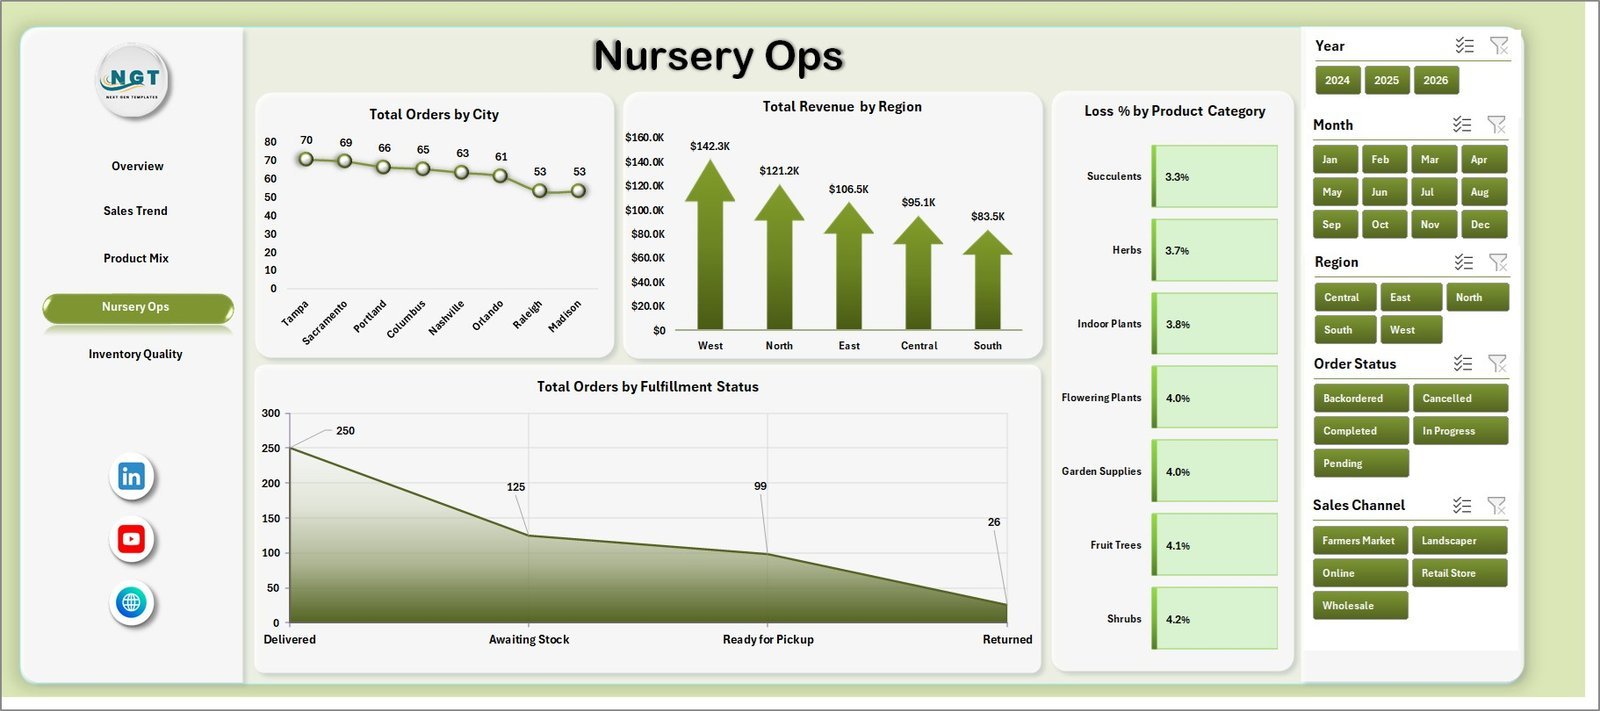
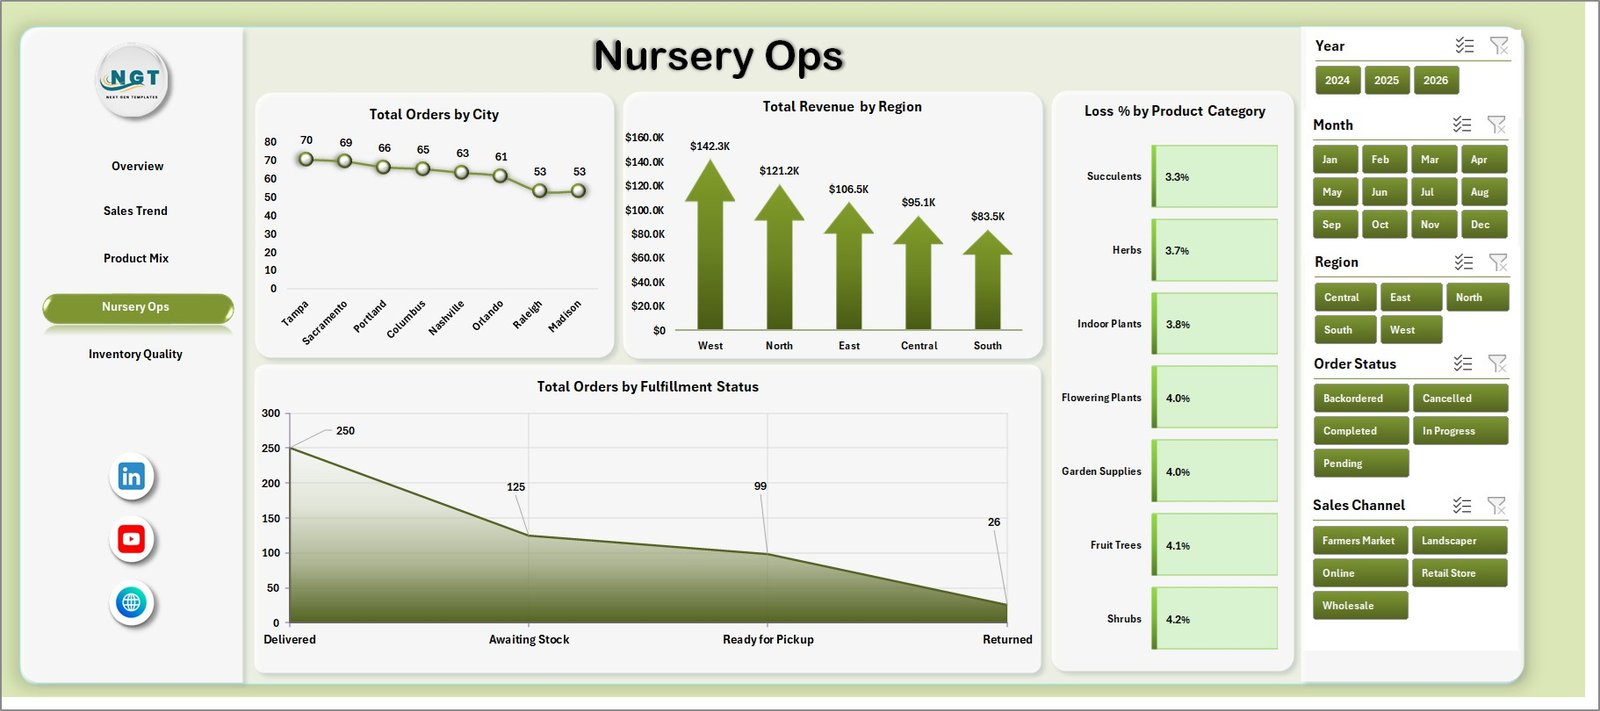
- Operations view for orders by city, revenue by region, loss % by product category, and fulfillment status.
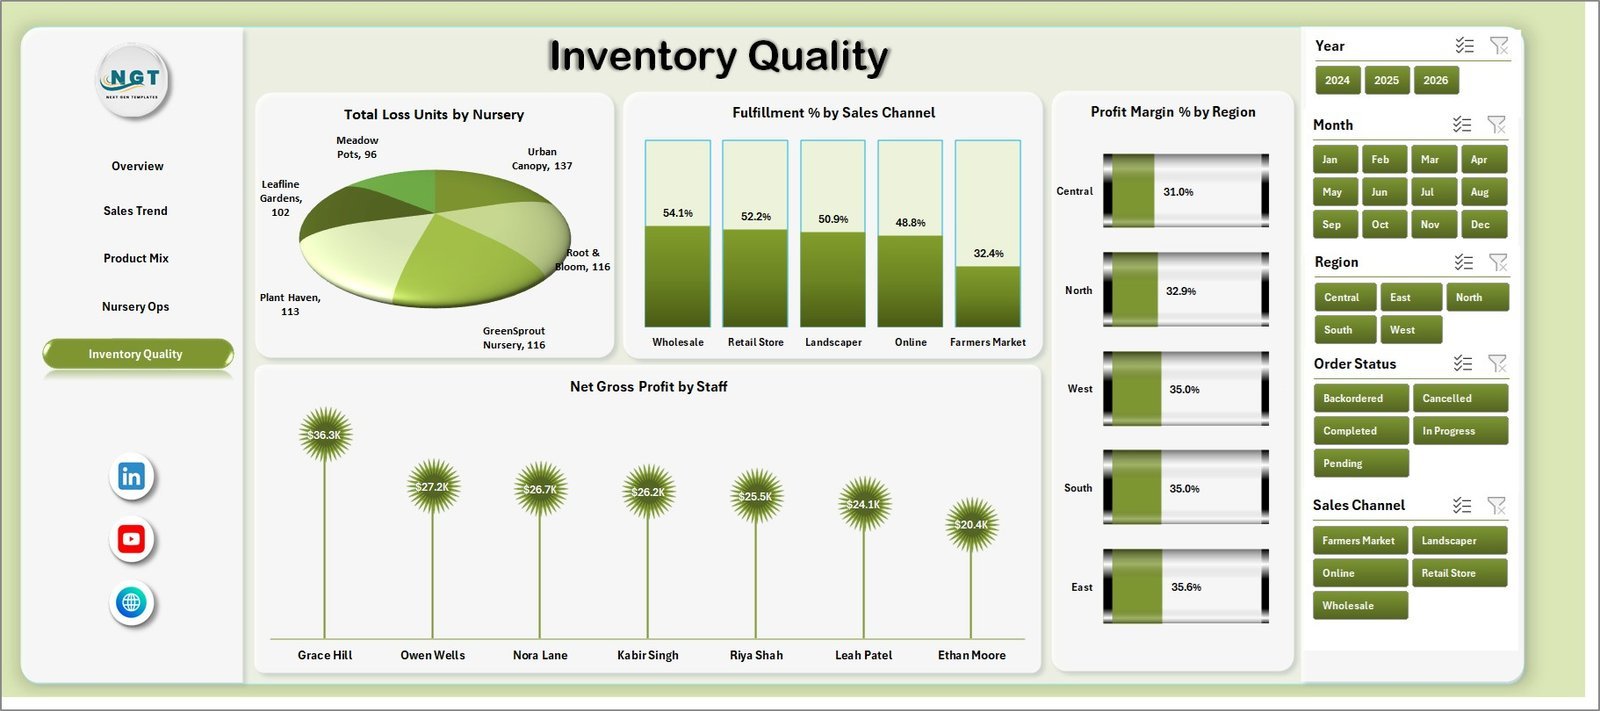
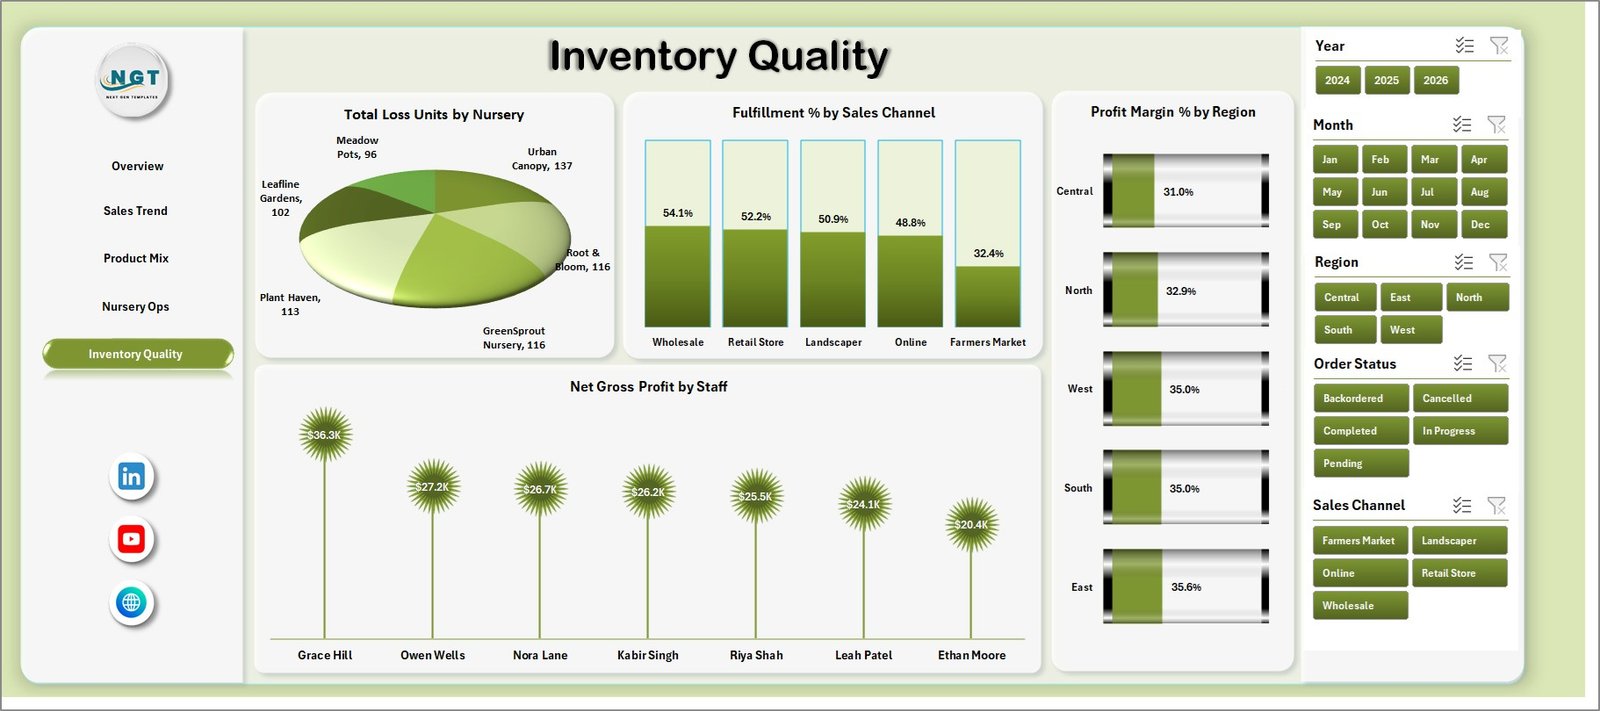
- Inventory quality page for loss units, fulfillment %, regional margin, and staff-level gross profit.
- Interactive slicers for quick filtering during weekly sales, nursery operations, procurement, and inventory meetings.
- Excel Data Sheet and Support Sheet so users can replace sample data, click Refresh All, and update every pivot and chart.
What’s Inside the Plant Nurseries Dashboard in Excel
1. Overview Page
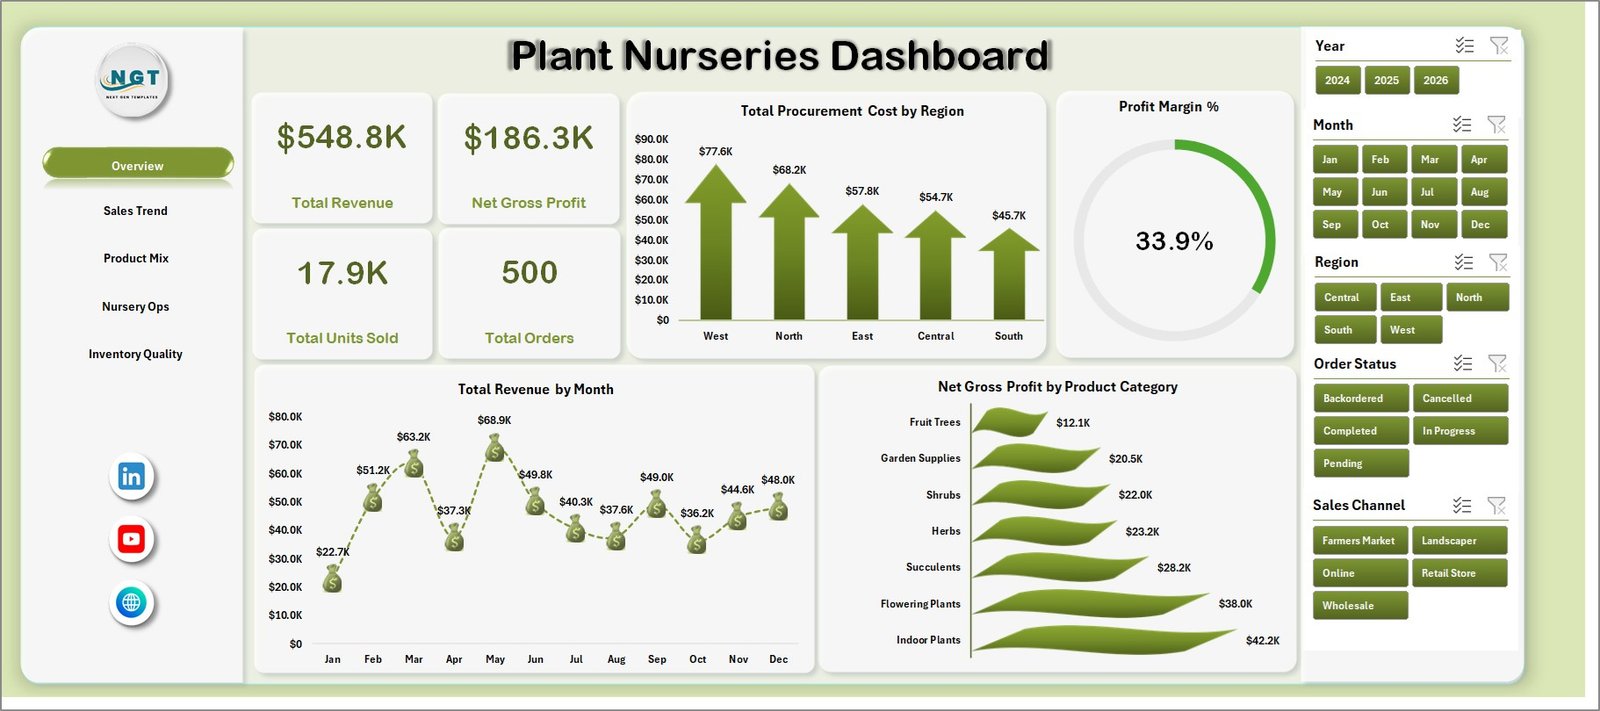
The Overview page gives a high-level snapshot of nursery performance. The top cards show Total Revenue, Net Gross Profit, Total Units Sold, and Total Orders, helping users review sales volume, margin health, and order activity before moving into detailed pages.
Total Procurement Cost by Region: This chart compares procurement spending across regions. It helps identify where plant sourcing, supplier costs, or regional operating inputs are creating higher cost pressure.
Profit Margin % by Overall Dashboard: This visual summarizes overall profitability as a percentage. It helps owners see whether sales growth is converting into healthy margin after procurement and loss impact.
Total Revenue by Month: This chart shows month-wise revenue movement. It is useful for spotting seasonal demand patterns, peak planting periods, and slower sales months.
Net Gross Profit by Product Category: This chart ranks plant and nursery product categories by gross profit contribution. It helps teams decide which categories deserve more promotion, shelf space, or stock planning attention.
2. Sales Trend
The Sales Trend sheet explains how orders and revenue behave across status, channel, category, and month. Total Orders by Order Status helps managers compare completed, pending, cancelled, or returned orders. Total Revenue by Sales Channel shows whether retail, wholesale, online, or other channels are driving sales. Total Revenue by Product Category identifies stronger product groups, while Profit Margin % by Month shows whether monthly revenue is supported by acceptable profitability.
3. Product Mix
The Product Mix sheet helps users understand which categories, customers, nurseries, and staff members are shaping business results. Total Units Sold by Product Category shows demand volume by category. Total Revenue by Customer Type compares revenue from retail, wholesale, landscape, or other customer segments. Total Procurement Cost by Nursery highlights nursery-level cost concentration, and Avg. Quality Rating by Staff supports quality and service review.
4. Nursery Ops
The Nursery Ops sheet focuses on location, region, losses, and fulfillment. Total Orders by City helps teams understand order volume by service area. Total Revenue by Region compares regional sales contribution. Loss % by Product Category highlights categories with spoilage, damage, or shrinkage risk, and Total Orders by Fulfillment Status shows how many orders are completed, pending, delayed, or cancelled.
5. Inventory Quality
The Inventory Quality sheet brings loss, fulfillment, margin, and staff contribution into one place. Total Loss Units by Nursery identifies nurseries with higher damaged or unsold units. Fulfillment % by Sales Channel compares how reliably each channel completes orders. Profit Margin % by Region reveals stronger and weaker regional margins, while Net Gross Profit by Staff shows staff-level gross profit contribution.
6. Data Sheet Tab
The Data Sheet is where you add your own nursery records in the same format as the sample data. Keep the column structure unchanged so slicers, pivot tables, cards, and charts continue working correctly after refresh.

7. Support Sheet
The Support Sheet contains the pivot tables that power the dashboard dynamically. After updating the Data Sheet, go to the Excel Ribbon, open the Data tab, and click Refresh All. All pivots and charts will refresh. You can keep this sheet hidden, but do not delete it.

Plant Nurseries Dashboard in Excel vs. Google Sheets vs. Paid CRM/SaaS – Where This Fits
| Feature | Plant Nurseries Dashboard in Excel | Google Sheets Dashboard | Paid Retail or Nursery SaaS |
|---|---|---|---|
| Cost | $17.99 one-time | Low cost but often manual to build | Monthly or annual subscription |
| Platform | Microsoft Excel | Browser-based spreadsheet | Vendor-hosted web app |
| Setup time | Replace data and click Refresh All | Build formulas, pivots, and sharing | Onboarding and configuration |
| Real-time team collaboration | Possible through OneDrive or SharePoint | Native collaboration | Usually included |
| Mobile access | Depends on Excel and file storage setup | Strong mobile access | Usually included |
| Customizable fields | Editable workbook, sheets, pivots, and charts | Editable but requires chart maintenance | Often limited by vendor plan |
| Share with link | Possible through Microsoft 365 storage | Native link sharing | Vendor-controlled access |
| Year-1 cost at 5 users | Template price plus existing Excel access | Your build and maintenance time | Often hundreds or thousands per year |
| Nursery-specific analytics | Revenue, orders, procurement, loss, fulfillment, quality, staff, and region analysis included | Must be built manually | Depends on reporting module |
Who This Template Is For – and Who It’s Not For
This template is for plant nursery owners, garden center managers, greenhouse teams, procurement teams, inventory leads, agriculture analysts, retail operations managers, and consultants who need a repeatable Excel reporting format. It is especially useful when your business already exports order, procurement, and inventory records but needs a cleaner dashboard.
It is not a live POS system, barcode scanner, accounting system, supplier portal, greenhouse automation tool, or ERP. Use it for reporting and decision support, not for real-time stock deduction or payment processing.
How to Use the Plant Nurseries Dashboard in Excel
- Download and unzip the Excel dashboard file.
- Open the workbook in Microsoft Excel.
- Go to the Data Sheet and replace the sample rows with your own plant nursery records.
- Keep the same column names and structure.
- Click Data and then Refresh All in the Excel Ribbon.
- Review the Overview, Sales Trend, Product Mix, Nursery Ops, and Inventory Quality sheets.
- Use slicers to filter by period, region, nursery, product category, customer type, channel, status, or other included fields.
- Keep the Support Sheet hidden after setup if you want a cleaner workbook for users.
Real-World Use Cases
Anika, nursery owner: reviews Total Revenue, Net Gross Profit, Total Units Sold, and Total Orders every Monday before deciding which product categories need more promotion.
Rohan, procurement manager: compares procurement cost by region and nursery to identify sourcing areas that need supplier negotiation or stock planning review.
Meera, operations analyst: uses loss %, fulfillment %, quality rating, and staff profit contribution to prepare monthly management reports for multiple nursery locations.
Frequently Asked Questions
What does the Plant Nurseries Dashboard in Excel track?
It tracks revenue, net gross profit, units sold, orders, procurement cost, product category, sales channel, customer type, nursery, city, region, loss %, fulfillment status, fulfillment %, quality rating, and staff performance.
Can I use my own nursery data?
Yes. Add your records in the Data Sheet using the same structure, then click Data and Refresh All so the pivot tables, slicers, cards, and charts update.
Do I need advanced Excel skills?
No. Basic Excel skills are enough to replace data, refresh the workbook, and use slicers. Advanced users can customize visuals, formulas, and pivot tables if needed.
Can I hide the Support Sheet?
Yes. The Support Sheet can be hidden after setup. It should not be deleted because it contains pivot tables used by the dashboard.
Is this a live inventory system?
No. This is a reporting dashboard for prepared data. It does not replace POS billing, barcode scanning, live stock movement, or ERP inventory control.
Does it work for multiple nursery locations?
Yes. The dashboard includes city, region, nursery, and channel views, making it useful for comparing multiple branches, growing locations, or sales territories.
About the Author
Built by PK – Microsoft Certified Professional with 15+ years of Excel, Google Sheets, and Power BI experience. Founder of NextGenTemplates, reaching 300K+ subscribers across YouTube channels. Every template is hand-built and tested before release.
Explore Related Templates
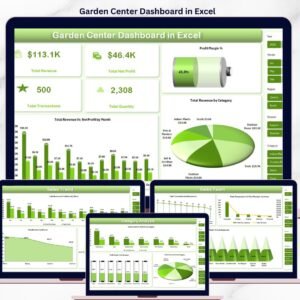
Pair this dashboard with Garden Center Dashboard in Excel, Garden Center Dashboard in Power BI, Organic Seeds Providers Dashboard in Power BI, and Floriculture KPI Dashboard in Excel. Browse more Excel Dashboard Templates and MS Excel templates.
Download the Plant Nurseries Dashboard in Excel and start reviewing nursery revenue, procurement, inventory quality, fulfillment, and product mix in one editable workbook.
Last updated: July 24, 2026.













Reviews
There are no reviews yet.