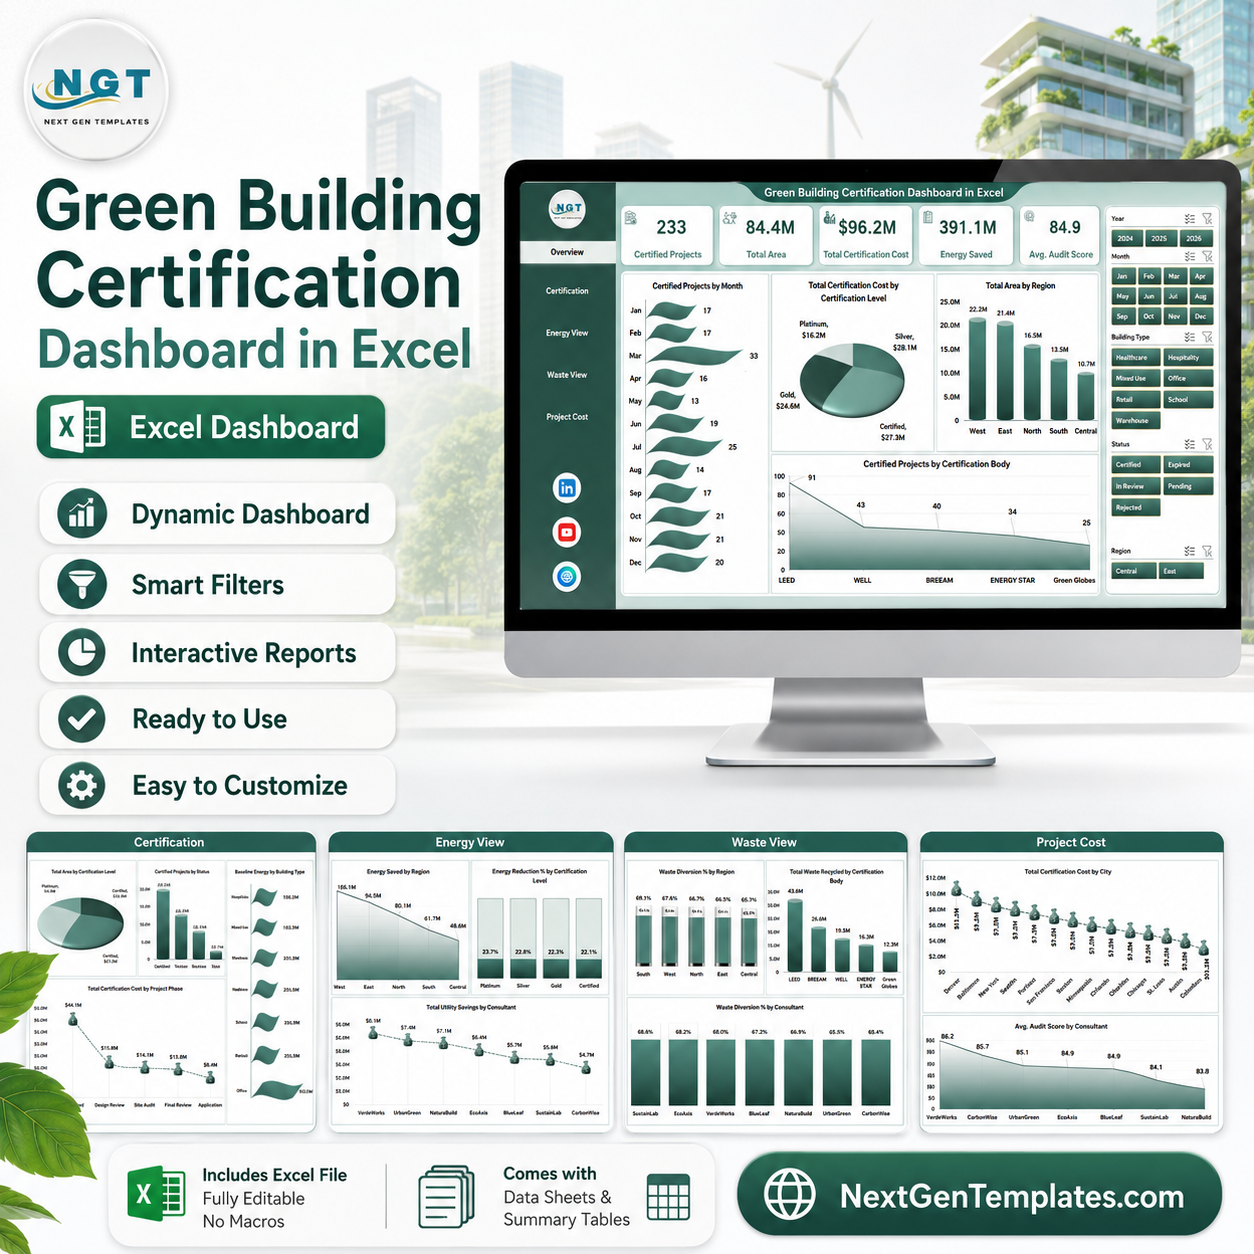
Green Building Certification Dashboard in Excel helps sustainability teams, construction project managers, certification consultants, facility leaders, and ESG analysts track certified projects, total area, certification cost, energy saved, audit score, waste diversion, utility savings, and certification progress in one ready-to-use workbook. The template includes 5 analysis pages, a structured data sheet, and a support sheet powered by pivot tables. Built by a Microsoft Certified Professional with 15+ years of Excel and Power BI experience, it gives teams a one-time purchase reporting tool with no monthly SaaS fee.
Use this Excel dashboard to review LEED, BREEAM, WELL, Green Globes, or other certification programs across buildings, cities, regions, consultants, project phases, and certification bodies. Replace the sample rows in the Data sheet, click Refresh All, and the cards, charts, slicers, and pivot-backed visuals update automatically.
Key Features of Green Building Certification Dashboard in Excel
- 5 dashboard pages for Overview, Certification, Energy View, Waste View, and Project Cost analysis.
- Executive KPI cards for Certified Projects, Total Area, Total Certification Cost, Energy Saved, and Avg. Audit Score.
- Multiple slicers to filter the dashboard quickly by available project, region, phase, status, and certification fields.
- Certification analysis by month, certification level, region, certification body, status, building type, and project phase.
- Energy and utility tracking for energy saved, energy reduction percentage, baseline energy, and total utility savings.
- Waste performance views for waste diversion percentage, waste recycled, waste generated, consultant performance, and building type cost.
- Editable data sheet where users can paste or maintain green building project records in the same format.
- Pivot-powered support sheet that can be refreshed from Excel’s Data ribbon after data changes.
What’s Inside the Green Building Certification Dashboard in Excel
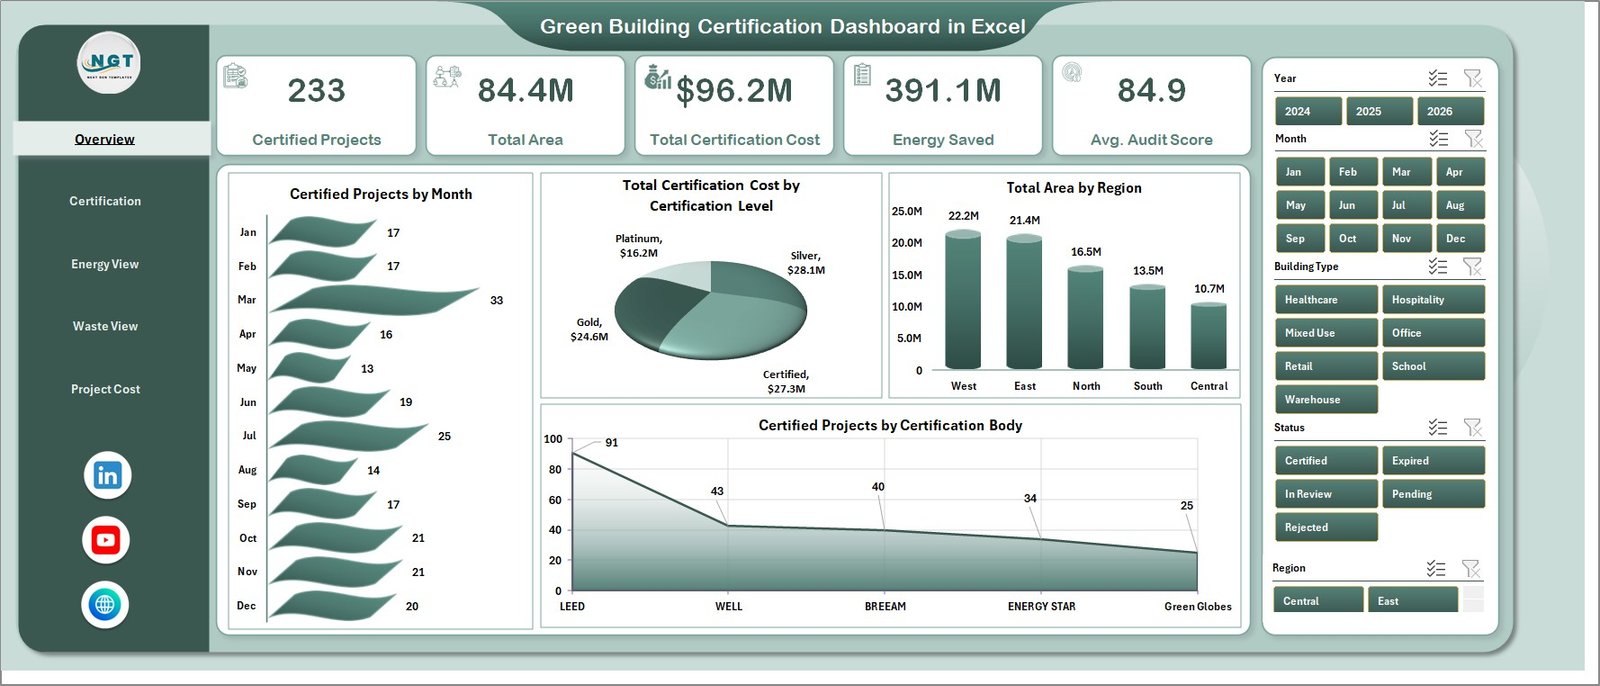
1. Overview Page
The Overview page gives a high-level certification snapshot with cards for Certified Projects, Total Area, Total Certification Cost, Energy Saved, and Avg. Audit Score. These cards help leaders understand portfolio scale, sustainability progress, and cost exposure before reviewing deeper analysis.
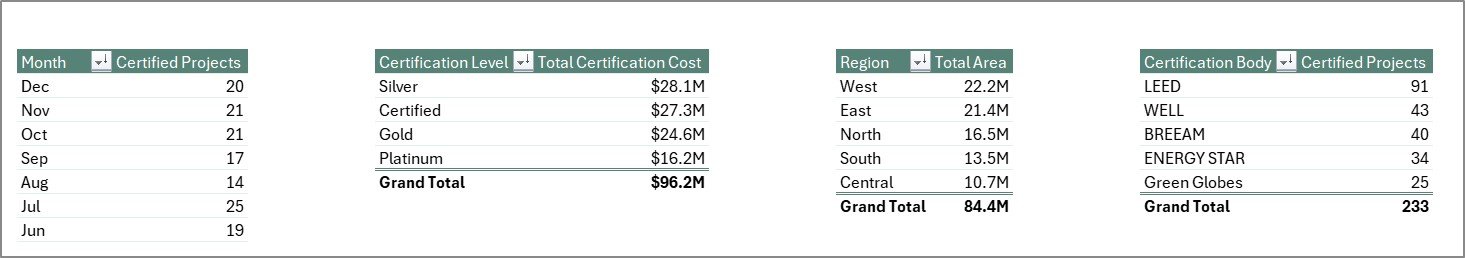
Certified Projects by Month shows how certification activity changes over time and helps identify busy reporting periods. Total Certification Cost by Certification Level compares cost distribution across levels such as Silver, Gold, Platinum, or equivalent certification bands.
Total Area by Region highlights where certified floor area is concentrated across the building portfolio. Certified Projects by Certification Body shows which certification organizations or programs are driving the most completed projects.
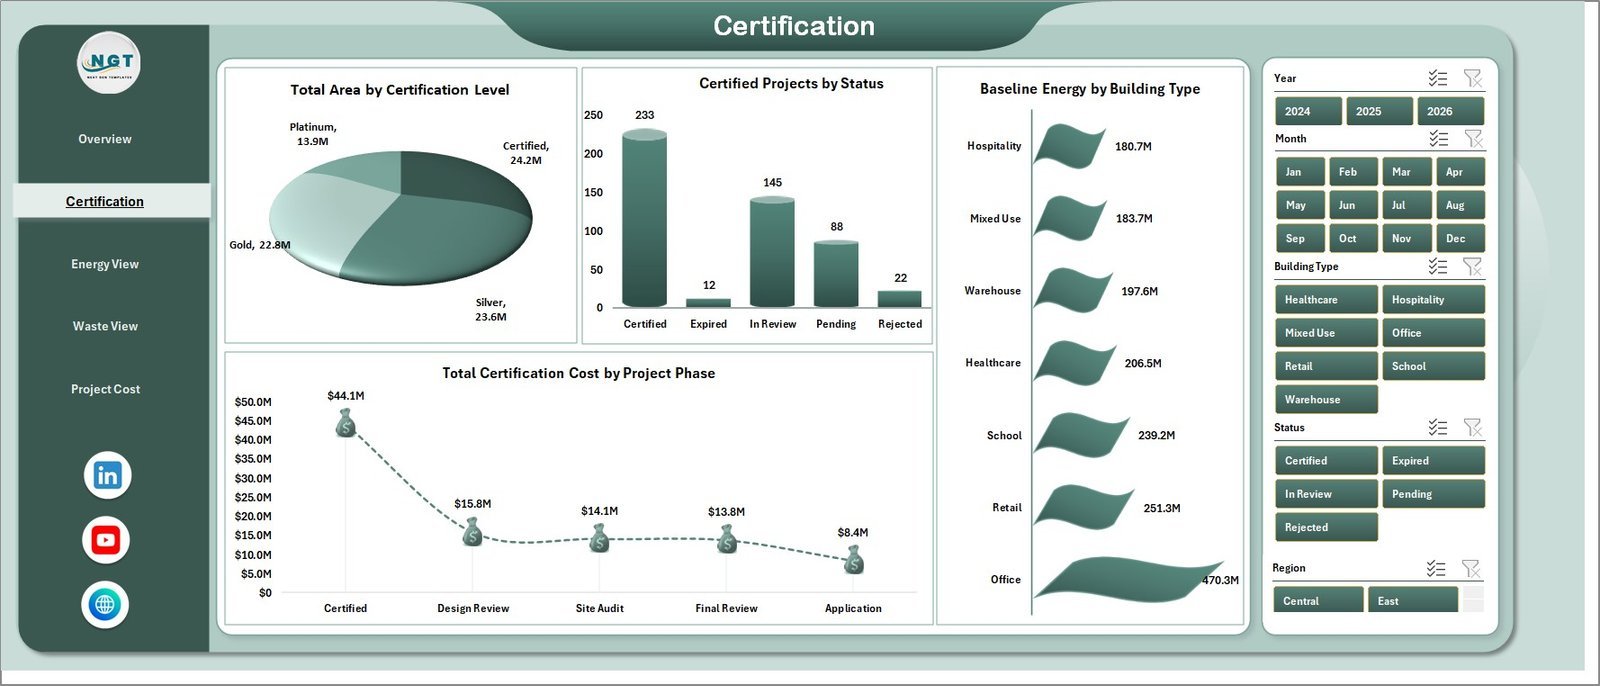
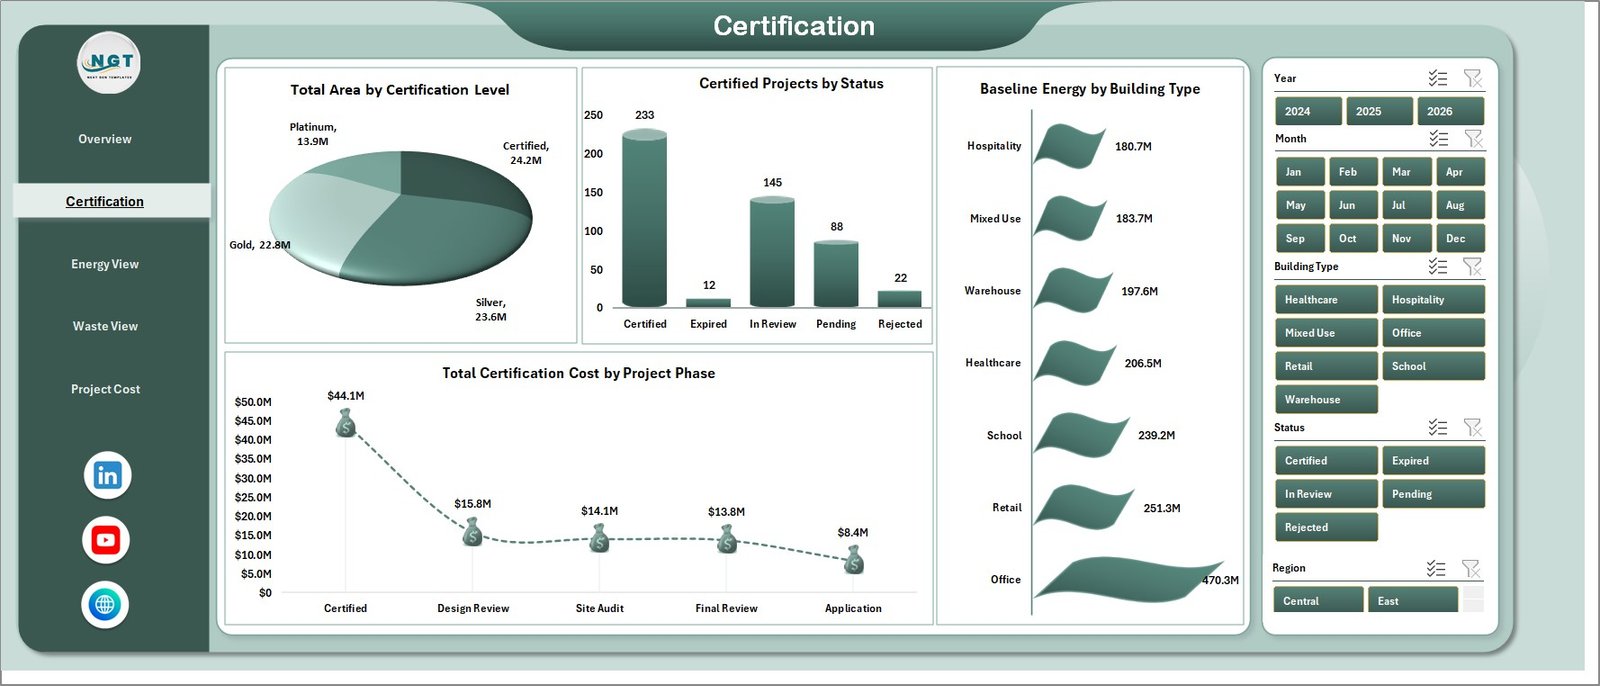
2. Certification Page
The Certification page focuses on project status, certification level, building type, and project phase. Total Area by Certification Level helps compare certified space across achievement tiers. Certified Projects by Status separates completed, in-progress, and pending projects so teams can see pipeline movement.
Baseline Energy by Building Type helps compare starting energy demand before efficiency improvements. Total Certification Cost by Project Phase shows where costs are concentrated across planning, design, construction, audit, and closeout phases.
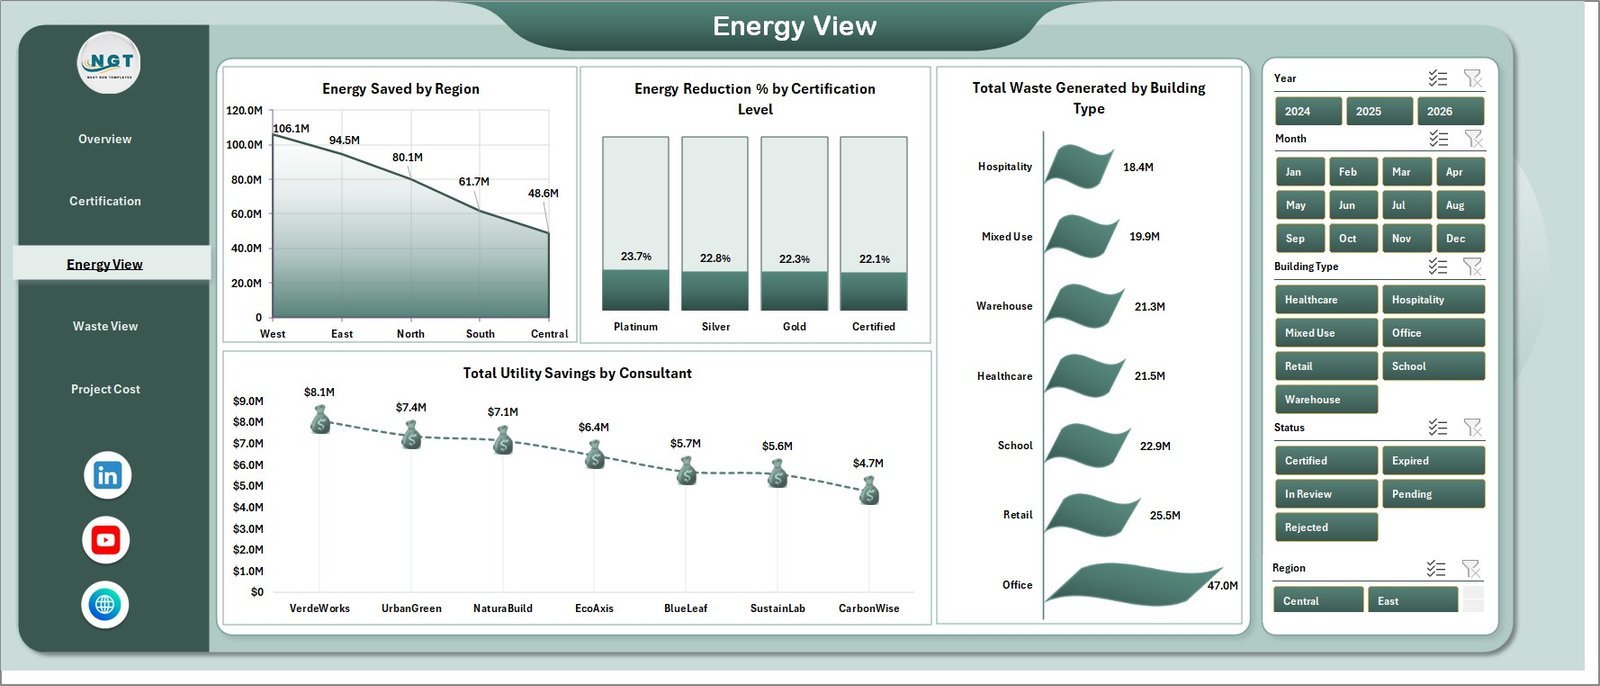
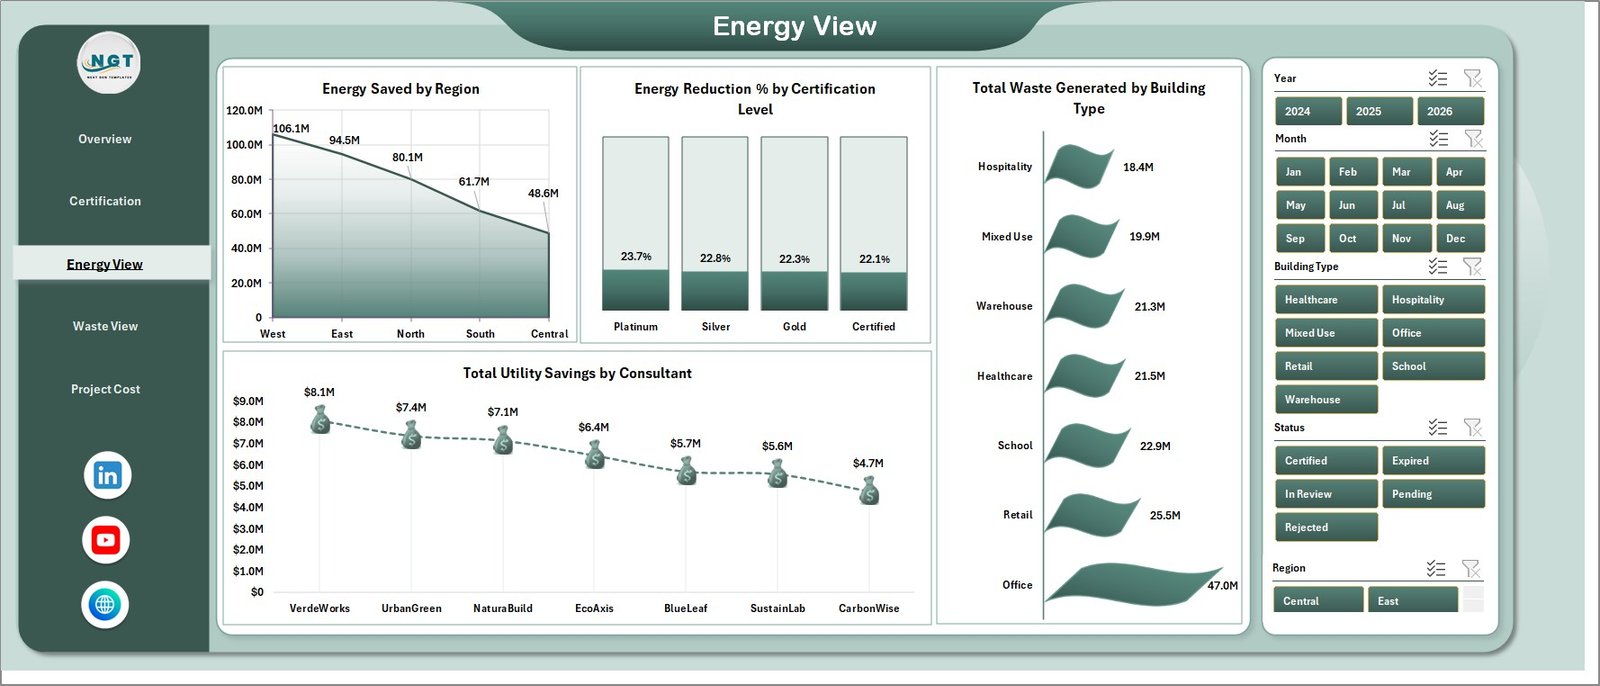
3. Energy View Page
The Energy View page helps teams review efficiency outcomes. Energy Saved by Region compares conservation impact across territories. Energy Reduction % by Certification Level shows whether higher certification tiers are producing stronger energy outcomes.
Total Waste Generated by Building Type connects operational impact with building categories. Total Utility Savings by Consultant helps compare consultant contribution to cost savings and efficiency improvement.
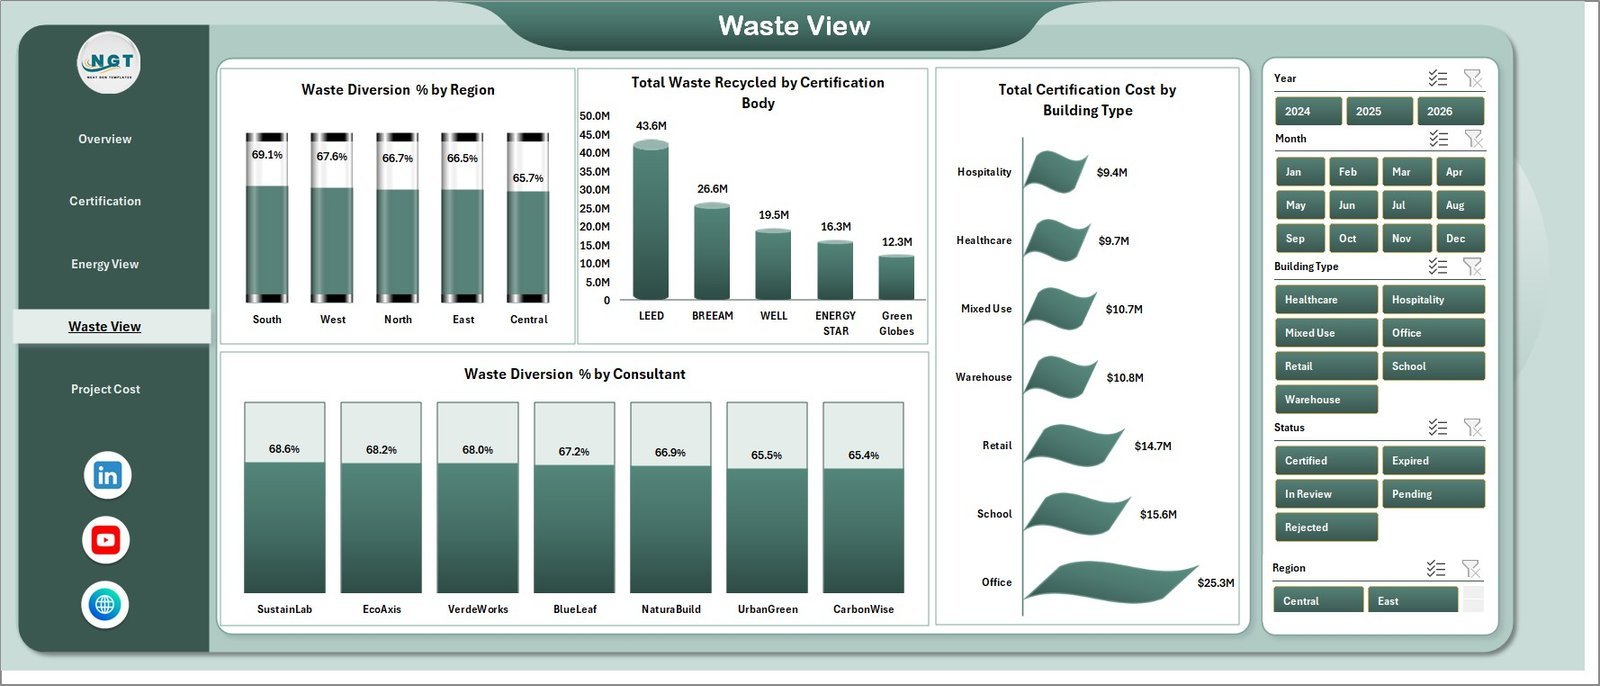
4. Waste View Page
The Waste View page tracks recycling, waste diversion, certification body results, and consultant performance. Waste Diversion % by Region compares waste management outcomes by location. Total Waste Recycled by Certification Body helps teams review recycling contribution by certification program.
Total Certification Cost by Building Type compares cost across offices, campuses, industrial sites, residential buildings, or other building groups. Waste Diversion % by Consultant highlights which consultants are helping projects achieve stronger waste outcomes.

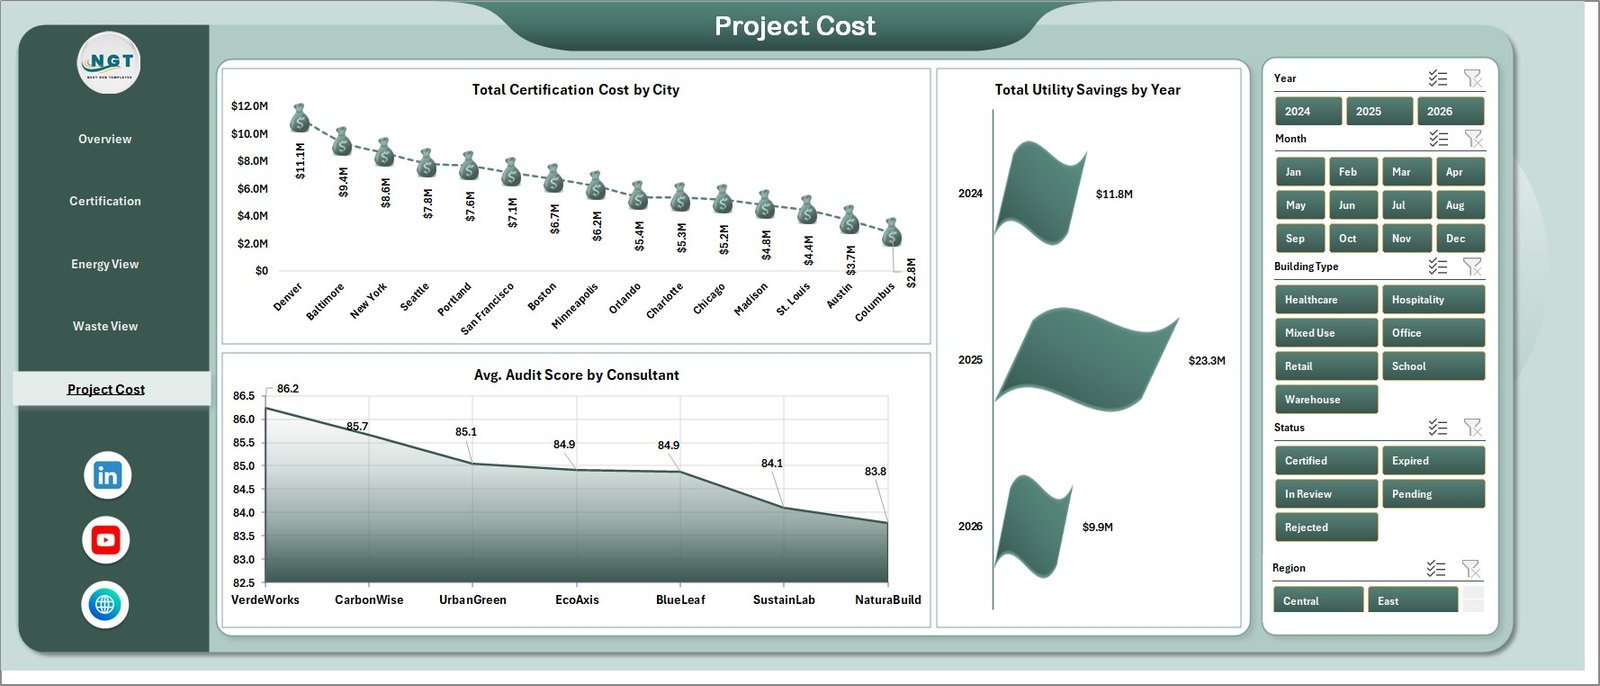
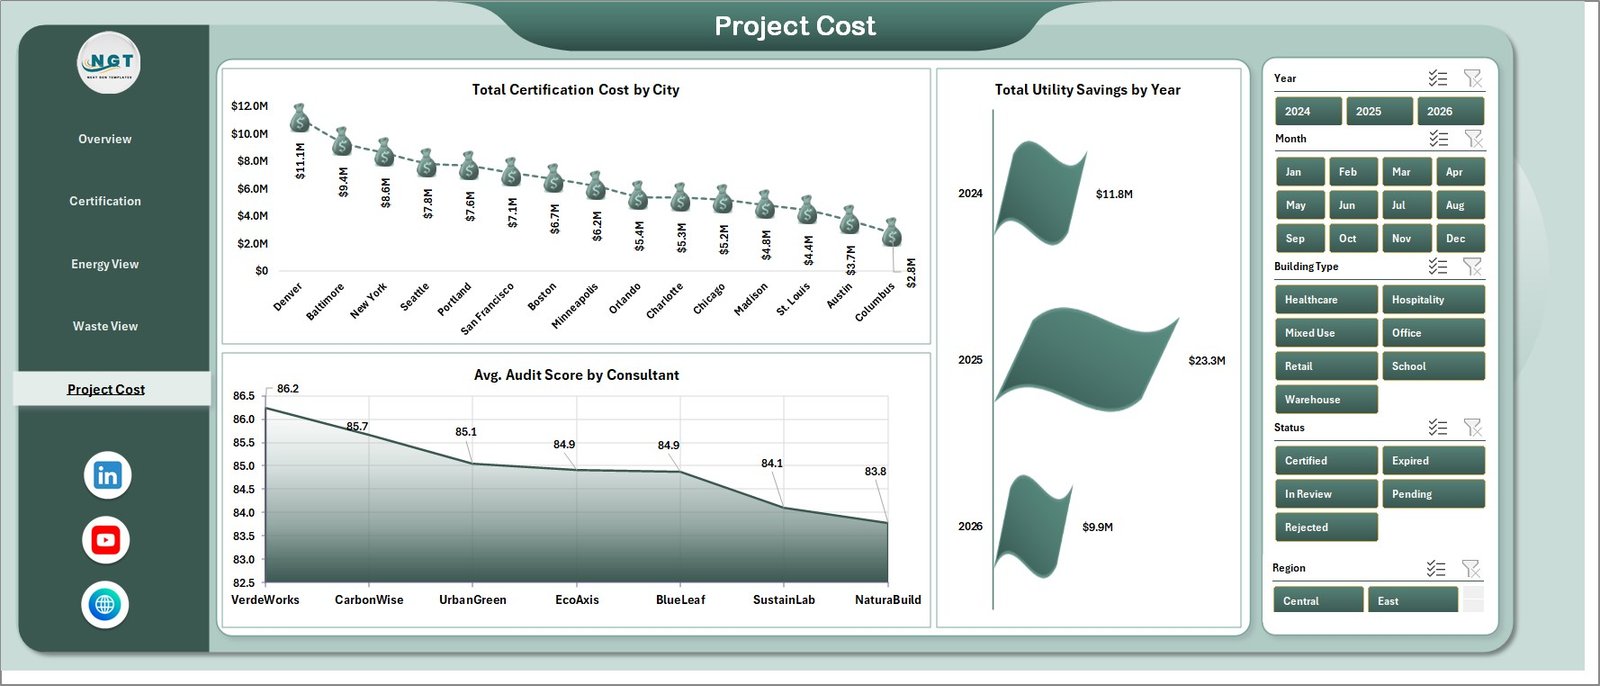
5. Project Cost Page
The Project Cost page supports financial and quality review. Total Certification Cost by City identifies locations with the highest certification spend. Avg. Audit Score by Consultant compares audit quality outcomes by service provider.
Total Utility Savings by Year shows annual savings movement and helps teams evaluate whether green building investments are producing measurable financial returns over time.
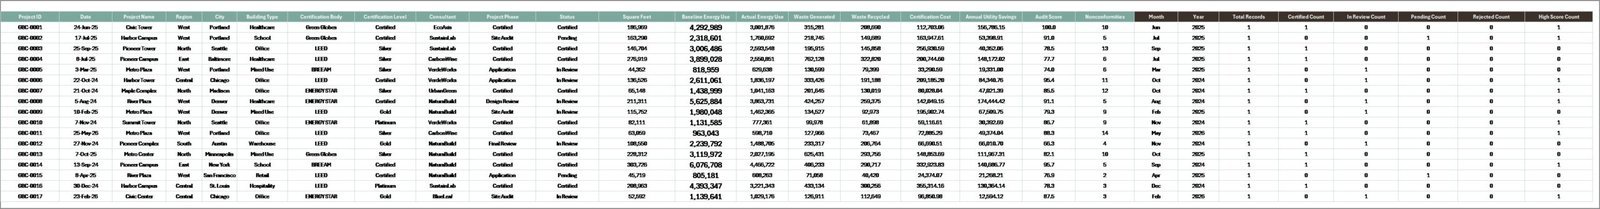
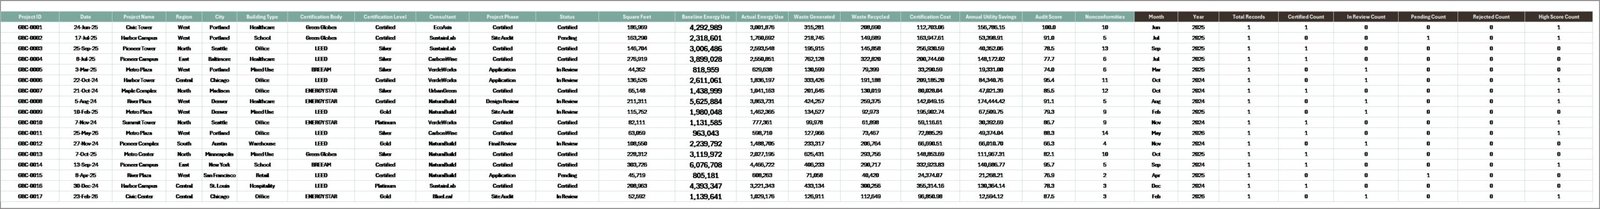
6. Data Sheet Tab
The Data sheet is where you add or replace your project records in the same structured format. Once the data is updated, the dashboard pages can be refreshed without rebuilding charts.
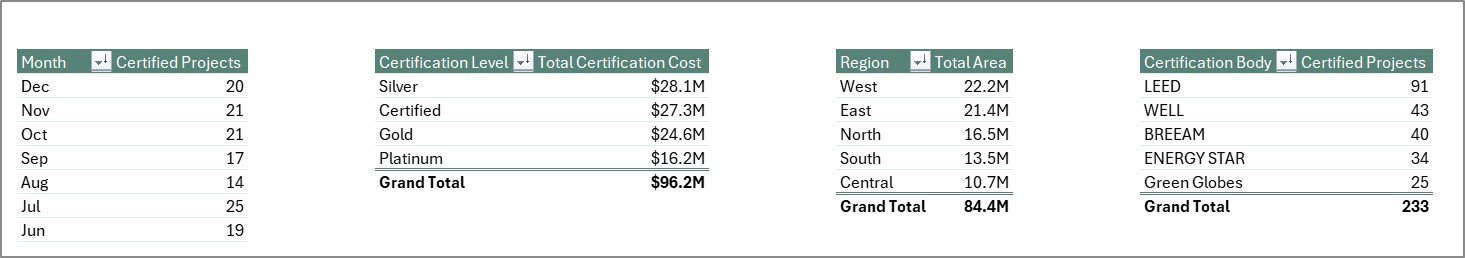
7. Support Sheet Tab
The Support sheet contains the pivot tables used to make the dashboard dynamic. After updating the Data sheet, go to the Data tab in the Excel ribbon and click Refresh All so the pivots and charts refresh together. You can keep this sheet hidden during normal use.
Green Building Certification Dashboard in Excel vs. Google Sheets vs. Paid ESG SaaS – Where This Fits
| Feature | This Excel Dashboard | Google Sheets Alternative | Paid ESG SaaS |
|---|---|---|---|
| Cost | $17.99 one-time | Manual build or template setup | Monthly or annual subscription |
| Platform | Microsoft Excel | Google Sheets | Vendor cloud platform |
| Setup time | Replace data and refresh pivots | Usually requires chart setup | Onboarding and configuration |
| Real-time team collaboration | Available through OneDrive or SharePoint | Native in browser | Usually included by plan |
| Mobile access | Excel mobile app | Sheets mobile app | Usually included |
| Customizable fields | High if you know Excel tables and pivots | High with manual setup | Depends on vendor settings |
| Share with link | Available through Microsoft 365 | Native sharing | Usually login controlled |
| Year-1 cost at 5 users | $17.99 plus any Microsoft licensing | Low license cost but more build time | Often hundreds or thousands |
| Certification-specific visuals | Included across 5 analysis pages | Must be built or customized | Depends on module |
Who This Template Is For – and Who It’s Not For
This template is for green building consultants, sustainability managers, ESG reporting teams, construction project managers, facilities teams, architects, real estate portfolio managers, and analysts who need certification reporting in Excel.
It is not a live building management system, sensor platform, carbon accounting platform, or automated LEED submission tool. It works best when you already have project-level data and want a clean Excel dashboard for analysis, review meetings, and management reporting.
How to Use the Green Building Certification Dashboard in Excel
- Download and unzip the product file.
- Open the workbook in Microsoft Excel.
- Go to the Data sheet and replace the sample data with your own green building certification records.
- Keep the same column structure so the pivot tables continue to work.
- Open Excel’s Data ribbon and click Refresh All.
- Use the slicers on the dashboard pages to filter by project, region, certification level, consultant, status, and other fields.
- Review the Overview page first, then use the Certification, Energy View, Waste View, and Project Cost pages for deeper analysis.
Real-World Use Cases
Asha, sustainability manager: Asha reviews certified projects, area, certification cost, and energy saved before monthly ESG meetings.
Daniel, green building consultant: Daniel uses consultant-level audit scores, waste diversion, and utility savings to compare project outcomes across client portfolios.
Maria, real estate portfolio analyst: Maria filters the dashboard by city and region to explain certification spend, utility savings, and floor-area certification progress to leadership.
Frequently Asked Questions
Does this dashboard work in Excel?
Yes. It is an Excel dashboard workbook designed for Microsoft Excel.
What pages are included?
The workbook includes Overview, Certification, Energy View, Waste View, Project Cost, Data Sheet, and Support Sheet tabs.
Can I use my own project data?
Yes. Replace the sample records in the Data sheet while keeping the same format, then refresh all pivots and charts.
Does it include slicers?
Yes. The dashboard pages include slicers so you can filter the visuals quickly.
Can I hide the Support sheet?
Yes. The Support sheet contains pivot tables and can be hidden after setup.
Is this a subscription?
No. It is a one-time purchase template from NextGenTemplates.
About the Author
Built by PK – Microsoft Certified Professional with 15+ years of Excel, Google Sheets, and Power BI experience. Founder of NextGenTemplates, reaching 300K+ subscribers across YouTube channels. Every template is hand-built and tested before release.
Explore Related Templates
Explore more MS Excel templates and Excel dashboard templates. You may also like the Green Building KPI Dashboard in Excel, the Geothermal Energy Dashboard in Power BI, and the supporting blog post Green Building Certification Dashboard in Excel.
Download the Green Building Certification Dashboard in Excel and start reviewing certification progress, cost, energy, waste, and utility savings in a clean Excel dashboard.
Last updated: June 18, 2026.


Reviews
There are no reviews yet.