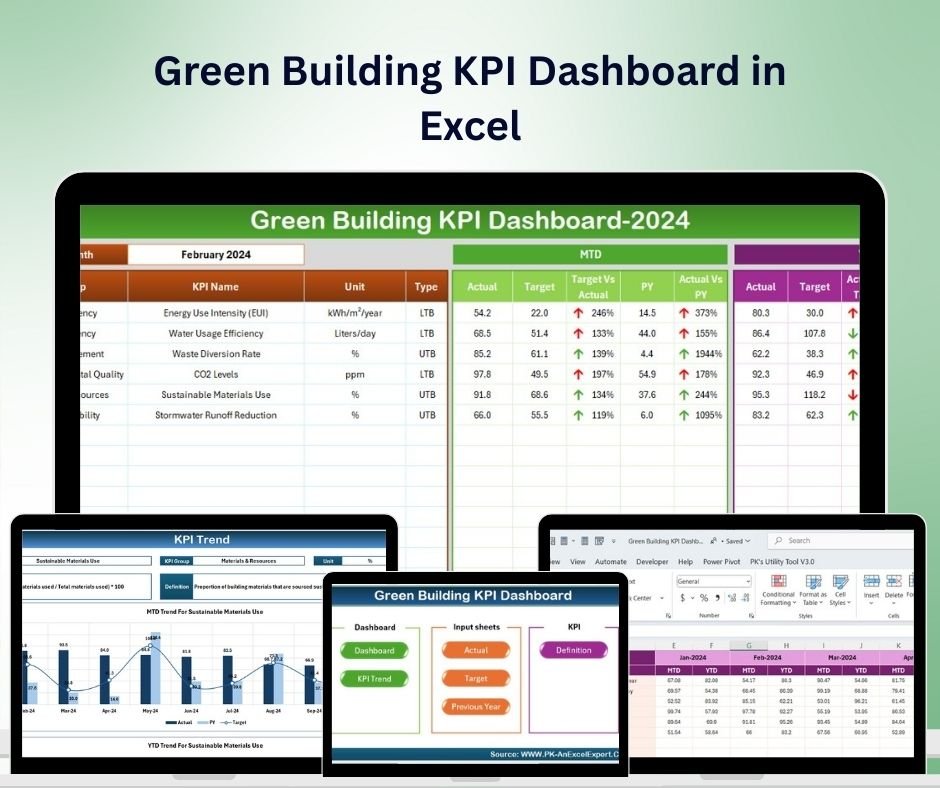


The Green Building KPI Dashboard in Excel is an essential tool for architects, construction managers, facility managers, and sustainability professionals involved in green building projects. Whether you’re managing a single green building project or overseeing multiple sustainability initiatives, this Excel-based dashboard enables you to track key performance indicators (KPIs) related to energy efficiency, waste reduction, water conservation, and overall environmental impact.
With customizable features and real-time tracking, this dashboard provides clear insights into how your building project is performing against sustainability goals and green building standards such as LEED certification, BREEAM, or other eco-friendly frameworks.

Key Features of the Green Building KPI Dashboard in Excel:
🌱 Energy Efficiency Tracking
Monitor energy consumption, efficiency ratings, and the effectiveness of energy-saving measures like LED lighting, HVAC systems, and renewable energy sources.
💧 Water Conservation
Track water usage and conservation efforts, including rainwater harvesting, low-flow fixtures, and water-efficient landscaping to minimize your building’s environmental footprint.
♻️ Waste Management and Recycling
Track the volume of waste generated, recycled materials, and waste diversion strategies to ensure that the building project aligns with sustainability goals.
💰 Cost-Benefit Analysis of Sustainability Initiatives
Evaluate the costs and savings associated with green building features such as energy-efficient systems, water-saving technologies, and sustainable materials.
📊 Building Performance and Certification Tracking
Monitor progress toward green building certifications (like LEED) and track compliance with sustainability standards and goals throughout the construction process.
🚀 Why You’ll Love the Green Building KPI Dashboard in Excel:
✅ Track Sustainability Progress – Monitor key sustainability metrics such as energy use, water conservation, and waste reduction to ensure that your green building goals are being met.
✅ Maximize Energy Efficiency – Track energy consumption and efficiency measures to minimize the building’s energy footprint and achieve sustainability targets.
✅ Ensure Water Conservation – Monitor water usage and conservation efforts to reduce environmental impact and improve building efficiency.
✅ Optimize Waste Management – Track waste and recycling efforts to reduce waste generation and improve sustainability in the building process.
✅ Cost and Environmental Impact – Evaluate the costs and benefits of implementing green building initiatives to assess financial feasibility and environmental impact.
✅ Fully Customizable and Interactive – Tailor the dashboard to meet your specific green building project needs, with interactive features for real-time tracking and insights.
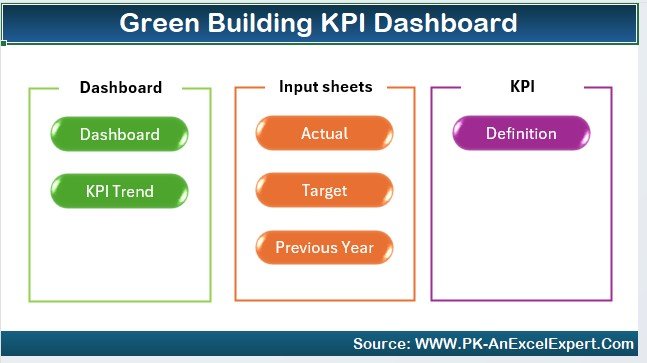
What’s Inside the Green Building KPI Dashboard in Excel:
-
Energy Efficiency: Track energy usage, energy savings, and energy-efficient technologies in place to reduce environmental impact.
-
Water Conservation: Monitor water-saving initiatives, such as rainwater harvesting, low-flow systems, and water-efficient fixtures.
-
Waste Management: Track waste production, recycling, and waste diversion efforts to reduce the environmental footprint of your building project.
-
Sustainability Costs and Benefits: Evaluate the costs of implementing green building features and track the financial savings from energy and water conservation measures.
-
Certification Tracking: Monitor the building’s progress toward LEED, BREEAM, or other green building certifications and track compliance with sustainable standards.
-
Custom Reports: Generate reports summarizing key performance metrics such as energy savings, water conservation, waste diversion, and cost savings for better decision-making.
How to Use the Green Building KPI Dashboard in Excel:
1️⃣ Download the Template – Instantly access your Excel file upon purchase.
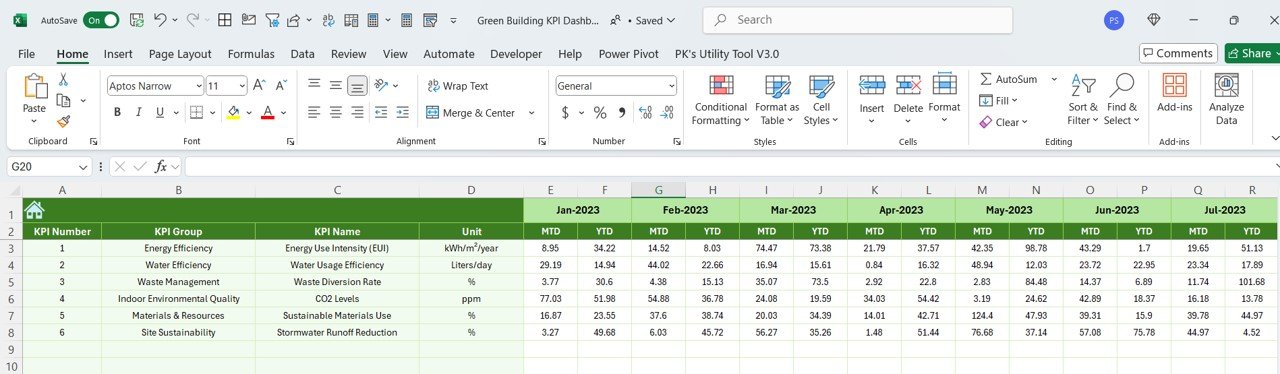
2️⃣ Input Data – Enter energy usage, water consumption, waste management, and sustainability costs to track your green building KPIs.
3️⃣ Monitor Key Metrics – Use the dashboard to track your sustainability goals, such as energy efficiency, water conservation, and waste reduction, in real-time.
4️⃣ Evaluate Costs and Savings – Track the financial savings generated by energy-efficient systems, water-saving technologies, and sustainable materials.
5️⃣ Generate Reports – Create custom reports summarizing the building’s sustainability performance and progress toward certifications like LEED or BREEAM.
Who Can Benefit from the Green Building KPI Dashboard in Excel:
-
Architects and Designers
-
Construction Managers
-
Sustainability Professionals
-
Facility Managers
-
Green Building Certification Coordinators (LEED, BREEAM)
-
Real Estate Developers
-
Environmental Consultants
-
Project Managers in the Construction Industry
-
Building Owners and Operators
The Green Building KPI Dashboard in Excel is the ideal tool for managing and optimizing green building projects. With its ability to track sustainability metrics such as energy, water, and waste management, this dashboard ensures that your building projects align with green building standards and minimize their environmental impact.
Click here to read the Detailed blog post
https://www.pk-anexcelexpert.com/green-building-kpi-dashboard-in-excel/
Visit our YouTube channel to learn step-by-step video tutorials
Youtube.com/@PKAnExcelExpert


Reviews
There are no reviews yet.