

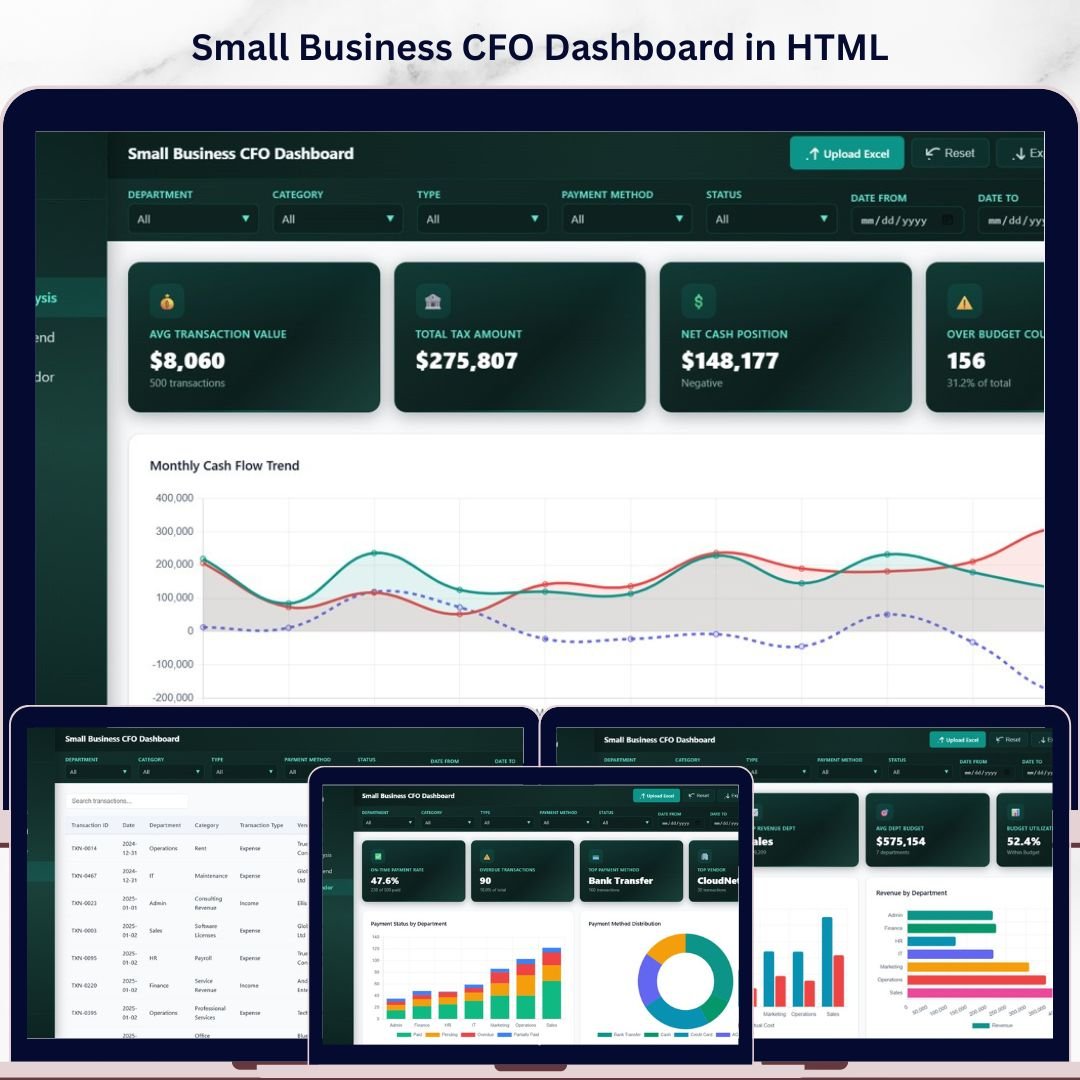
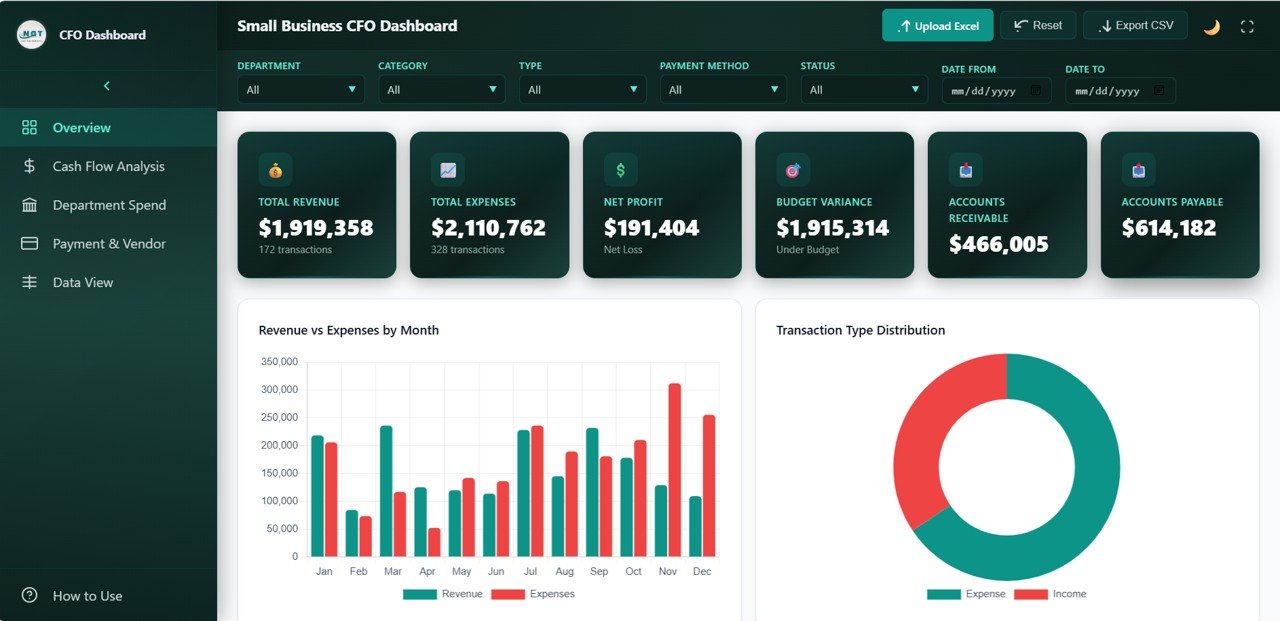

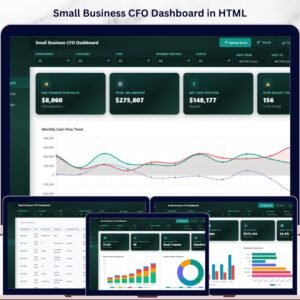
Small Business CFO Dashboard in HTML is a professionally designed, browser-based financial analytics template built for small business owners, CFOs, finance managers, and startup founders who need to monitor Total Revenue, Total Expenses, Net Profit, Budget Variance, Accounts Receivable, and Accounts Payable from a single, powerful dashboard. This template includes 5 interactive dashboard pages covering Overview, Cash Flow Analysis, Department Spend, Payment and Vendor Analysis, and a detailed Data View tab — making it one of the most comprehensive HTML Dashboard Templates available for small business financial management.
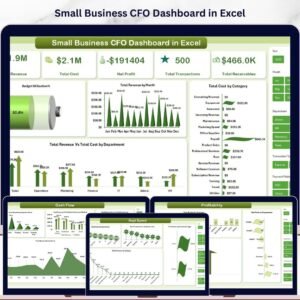
Whether you run a growing startup or manage finances for an established small business, this dashboard transforms raw financial data into stunning, actionable visual insights. If you have been searching for a reliable, data-driven way to monitor cash flow, analyze department spending, evaluate vendor payments, and track budget variances, the Small Business CFO Dashboard in HTML is the solution you need. Also explore our Small Business CFO Dashboard in Excel and Finance & Accounting Command Center Bundle for complementary financial analytics tools.
🔑 Key Features of Small Business CFO Dashboard in HTML
📊 6 High-Level KPI Cards — Track Total Revenue, Total Expenses, Net Profit, Budget Variance, Accounts Receivable, and Accounts Payable at a glance on the Overview page for instant financial health monitoring.
📈 5 Interactive Dashboard Pages — Navigate through Overview, Cash Flow Analysis, Department Spend, Payment and Vendor Analysis, and Data View tabs. Each page offers unique insights into different financial dimensions of your business.
🔍 Multiple Interactive Slicers — Apply filters across all dashboard pages to quickly drill down into specific departments, categories, payment methods, vendors, and time periods for targeted analysis.
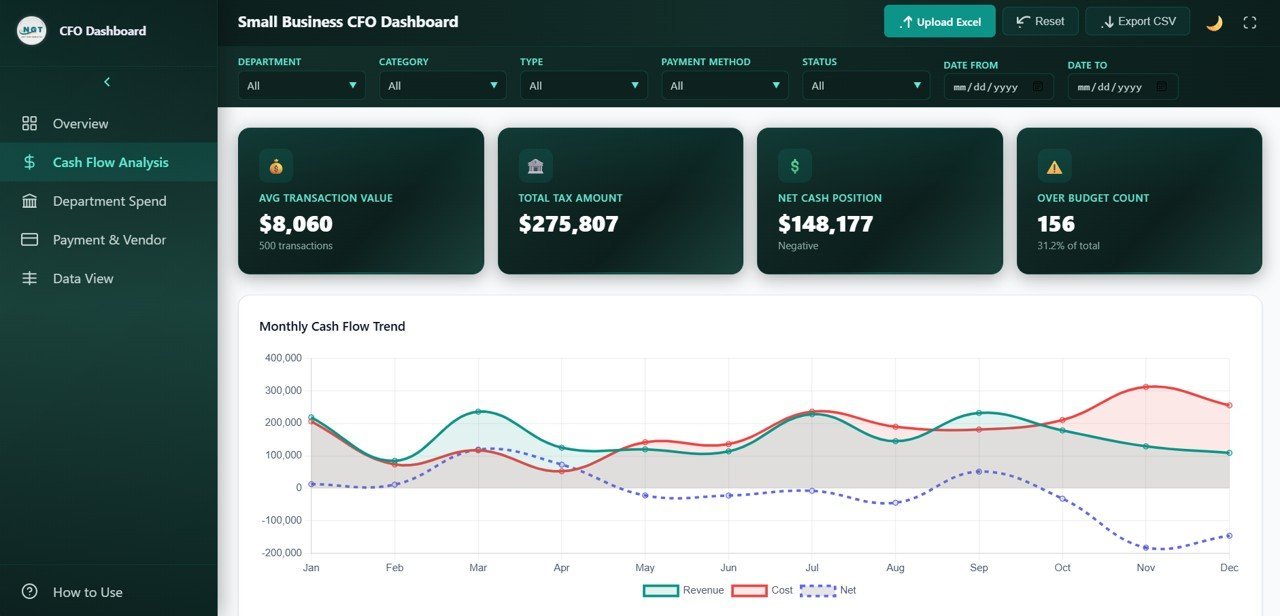
💰 Cash Flow Monitoring — The dedicated Cash Flow Analysis page tracks Monthly Cash Flow Trend, Revenue by Category, Cost by Category, and Accounts Receivable vs Payable by Month to give you complete visibility into money movement.
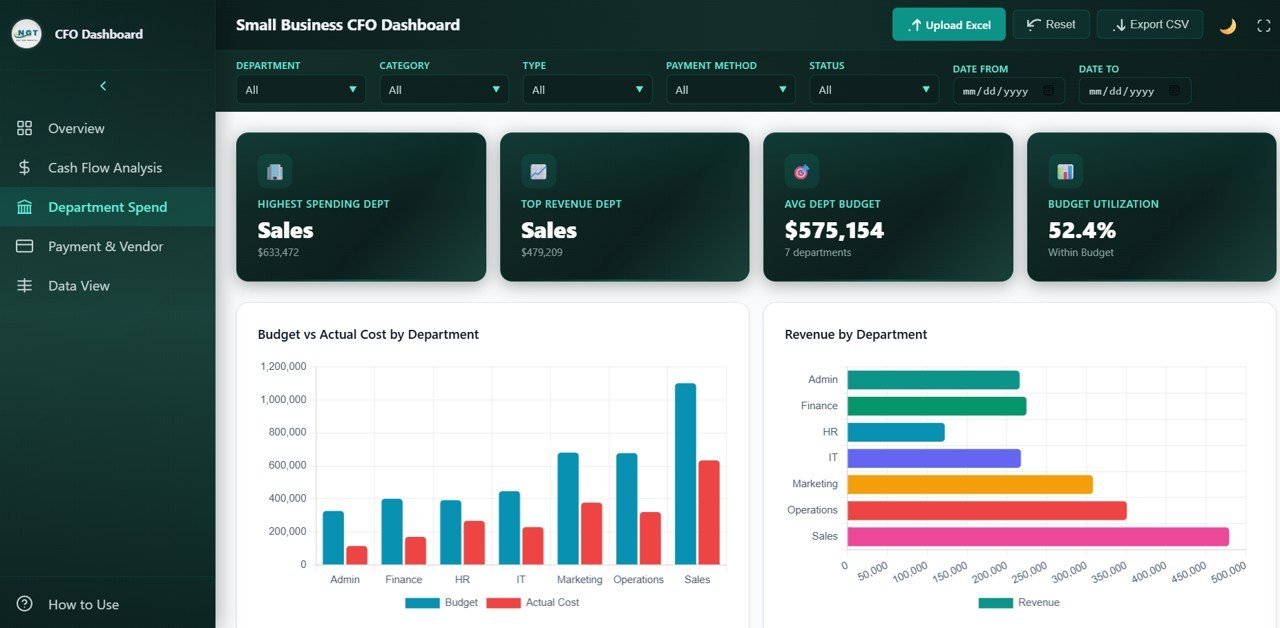
🏢 Department-Level Spend Analysis — Analyze Budget vs Actual Cost by Department, Revenue by Department, Transaction Count by Department, and Over Budget Rate by Department to pinpoint exactly where your money goes.
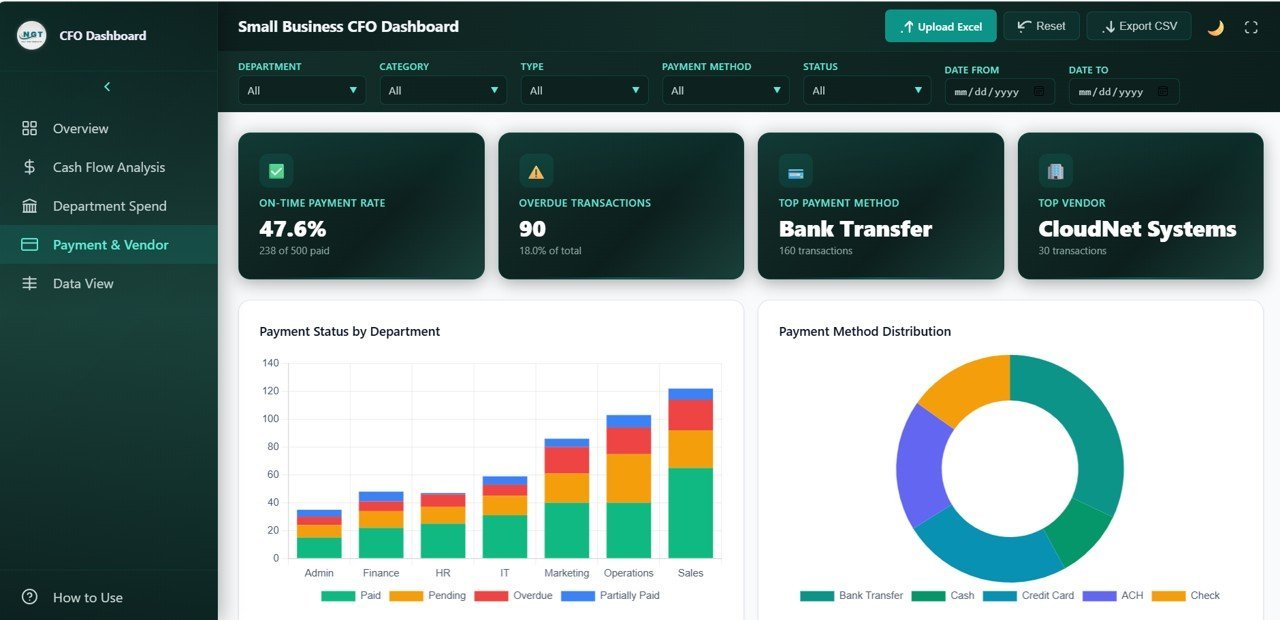
💳 Payment and Vendor Intelligence — Monitor Payment Status by Department, Payment Method Distribution, Top 10 Vendors by Transaction Volume, and Overdue Amounts by Department to strengthen vendor management and payment control.
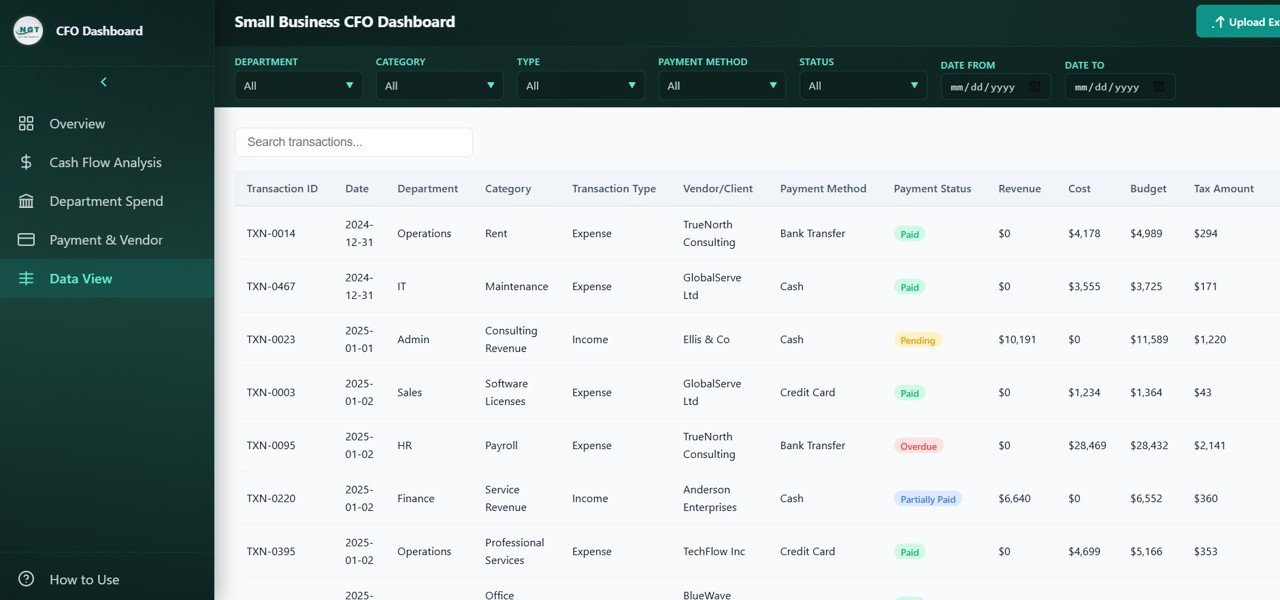
📋 Searchable Data View — The Data View tab provides a detailed data table with search, sort, pagination, and CSV export features so you can access, filter, and download your complete financial dataset anytime.
🌐 Browser-Based — No Software Required — Simply open the index.html file in any modern browser like Chrome, Firefox, or Edge. No installation, no macros, no dependencies — works instantly on any computer.
📦 What’s Inside the Small Business CFO Dashboard in HTML
This template includes 5 dedicated dashboard pages, each designed to deliver deep insights into your small business finances:
📊 Overview Page — The main dashboard displays 6 high-level KPI cards: Total Revenue, Total Expenses, Net Profit, Budget Variance, Accounts Receivable, and Accounts Payable. Below the cards, 4 interactive charts provide instant analysis: Revenue and Expenses by Month, Transaction Type Distribution, Payment Status Breakdown, and Top Departments by Cost. Multiple slicers let you filter the entire dashboard by various dimensions quickly.
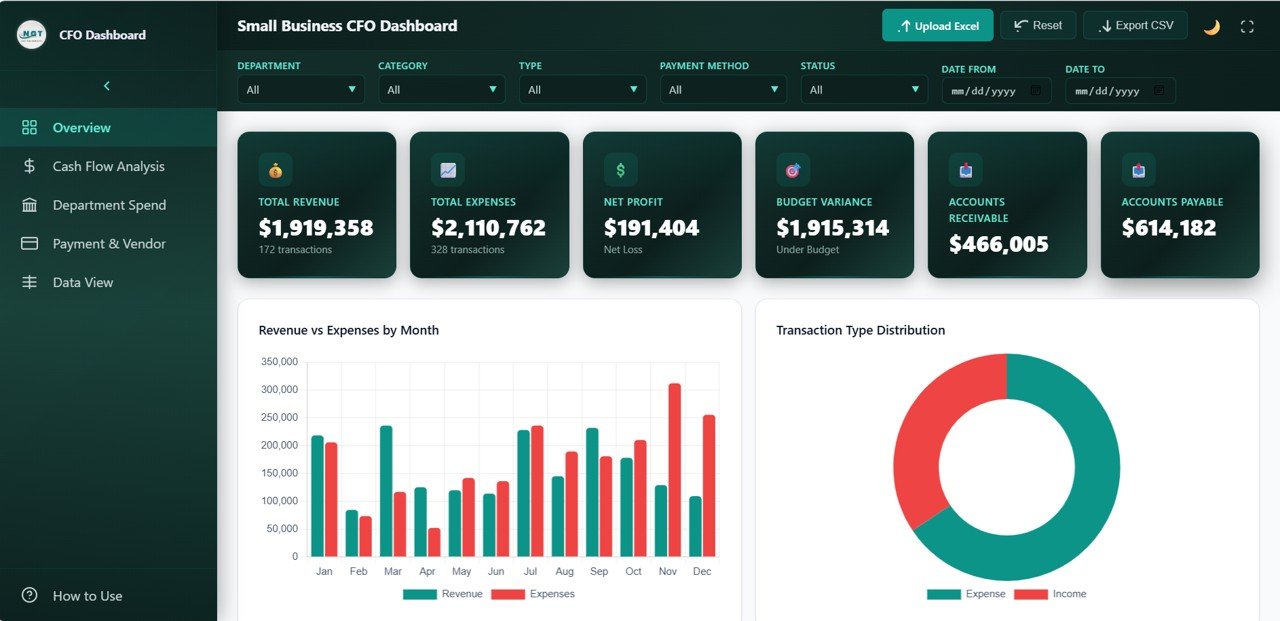 Small Business CFO Dashboard Overview
💰 Cash Flow Analysis — This page provides detailed cash flow insights through 4 powerful charts: Monthly Cash Flow Trend showing how cash moves month by month, Revenue by Category breaking down income sources, Cost by Category revealing where expenses concentrate, and Accounts Receivable vs Payable by Month comparing what is owed to you versus what you owe.
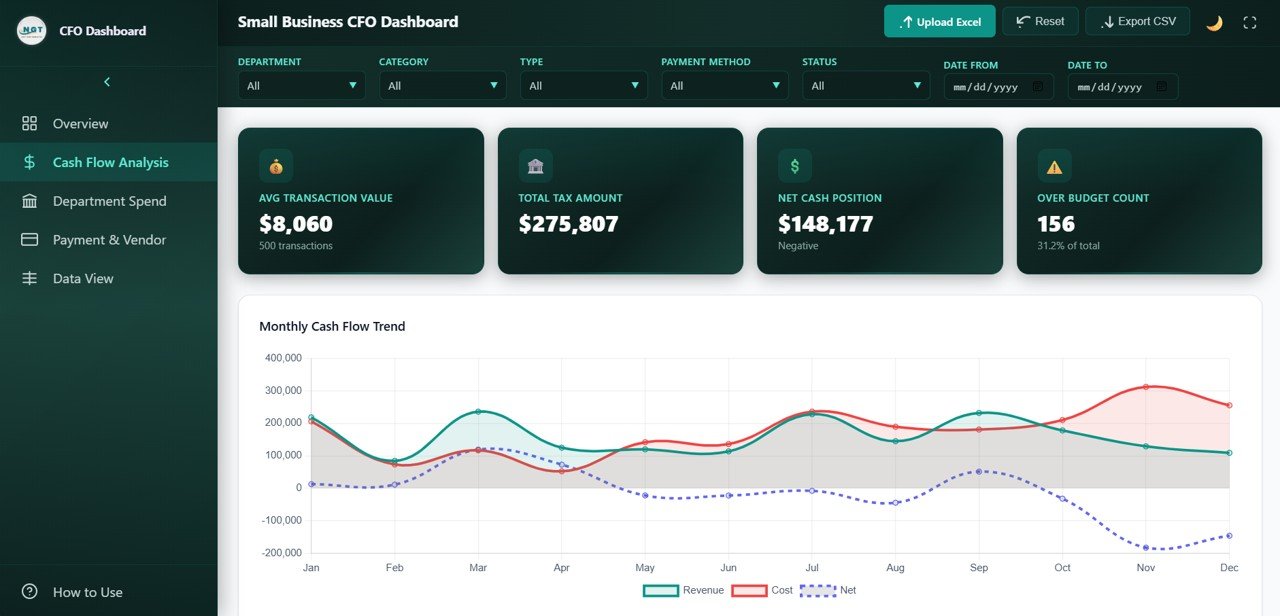 Cash Flow Analysis
🏢 Department Spend — Break down spending across departments with 4 targeted charts: Budget vs Actual Cost by Department to compare planned versus real spending, Revenue by Department to see which teams generate the most income, Transaction Count by Department for volume analysis, and Over Budget Rate by Department to flag departments that exceed their budget allocation.
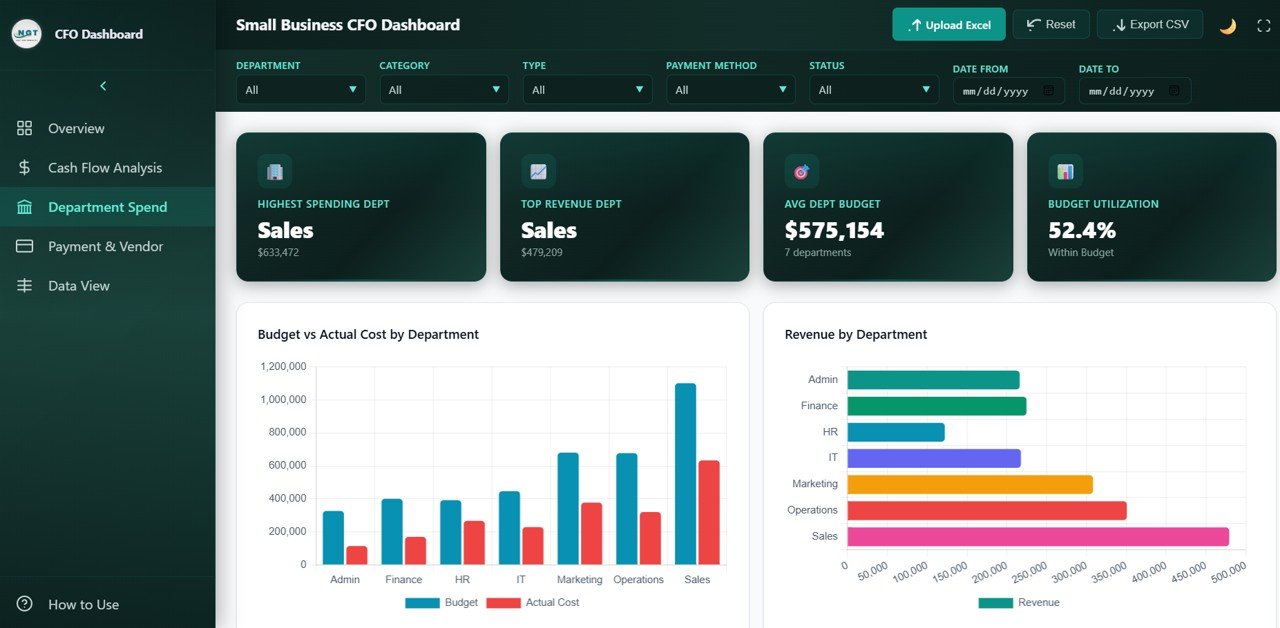 Department Spend
💳 Payment and Vendor Analysis — Evaluate payment operations and vendor relationships with 4 key charts: Payment Status by Department showing approval and pending rates, Payment Method Distribution analyzing how transactions are processed, Top 10 Vendors by Transaction Volume identifying your most active vendors, and Overdue Amounts by Department highlighting departments with delayed payments.
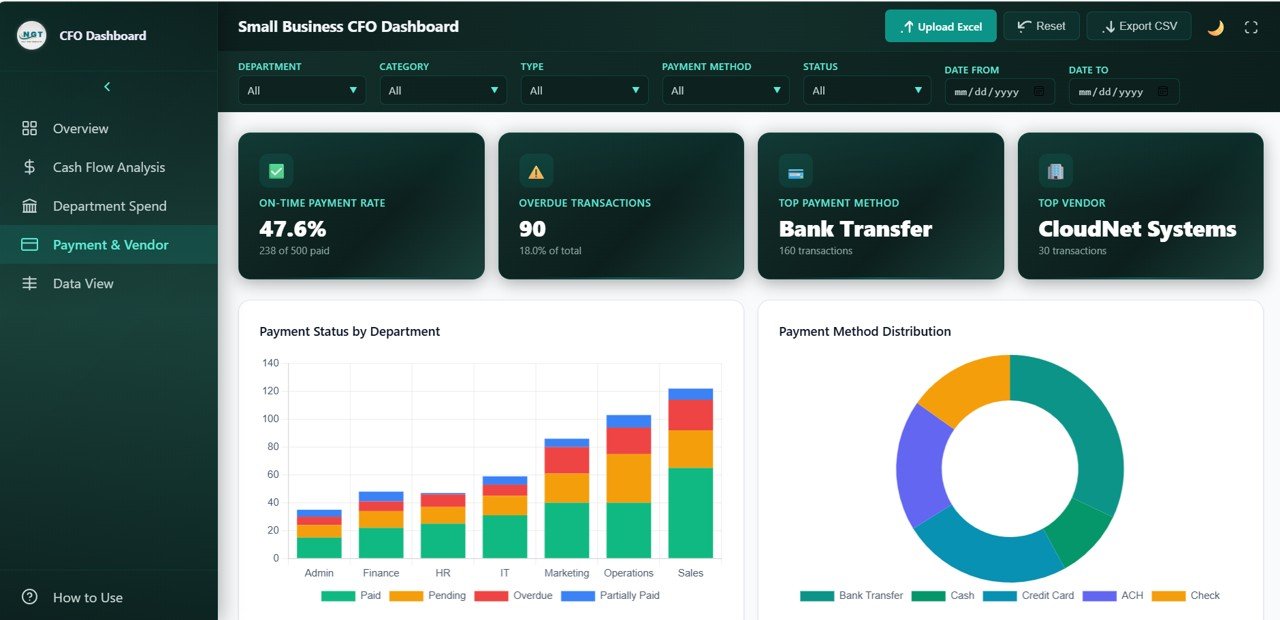 Payment and Vendor Analysis
📋 Data View — This is the detailed data table page. Here you can see all the records with search, sort, and pagination features. You can also export the filtered data to CSV for further analysis in Excel or other tools.
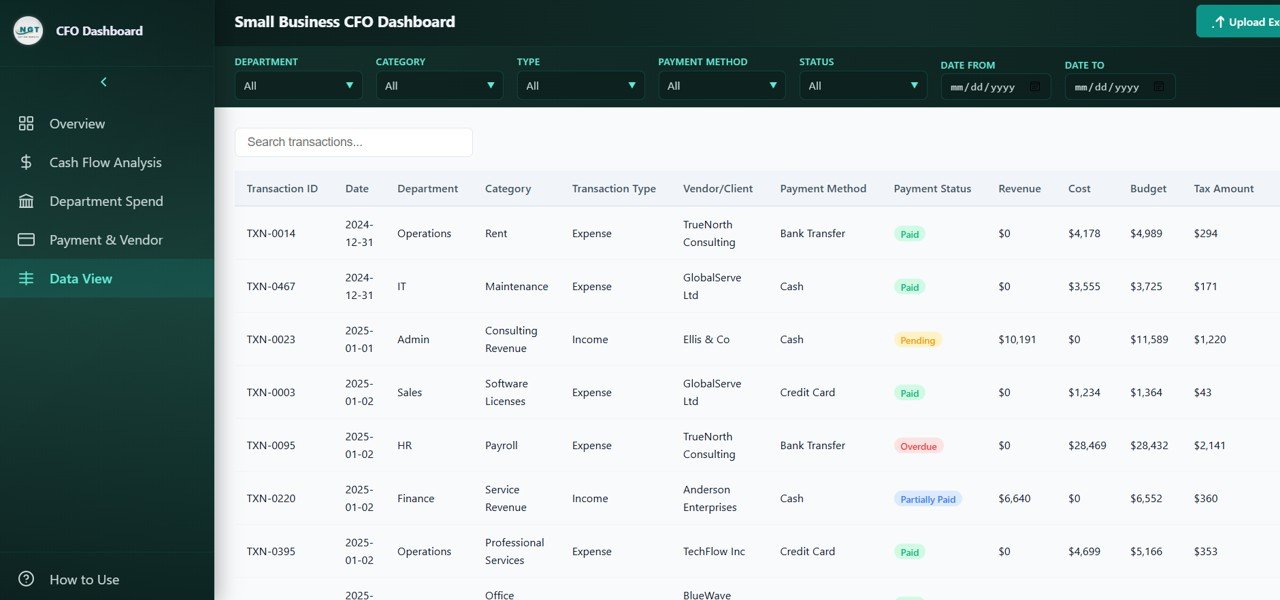 Data View Tab
⚙️ How to Use the Small Business CFO Dashboard in HTML
1️⃣ Download and unzip the file on your computer.
2️⃣ Open the index.html file in any modern web browser (Chrome, Firefox, Edge).
3️⃣ Replace the sample data in the data file with your actual business financial data in the same format.
4️⃣ Refresh the browser to see all dashboard pages update automatically with your data.
5️⃣ Navigate through the 5 dashboard pages to explore your financial insights — use slicers and filters to drill down into specific areas.
👥 Who Can Benefit from This Small Business CFO Dashboard
🔹 Small Business Owners — Track overall financial health without hiring an expensive analyst
🔹 CFOs and Finance Managers — Get a bird’s-eye view of revenue, expenses, cash flow, and department performance
🔹 Startup Founders — Monitor burn rate, department spending, vendor payments, and budget utilization
🔹 Accountants and Bookkeepers — Present clear financial summaries to clients and stakeholders
🔹 Business Consultants — Provide professional financial reporting to small business clients
🔹 Finance Students — Learn real-world financial analysis with a ready-to-use interactive dashboard
❓ Frequently Asked Questions
What KPIs does the Small Business CFO Dashboard in HTML track?
The Small Business CFO Dashboard in HTML tracks 6 key performance indicators: Total Revenue, Total Expenses, Net Profit, Budget Variance, Accounts Receivable, and Accounts Payable. It also provides in-depth analysis across cash flow, department spend, payment and vendor management through 16 interactive charts spread across 5 dashboard pages.
Do I need any special software to use this HTML dashboard?
No. Simply unzip the downloaded file and open index.html in any modern web browser like Chrome, Firefox, or Edge. No installation, plugins, macros, or coding knowledge required. It works instantly on any computer or laptop.
Can I customize the Small Business CFO Dashboard for my specific industry?
Yes. The dashboard is designed to work with any small business financial data. You can modify departments, categories, payment methods, and vendor names in the data file, and the dashboard will adapt dynamically to reflect your unique business structure.
What is the best HTML dashboard template for small business financial analysis?
The Small Business CFO Dashboard in HTML is one of the best templates for small business financial analysis. It covers 5 critical areas — overview, cash flow, department spend, payment and vendor analysis, and data view — giving business owners and CFOs a complete financial picture in one browser-based file.
How is this different from the Excel version of the CFO Dashboard?
The HTML version runs entirely in a web browser with no software required, features a modern responsive design, and includes built-in search, sort, pagination, and CSV export in the Data View tab. The Excel version uses pivot tables and slicers within Microsoft Excel. Both track similar financial KPIs but offer different user experiences.
🔗 Explore Related Templates
🔹 Small Business CFO Dashboard in Excel — The Excel version of this CFO dashboard with pivot tables, slicers, and automated charts for Microsoft Excel users.
🔹 Finance and Accounting Dashboard in Google Sheets — Track budget, forecast, actual spending, and variance with interactive Google Sheets analytics.
🔹 Finance & Accounting Command Center Bundle — Get 8 premium finance templates across Excel, Power BI, and Google Sheets at 46% savings.
📖 Click here to read the Detailed Blog Post about Small Business CFO Dashboard in HTML
Watch the step-by-step video tutorial:

Reviews
There are no reviews yet.