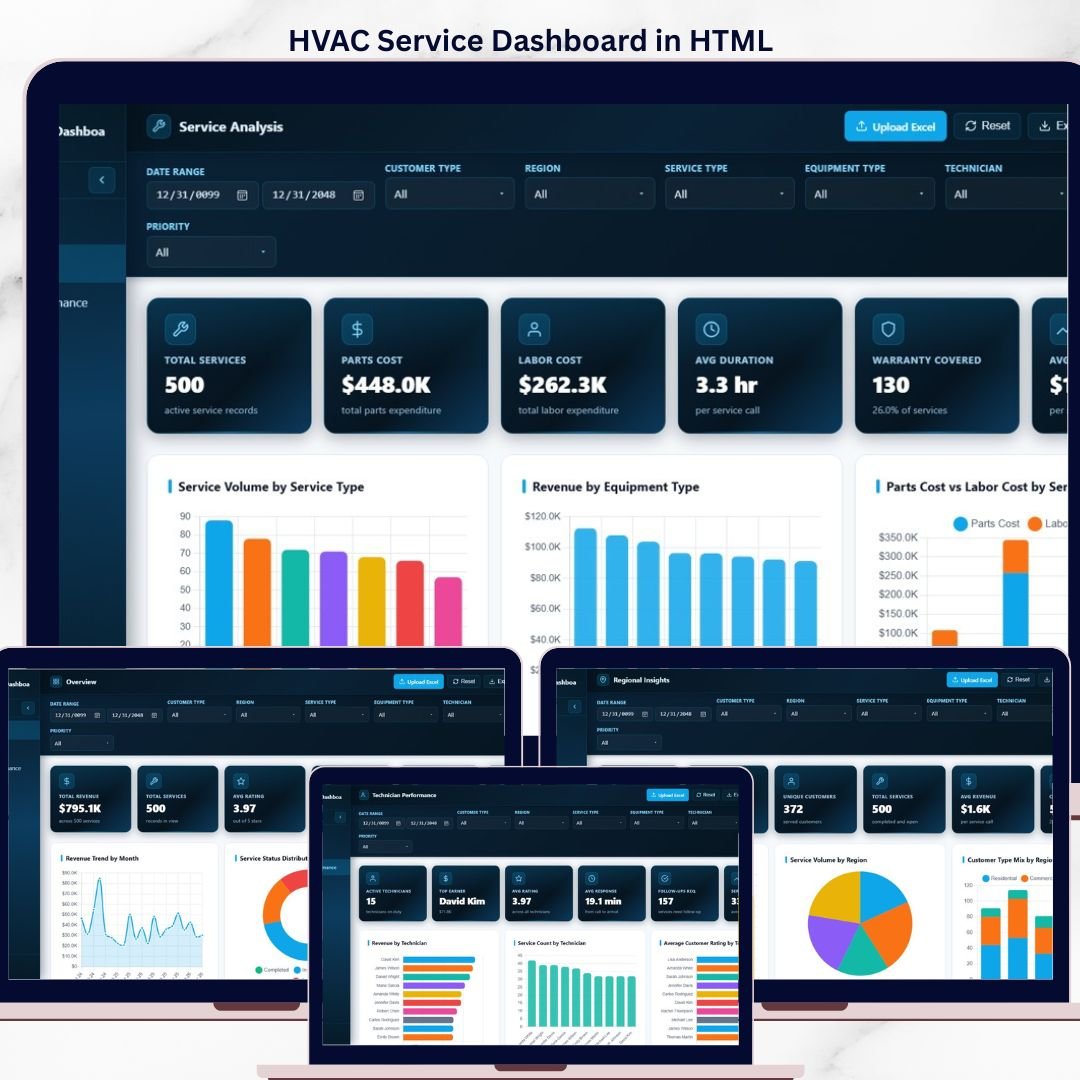
The HVAC Service Dashboard in HTML tracks 6 high-level KPIs across 5 interactive pages, with 20+ pre-built charts and full sort/search/CSV-export on the raw data. Setup takes under 5 minutes — unzip the folder, open index.html in any modern browser, and the entire HVAC service dashboard loads offline with your own data.
🌍 Join 8,400+ teams in 40+ countries using NextGenTemplates to replace paid SaaS tools with one-time-purchase Excel, Google Sheets, Power BI, and HTML templates.
✅ Instant download · One-time payment · No subscription · No per-user fees · Lifetime access
🔑 Key Features of the HVAC Service Dashboard in HTML
This dashboard ships as a single self-contained HTML file with embedded CSS and JavaScript — no WordPress, no database, no server, no monthly SaaS fee. It runs fully offline in Chrome, Edge, Safari, or Firefox and tracks 6 KPIs, 20+ charts and 5 dedicated pages covering revenue, service analysis, technician performance, regional insights and raw data. ⚡
🔹 Fully offline HTML dashboard — runs on any laptop, tablet or browser without internet or a web host.
🔹 5 interactive pages — Overview, Service Analysis, Technician Performance, Regional Insights and Data View.
🔹 6 KPI cards — Total Revenue, Total Services, Average Customer Rating, Average Response Time, Completed Services and Pending Services.
🔹 20+ interactive charts covering revenue trends, service status, equipment mix, technician ratings and regional performance.
🔹 Global slicers and filters — filter the entire dashboard by date, region, technician, service type or priority in one click.
🔹 Data View with search, sort, pagination and CSV export — drill any chart all the way down to the source record.
🔹 Priority and response-time tracking to keep emergency calls inside SLA.
🔹 Warranty coverage analytics to protect margin on in-warranty jobs.
🔹 Mobile-responsive layout — works on phone and tablet for field supervisors and dispatchers.
🔹 Print and export-ready for board reviews, franchise audits and investor reporting.
📦 What’s Inside the HVAC Service Dashboard in HTML
1 — Overview Page
The overview page condenses the entire HVAC service operation onto a single screen. Six KPI cards show Total Revenue, Total Services, Average Customer Rating, Average Response Time, Completed Services and Pending Services, while global slicers let you drill the whole dashboard by region, technician, priority or service type in one click.
📈 Revenue Trend by Month — plots the monthly revenue curve so you can spot seasonality, heating-season peaks and cooling-season dips.
🧭 Service Status Distribution — splits jobs into Completed, In Progress, Pending and Cancelled so managers see backlog at a glance.
💰 Revenue by Service Type — compares installation, repair, maintenance and inspection revenue to protect the highest-margin mix.
👥 Service Volume by Customer Type — separates residential, commercial and industrial work to guide sales effort.
🚨 Services and Revenue by Priority — overlays emergency, high, medium and low-priority workload against the revenue they produce.
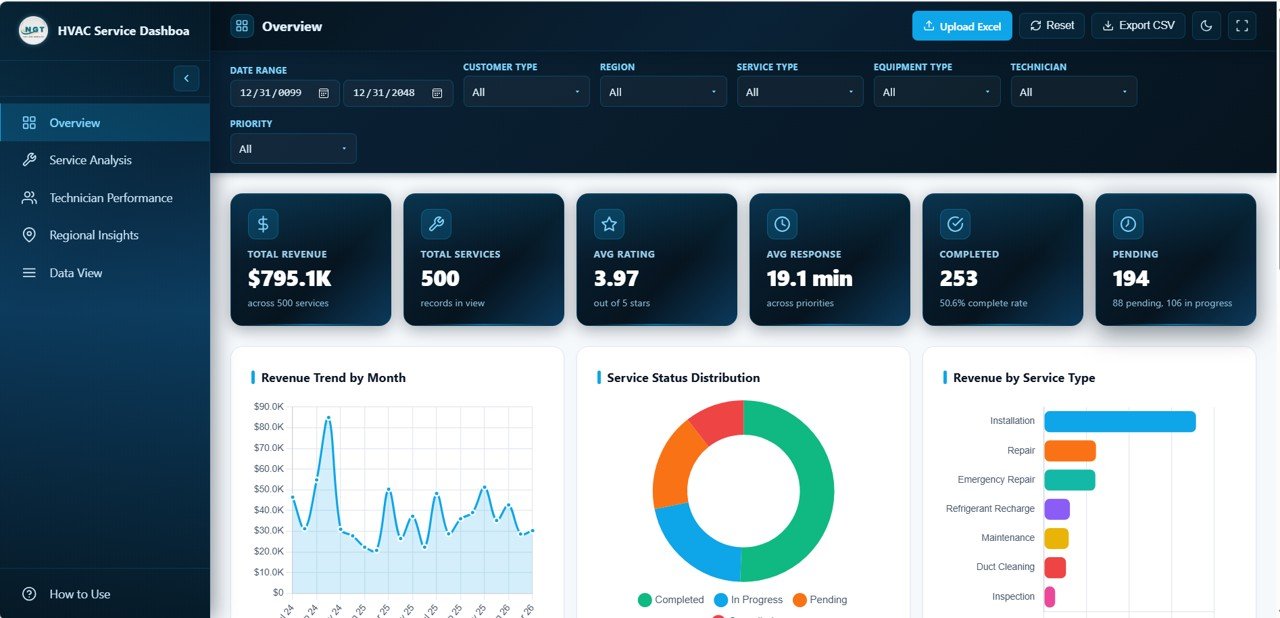
HVAC Service Dashboard Overview
2 — Service Analysis
The service analysis page drills into the work itself — what type of jobs, what equipment, what cost structure. Key charts include Service Volume by Service Type, Revenue by Equipment Type, Parts Cost and Labor Cost by Service Type, Services by Warranty Coverage and Average Service Duration by Equipment Type. Use it to spot loss-making job categories and protect in-warranty margin.
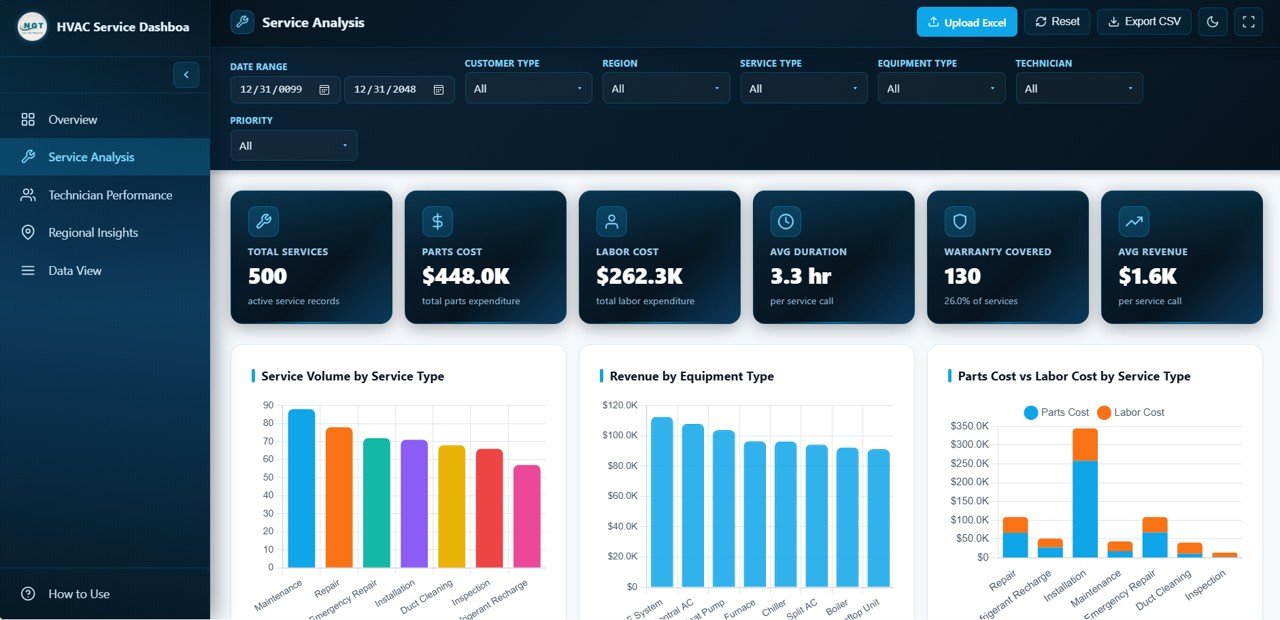
HVAC Service Dashboard — Service Analysis
3 — Technician Performance
The technician performance page is built for HVAC service managers who need to reward top performers and coach the rest. Charts cover Revenue by Technician, Service Count by Technician, Average Customer Rating by Technician, Average Response Time by Priority and Customer Rating Distribution. It is the page you will use in every monthly one-on-one and every quarterly bonus review.
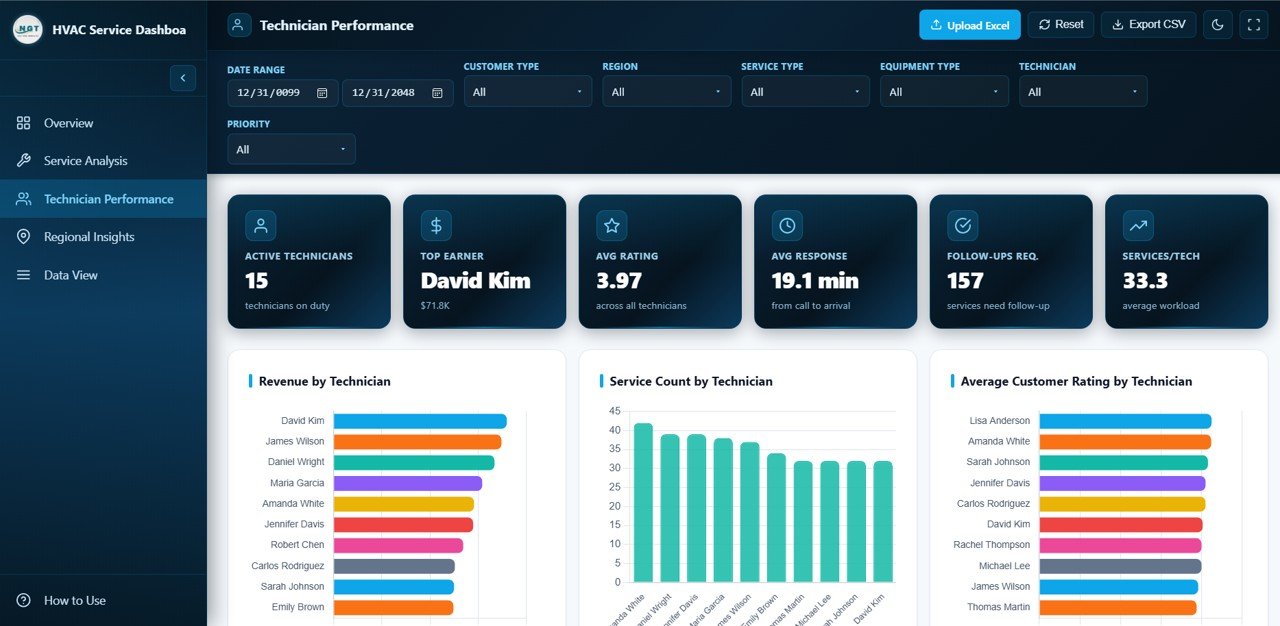
HVAC Service Dashboard — Technician Performance
4 — Regional Insights
The regional insights page gives multi-branch HVAC operators a branch-by-branch view of the business. Visuals include Revenue by Region, Service Volume by Region, Customer Type Mix by Region, Average Revenue per Service by Region and Monthly Service Volume by Region. Perfect for franchise owners, area managers and operations directors.
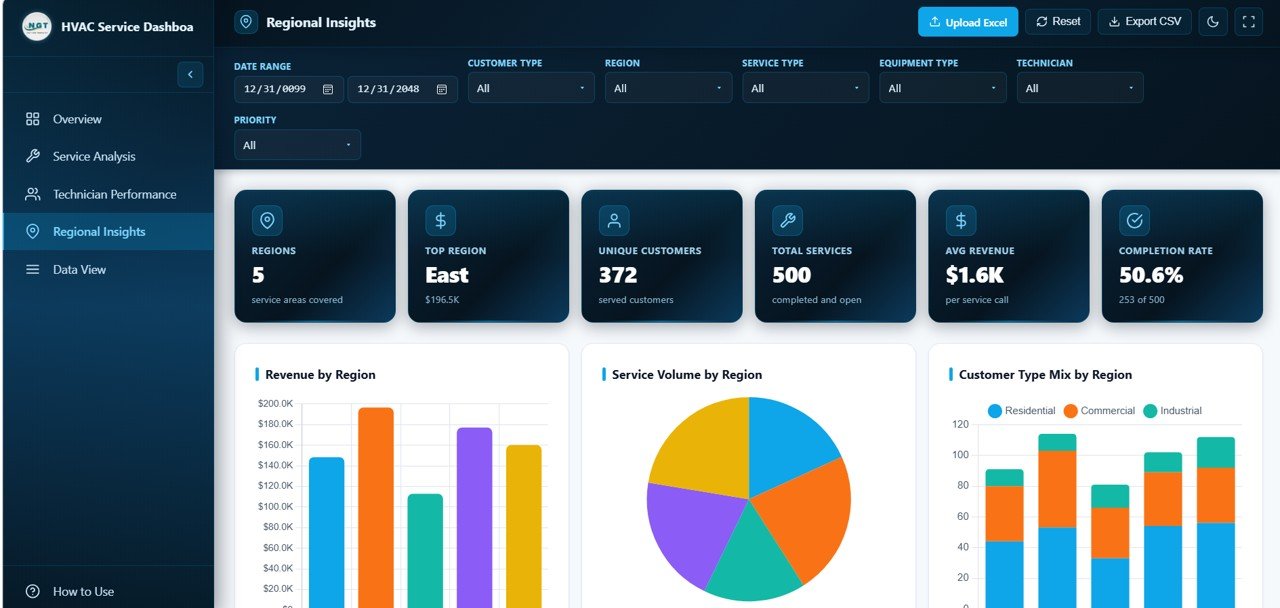
HVAC Service Dashboard — Regional Insights
5 — Data View
The data view page is a full interactive table of every service record powering the dashboard. Search by customer or job ID, sort any column, paginate through thousands of rows and export any filtered slice to CSV for your accountant, auditor or CRM import. It is the audit trail behind every chart.
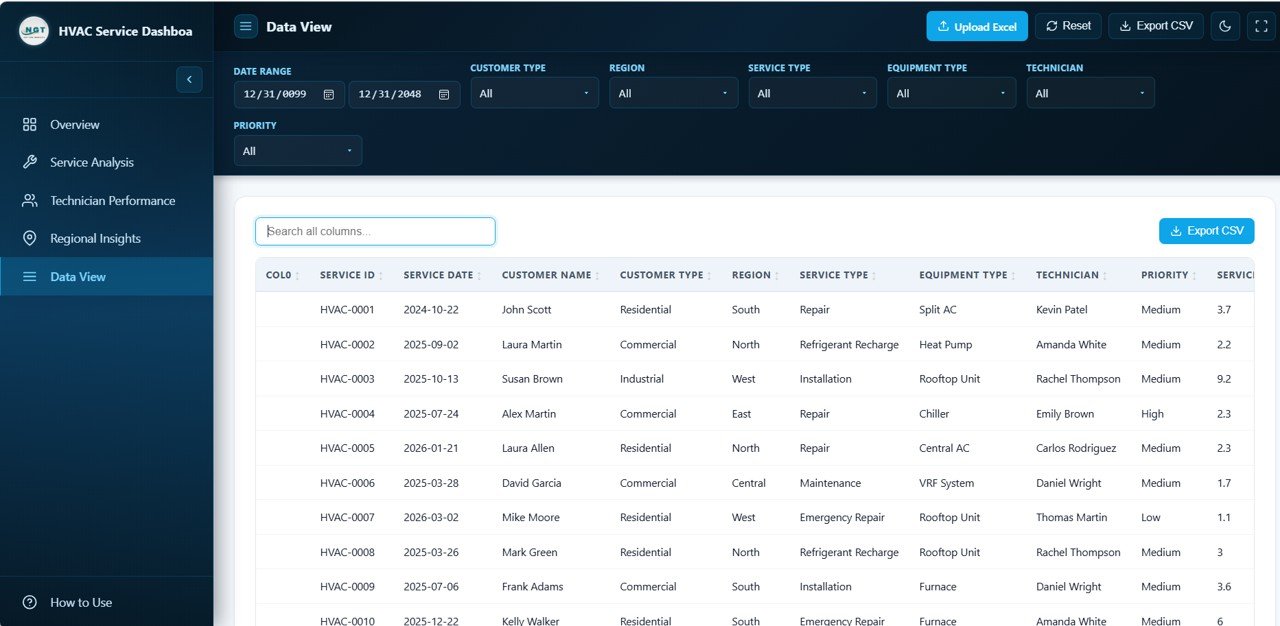
HVAC Service Dashboard — Data View Tab
📊 HVAC Service Dashboard in HTML vs. Standalone SaaS Dashboard vs. ServiceTitan / Housecall Pro — Where This Fits
| Feature | HVAC Service Dashboard in HTML | Standalone SaaS Dashboard | ServiceTitan / Housecall Pro |
|---|---|---|---|
| Cost | $12.99 one-time | $29–99 / user / month | $99–398 / technician / month |
| Platform | Any browser, offline HTML | Cloud SaaS, login required | Cloud SaaS + mobile app |
| Setup time | Under 5 minutes | 1–3 days | 4–8 weeks onboarding |
| Runs offline | ✅ Yes | ❌ No | ❌ No |
| Customizable charts & fields | ✅ Full HTML/JS control | Limited to vendor options | Limited without Pro plan |
| CSV export of filtered data | ✅ Built in | Often paywalled | Often paywalled |
| Share with link | ✅ Zip & email or host anywhere | User seat required | User seat required |
| Year-1 cost at 5 users | $12.99 total | $1,740–$5,940 | $5,940–$23,880 |
| Works without internet | ✅ Yes — true offline | ❌ No | ❌ No |
For HVAC contractors who want a clean, offline, customizable service dashboard without committing to a per-technician SaaS subscription, the HVAC Service Dashboard in HTML sits in the sweet spot.
👥 Who This Template Is For — and Who It’s Not For
✅ This template is built for:
- HVAC contractors and service companies with 3–50 technicians who want a zero-subscription reporting layer.
- Multi-branch residential and commercial HVAC operators tracking revenue by region and technician.
- Franchise owners and area managers who need a portable dashboard they can run on any laptop.
- Field service consultants building quick management reports for HVAC, refrigeration or mechanical-services clients.
❌ This template is NOT for:
- Large HVAC enterprises needing live dispatch, GPS routing, payroll integration and SOC 2 compliance — stick with ServiceTitan or Housecall Pro.
- Teams that want the dashboard to write back to a live CRM. This template reads a static dataset and is built for reporting only.
⚙️ How to Use the HVAC Service Dashboard in HTML
1️⃣ Download and unzip — extract the ZIP file to any folder on your computer.
2️⃣ Open index.html — double-click the file; it opens in your default browser with sample data preloaded.
3️⃣ Replace the data — open the bundled data.js (or linked CSV) and paste your own service records following the same column headers.
4️⃣ Refresh the browser — every KPI card, chart and table updates instantly.
5️⃣ Use slicers and filters — filter by region, technician, priority or service type directly from the dashboard pages.
6️⃣ Export or present — use the built-in CSV export on the Data View page, or press Print to save any page as PDF.
💼 Real-World Use Cases
Rajesh runs a 12-technician residential HVAC company in Pune. He uses the HVAC Service Dashboard in HTML to review technician ratings and response times every Monday morning. Because the whole dashboard is a single HTML file, his office manager simply drops the updated file into Dropbox and every supervisor sees the latest numbers — no per-user SaaS fee for seasonal helpers.
Dana manages 4 HVAC branches for a commercial service contractor in Texas. She uses the Regional Insights page to compare average revenue per service across her Dallas, Houston, Austin and San Antonio branches, then uses the Service Analysis page to find out why Houston’s parts cost is 22% higher than the others — without waiting three weeks for her old BI team to build a custom report.
Mark is a field-service consultant. He customises the HVAC Service Dashboard in HTML for each new client, drops it into a ZIP file and emails it as a deliverable. Because the template is fully offline HTML, his clients can review it on a plane, in a site office or at home — no VPN, no SaaS login.
❓ Frequently Asked Questions
What is the HVAC Service Dashboard in HTML?
The HVAC Service Dashboard in HTML is a single self-contained HTML file that tracks 6 KPIs and 20+ charts across 5 pages — Overview, Service Analysis, Technician Performance, Regional Insights and Data View — for HVAC service companies that want offline reporting without any SaaS subscription.
Which KPIs does the HVAC Service Dashboard track?
The HVAC Service Dashboard in HTML tracks 6 key performance indicators: Total Revenue, Total Services, Average Customer Rating, Average Response Time, Completed Services and Pending Services. All six recalculate automatically the moment you replace the sample data with your own records.
Do I need coding skills to use this HTML dashboard?
No. You only need to open the HTML file in a browser and edit a structured data file. If you can copy and paste into a spreadsheet, you can use the HVAC Service Dashboard in HTML. No JavaScript or HTML knowledge is needed for day-to-day use.
Does the HVAC Service Dashboard in HTML work offline?
Yes. The HVAC Service Dashboard in HTML runs entirely in the browser with no server, no internet and no cloud. You can use it on a laptop on site, on a tablet without Wi-Fi, or host it on any internal shared drive.
How does this compare to ServiceTitan or Housecall Pro?
ServiceTitan and Housecall Pro are full field-service management platforms charging $99–398 per technician per month. The HVAC Service Dashboard in HTML is a one-time $12.99 reporting layer — perfect for contractors who want dashboard visibility without committing to a per-seat SaaS subscription.
How long does setup take?
Under 5 minutes. Unzip the folder, open index.html in any modern browser, paste your service records into the data file and refresh — the dashboard updates instantly with your own HVAC service data.
👤 About the Author
Built by PK — Microsoft Certified Professional with 15+ years of Excel, Google Sheets, and Power BI experience. Founder of NextGenTemplates, reaching 300K+ subscribers across YouTube channels (@PK-AnExcelExpert, @NextGenTemplates, @NeoTechNavigators). Every template is hand-built and tested before release.
🔗 Explore Related Templates
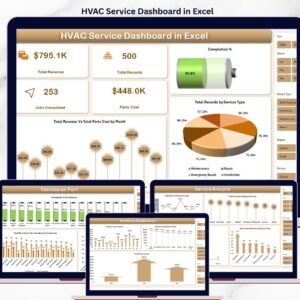
Need the same data in a different tool? Check the HVAC Service Dashboard in Excel if your team lives in Excel, or the Field Service KPI Dashboard in Google Sheets for a cloud-collaboration option.
Looking for more HTML service dashboards? Explore the Trucking and Logistics Dashboard in HTML, the Veterinary Clinic Dashboard in HTML, and the Laundromat Dashboard in HTML. Or browse the full range of HTML Dashboard Templates covering every industry.
📖 Click here to read the Detailed Blog Post
Watch the step-by-step video tutorial:
🎥 Visit our YouTube channel for step-by-step video tutorials
👉 YouTube.com/@NextGenTemplates


Reviews
There are no reviews yet.