
Lead your business with confidence using the General Management KPI Scorecard in HTML — a premium, browser-based executive scorecard template designed for CEOs, general managers, COOs, business owners, and senior leaders who need a single-page health check of the entire organization. This HTML KPI scorecard tracks 10 cross-functional management KPIs covering revenue, profitability, people, customers, market position, cash, and innovation — all with traffic light indicators, sparkline trends, and multi-dimensional comparisons against targets and prior-year benchmarks. It is a complete HTML dashboard template that runs in any modern browser with zero software installation.
Built as a single self-contained HTML file, this scorecard loads instantly on any laptop, desktop, or tablet and needs nothing more than a web browser — no Excel license, no Power BI Pro subscription, and no IT ticket. Whether you run a fast-growing startup or a mature enterprise, the General Management KPI Scorecard gives you a one-glance view of how the business is actually performing versus where it should be.
General Management KPI Scorecard
🔑 Key Features of the General Management KPI Scorecard in HTML
This scorecard is engineered to turn messy management reporting into a single, elegant command center. Here is exactly what you get:
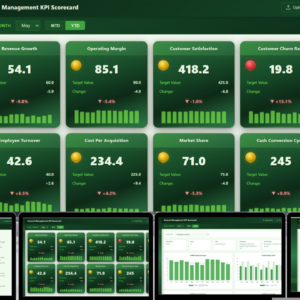
📊 10 Management KPIs Across the Full Business — The scorecard tracks Revenue Growth, Operating Margin, Customer Satisfaction, Customer Churn Rate, Employee Engagement, Employee Turnover, Cost Per Acquisition, Market Share, Cash Conversion Cycle, and Innovation Revenue. Together these 10 KPIs give general managers a 360° view of financial health, people performance, customer loyalty, and strategic position.
🚦 Traffic Light Health Indicators — Every KPI card displays a green, yellow, or red status badge based on performance versus target. Green means on or above target, yellow means within 10% of target, red means more than 10% off target. No spreadsheet-reading required.
📈 Sparkline Trend Charts on Every Card — Each KPI card includes an embedded sparkline showing the monthly actual trend across the fiscal year, so you can spot momentum and inflection points without opening another page.
🗓️ MTD and YTD Toggle — One click switches every KPI between Month-to-Date and Year-to-Date view, giving you both short-term operational pulse and cumulative strategic view in the same file.
⚖️ Vs Target and Vs Previous Year Modes — A dropdown flips the entire scorecard between target-based comparison and year-over-year comparison, covering the two most-asked executive questions instantly.
🔍 Dedicated KPI Trend Analysis Page — Click any KPI and drill into 4 monthly comparison charts: MTD Actual vs Target, MTD Actual vs Previous Year, YTD Actual vs Target, and YTD Actual vs Previous Year. Perfect for board preparation and root-cause analysis.
📤 Export to CSV and Vector PDF — Generate board-ready, print-quality PDF reports or raw CSV extracts directly from the browser — no screen capture tools needed.
🧾 Upload Your Own Excel Data — A companion Excel data template is included. Replace the sample values with your own monthly numbers, reload the scorecard, and every KPI card, traffic light, sparkline, and chart updates automatically.
📦 What’s Inside the General Management KPI Scorecard in HTML
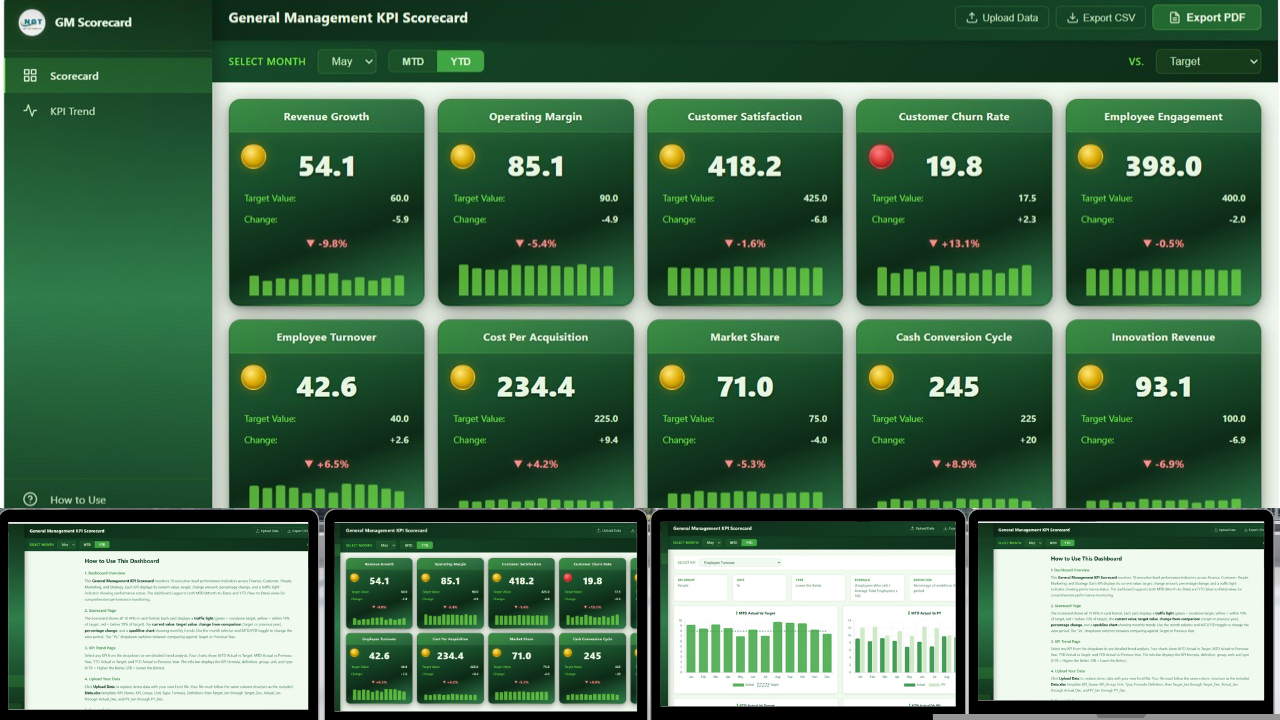
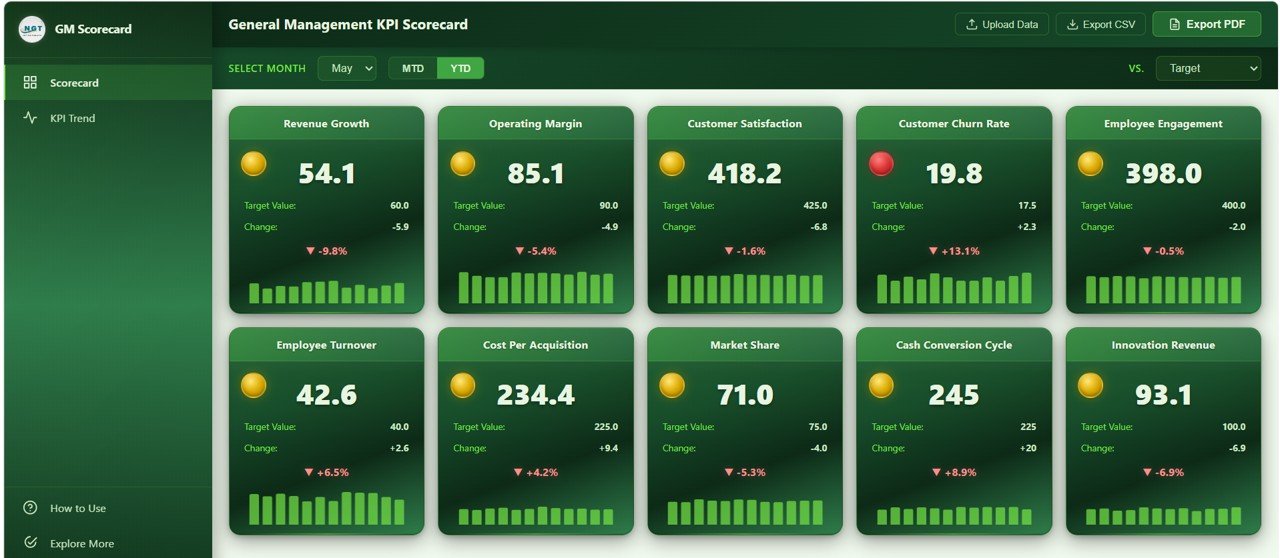
The template ships as a single self-contained HTML file plus a companion Excel data template, organized across four purpose-built pages:
🏠 Page 1 — Scorecard: The executive command center. Filter bar at the top lets you pick the reporting month, flip between MTD and YTD, and switch between Vs Target and Vs Previous Year. 10 KPI cards are laid out in a responsive grid: Revenue Growth, Operating Margin, Customer Satisfaction, Customer Churn Rate, Employee Engagement, Employee Turnover, Cost Per Acquisition, Market Share, Cash Conversion Cycle, and Innovation Revenue. Each card shows current value, target value, variance, % change, traffic light badge, and a sparkline of the 12-month actual trend. Below the cards sit 10 monthly trend mini-charts — one per KPI — so the full year story is visible in a single scroll.

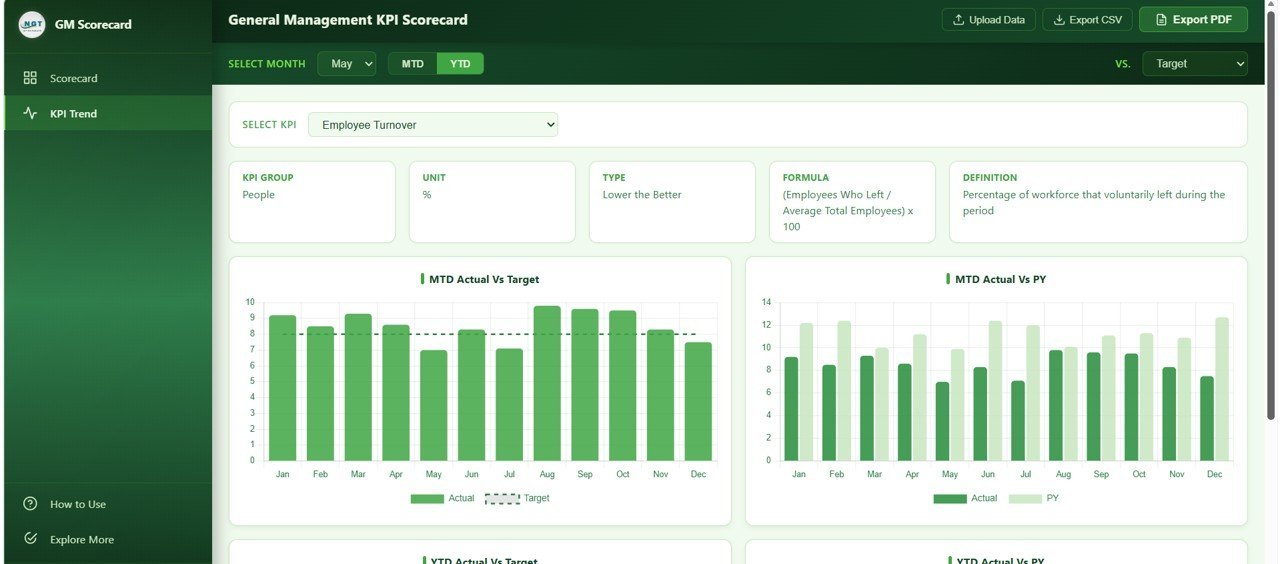
KPI Trend Analysis
📈 Page 2 — KPI Trend Analysis: A dedicated deep-dive page for any single KPI. A dropdown selector lets you pick any of the 10 management KPIs and instantly see four comparison charts — Actual vs Target by Month to spot monthly performance gaps, Actual vs Previous Year by Month for year-over-year momentum, Year to Date Actual vs Target by Month to track cumulative progress toward annual goals, and Year to Date Actual vs Previous Year by Month for cumulative YoY context. An information bar shows the KPI definition, formula, unit, and grouping so non-finance audiences stay oriented.
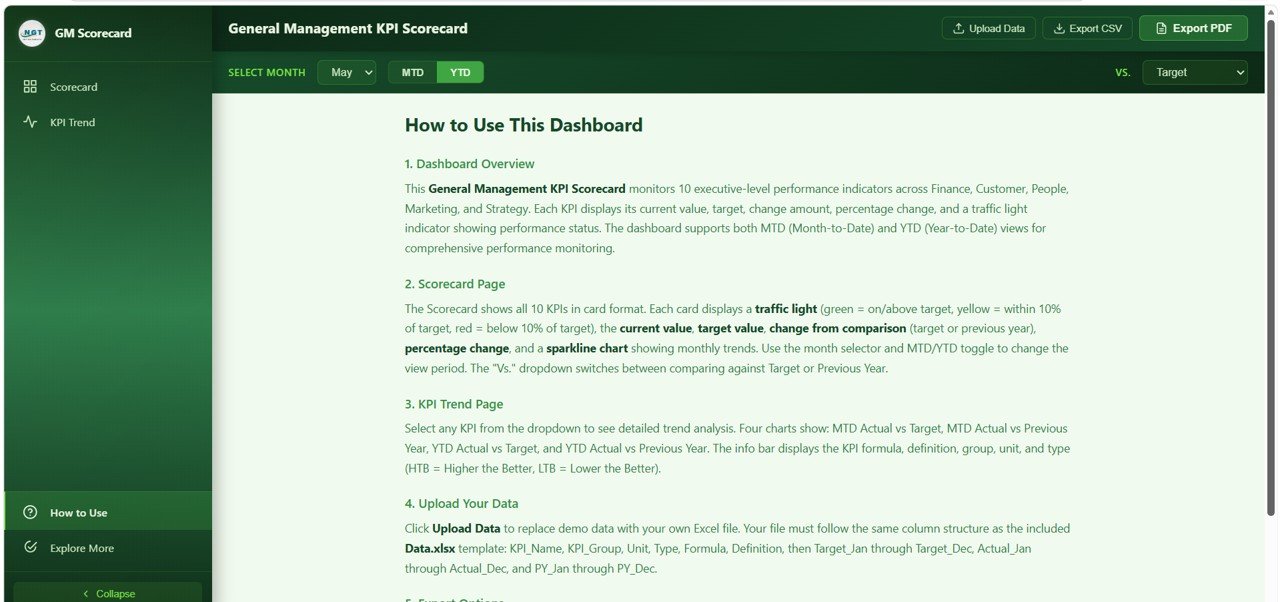
How to Use Guide
📖 Page 3 — How to Use: Built-in documentation that walks any team member through the dashboard — how to interpret the traffic light indicators, how to use the scorecard filters, how to read the trend charts, how to upload your own data, and how to export CSV and PDF reports. Zero training sessions needed.
🔗 Page 4 — Explore More: A curated showcase of related premium templates — the Google Sheets version, the Excel version, companion CFO dashboards, and the full NextGenTemplates library of Excel dashboard templates and HTML scorecards. Includes a welcome coupon code for first-time buyers.
⚙️ How to Use the General Management KPI Scorecard in HTML
- Download and unzip — Extract the ZIP file to any folder on your computer.
- Open index.html — Double-click the HTML file. It opens in your default browser with sample data pre-loaded.
- Explore the sample scorecard — Try the month selector, MTD/YTD toggle, and Vs Target / Vs Previous Year dropdown to see the dashboard in action.
- Enter your own data — Open the companion Excel data template. Replace the sample monthly actuals, targets, and previous-year figures for each of the 10 KPIs with your own numbers.
- Reload the dashboard — Refresh index.html. Every KPI card, traffic light, sparkline, and trend chart updates automatically.
- Share and export — Use the CSV export for raw data sharing, or generate a vector PDF for the next board meeting.
👥 Who Can Benefit from This Scorecard
This template is built for anyone who owns cross-functional business performance and needs a one-page executive view:
👔 CEOs and General Managers who run weekly or monthly leadership reviews and need a single source of truth for the full business.
💼 COOs and Heads of Operations tracking operating margin, CCC, and employee turnover alongside customer and revenue KPIs.
📊 Business Analysts and FP&A Teams who build management reports and want a reusable, professional scorecard that stakeholders actually read.
🚀 Startup Founders tracking innovation revenue, CPA, market share, and employee engagement alongside traditional finance metrics.
🏢 Board Members and Investors who receive monthly business updates and want consistent, comparable KPI reporting at every meeting.
🎓 MBA Students and Consultants who need a professional management reporting template for case studies, client engagements, or strategic plans. Pair this with our Google Sheets Dashboards or Power BI Dashboards for a multi-format reporting pack.
❓ Frequently Asked Questions
What KPIs does the General Management KPI Scorecard track?
The General Management KPI Scorecard in HTML tracks 10 cross-functional management KPIs: Revenue Growth, Operating Margin, Customer Satisfaction, Customer Churn Rate, Employee Engagement, Employee Turnover, Cost Per Acquisition, Market Share, Cash Conversion Cycle, and Innovation Revenue. Each KPI is displayed with traffic light indicators, sparkline trends, current value, target value, and variance.
Do I need Excel, Power BI, or any software to use this scorecard?
No. The General Management KPI Scorecard is a self-contained HTML file that runs in any modern web browser (Chrome, Edge, Firefox, or Safari). There is no software installation, no license, no plugin, and no internet connection required after download.
How do I add my own monthly KPI data to the scorecard?
A companion Excel data template ships with the download. Open the Excel file, replace the sample monthly actuals, monthly targets, and previous-year figures for each of the 10 KPIs with your own numbers, save the file, then reload index.html in your browser. Every KPI card, traffic light, sparkline, and chart updates automatically.
What is the difference between the Vs Target and Vs Previous Year views?
Vs Target compares current actuals against the budgeted targets for each month, which is ideal for answering the question “are we on plan?”. Vs Previous Year compares current actuals against the same period from last year, which is better for spotting momentum and year-over-year growth. A single dropdown flips the entire scorecard between both modes.
Can I export board-ready reports from this HTML scorecard?
Yes. The scorecard supports two export formats: CSV for raw data sharing with analysts, and vector PDF for high-resolution, print-ready reports suitable for board meetings, executive reviews, and investor updates. Both exports are generated directly from the browser with no additional tools.
Is this scorecard suitable for startups as well as large enterprises?
Yes. The 10 KPIs included — Revenue Growth, Operating Margin, Customer Satisfaction, Churn Rate, Employee Engagement, Turnover, CPA, Market Share, Cash Conversion Cycle, and Innovation Revenue — are universal general management metrics that apply to early-stage startups, mid-sized businesses, and mature enterprises. Targets and benchmarks can be customized per company in the Excel data template.
🔗 Explore Related Templates
- 📌 Finance KPI Scorecard in HTML — The finance-focused sibling of this scorecard, tracking 10 finance KPIs with the same traffic light and MTD/YTD framework.
- 📌 Warehouse Efficiency Dashboard in HTML — A 5-page HTML operations dashboard for shipment, storage, and worker productivity analytics.
- 📌 Event Management Analysis Dashboard in HTML — Browser-based event analytics with 6 KPIs and 20+ charts.
- 📌 Browse all HTML Dashboard Templates — Full library of browser-native analytics templates.


Reviews
There are no reviews yet.