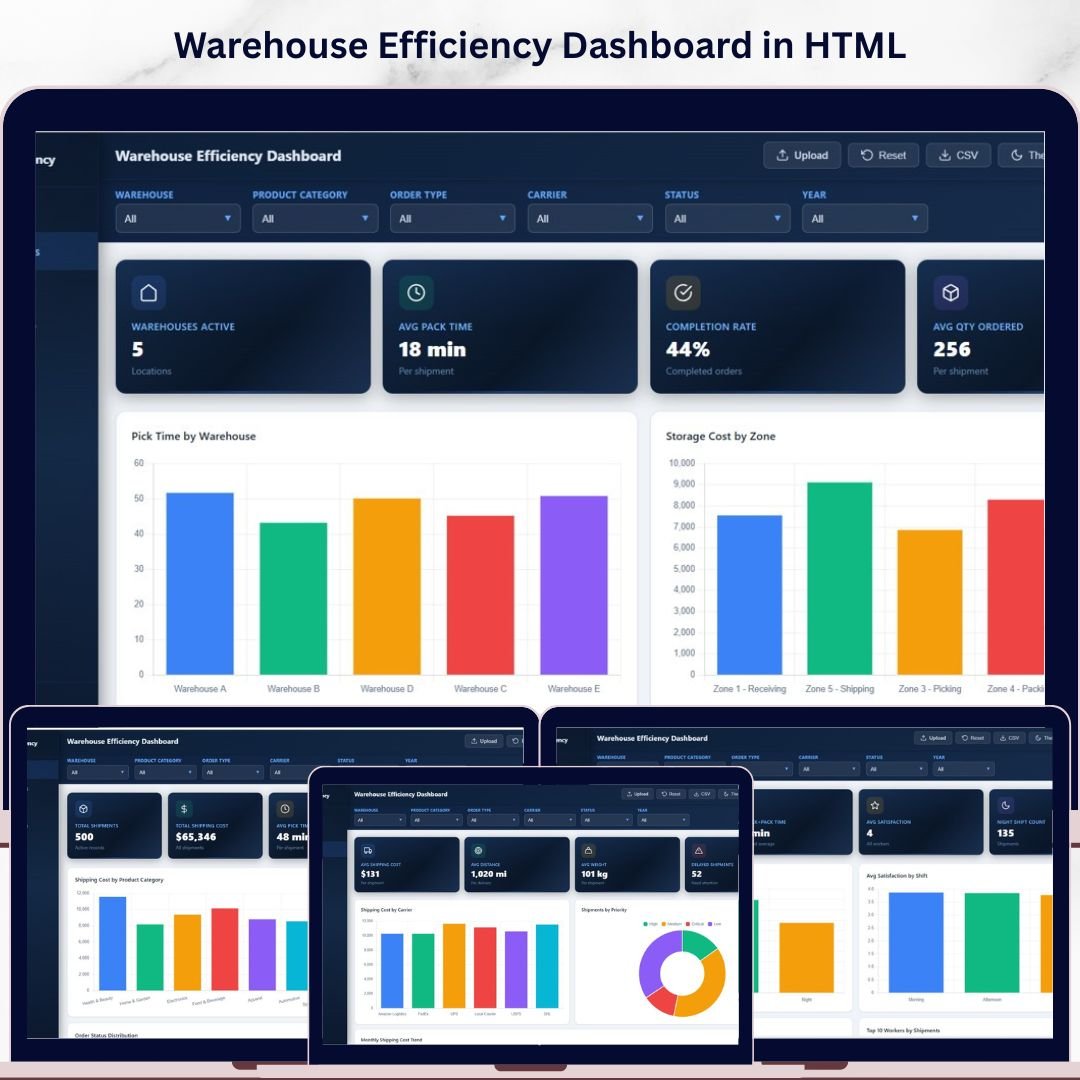
Warehouse Efficiency Dashboard in HTML is a modern, interactive, and browser-based dashboard template designed for warehouse managers, logistics coordinators, supply chain directors, and operations teams who need to monitor shipment performance, storage costs, worker productivity, and shipping efficiency from a single centralized HTML Dashboard. This template includes 5 interactive dashboard pages and tracks 6 key performance indicators including Total Shipments, Total Shipping Cost, Avg Pick Time, Total Storage Cost, Avg Satisfaction, and Total Qty Shipped.
Without a centralized warehouse reporting tool, operations teams struggle with scattered data, slow order processing, and rising shipping costs. The Warehouse Efficiency Dashboard in HTML eliminates these blind spots by transforming your raw warehouse data into clear, actionable visuals with dynamic charts, KPI cards, and slicer-based filtering. Whether you manage a single warehouse or multiple facilities, this dashboard gives you the clarity you need to optimize every aspect of warehouse operations — from picking and packing to carrier selection and worker shift analysis 📊📦.
 Warehouse Efficiency Dashboard Overview
🔑 Key Features of Warehouse Efficiency Dashboard in HTML
📊 5 Interactive Dashboard Pages — The template delivers complete warehouse performance visibility across Overview, Warehouse Analysis, Shipping Insights, Worker Productivity, and Data View pages. Each page is packed with dynamic charts and slicers for instant filtering by product category, warehouse, order type, carrier, shift, zone, and priority level.
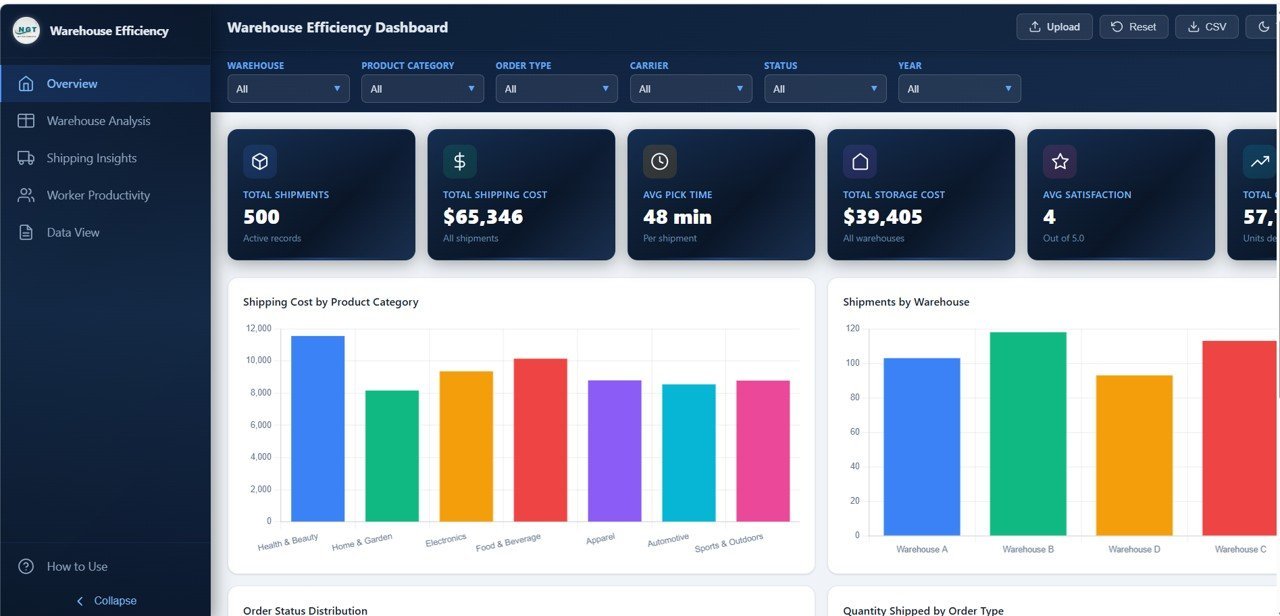
📈 6 High-Level KPI Summary Cards — The Overview page displays KPI cards including Total Shipments, Total Shipping Cost, Avg Pick Time, Total Storage Cost, Avg Satisfaction, and Total Qty Shipped — providing an instant health check of your warehouse operations at a glance.
🔍 Dynamic Slicer Controls — Apply filters across all pages to drill down into specific product categories, warehouses, order types, carriers, shifts, and zones for targeted analysis and executive presentations.
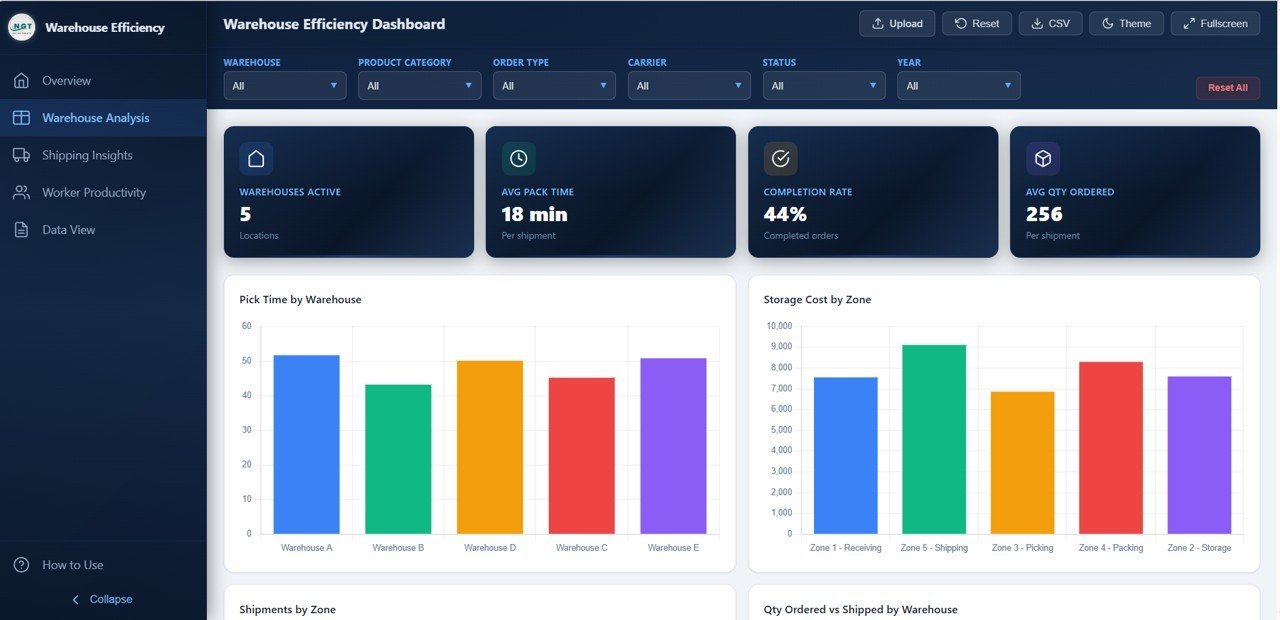
📦 Warehouse Zone Analysis — The Warehouse Analysis page provides deep-dive insights with charts covering Pick Time by Warehouse, Storage Cost by Zone, Shipments by Zone, and Quantity Ordered vs Shipped by Warehouse — critical metrics for optimizing warehouse layout and zone allocation.
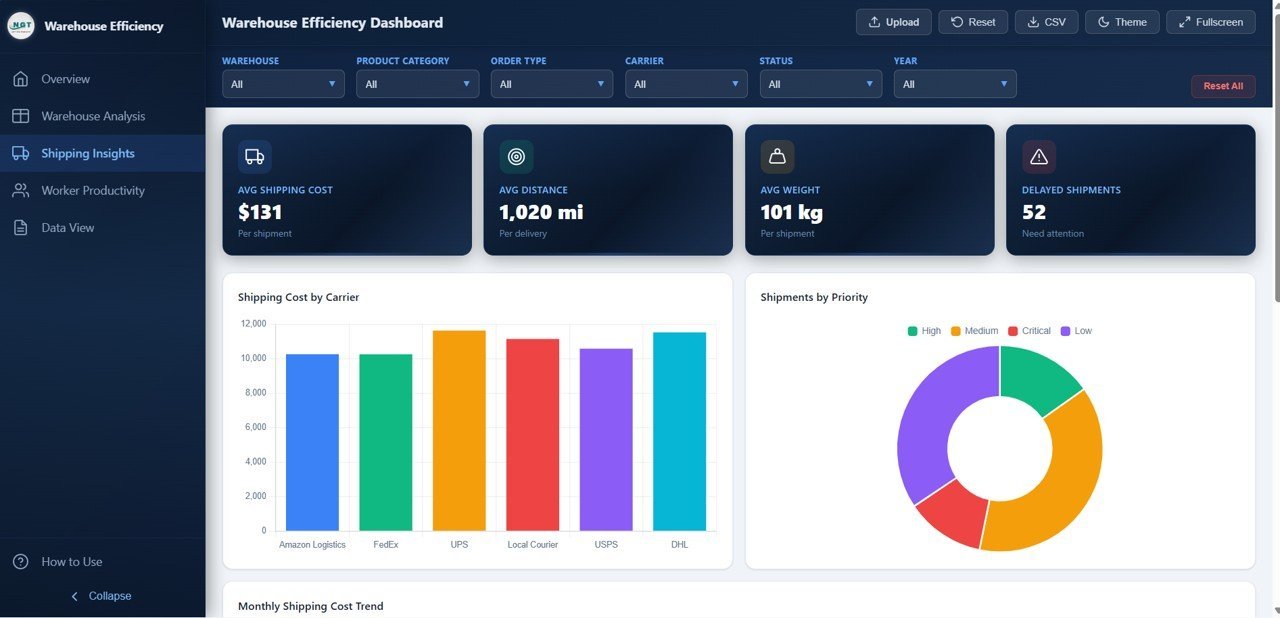
🚚 Shipping Cost Intelligence — The Shipping Insights page analyzes Shipping Cost by Carrier, Shipments by Priority, Monthly Shipping Cost Trend, and Average Distance by Carrier — helping logistics teams negotiate better rates and choose the most cost-effective carriers.
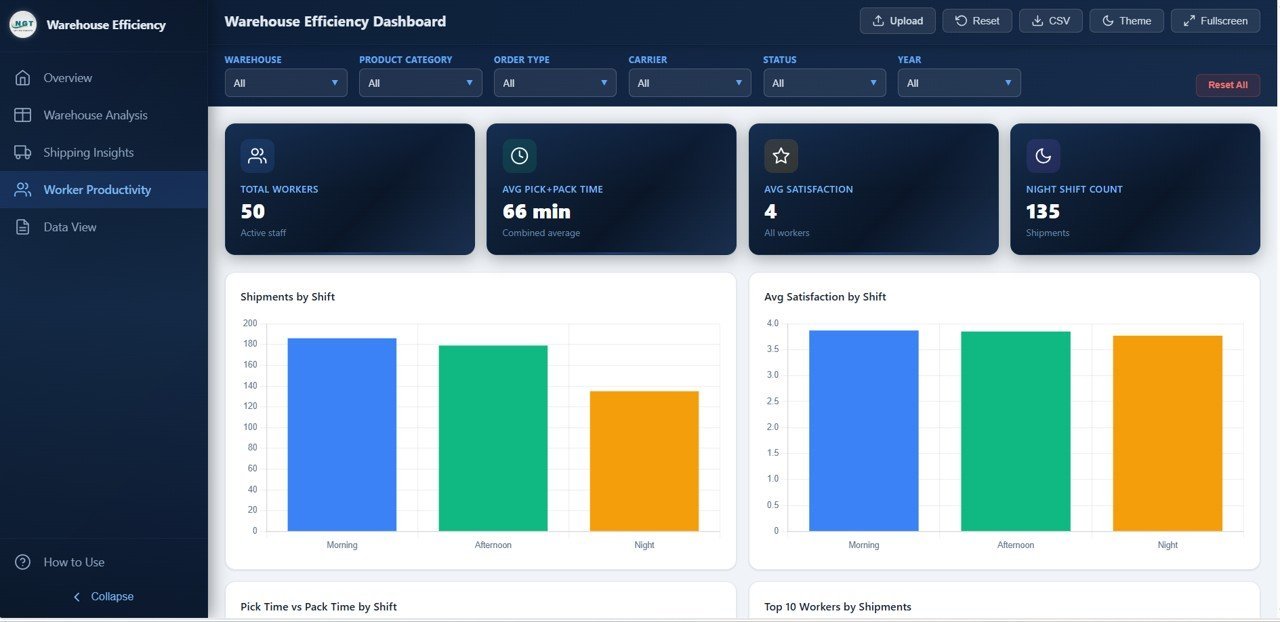
👷 Worker Productivity Tracking — The Worker Productivity page compares Shipments by Shift, Average Satisfaction Score by Shift, Pick Time vs Pack Time by Shift, and Top 10 Workers by Shipments — essential for workforce planning, performance reviews, and shift optimization.
📋 Data View with Search and Export — Access every record in a detailed data table with built-in search, sorting, pagination, and CSV export functionality for deeper analysis and custom reporting.
⚡ No Software Required — Simply unzip the file and open index.html in any modern web browser like Chrome, Edge, or Firefox. The dashboard works completely offline with no installation needed.
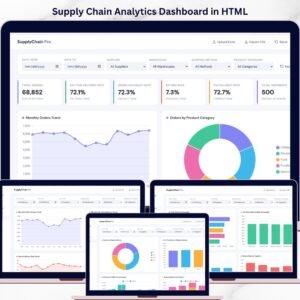
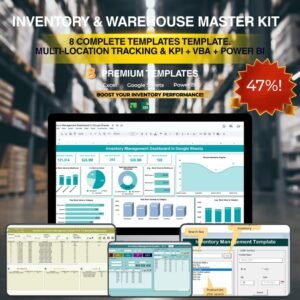
If you manage warehouse operations across multiple locations, consider the Inventory & Warehouse Master Kit which bundles 8 premium templates at 36% savings. For complementary supply chain analytics, explore the Supply Chain Analytics Dashboard in HTML and the Vendor Performance Dashboard in HTML. Browse all available HTML Dashboard Templates on NextGenTemplates.
📦 What’s Inside the Warehouse Efficiency Dashboard in HTML
📊 Overview Page — The main summary page displays 6 KPI cards (Total Shipments, Total Shipping Cost, Avg Pick Time, Total Storage Cost, Avg Satisfaction, Total Qty Shipped) along with analytical charts covering Shipping Cost by Product Category, Shipments by Warehouse, Order Status Distribution, and Quantity Shipped by Order Type. Multiple slicers let you apply filters and see the filtered dashboard quickly.
Warehouse Efficiency Dashboard Overview📊 Warehouse Analysis Page — Deep-dive into warehouse-level performance with charts for Pick Time by Warehouse, Storage Cost by Zone, Shipments by Zone, and Quantity Ordered vs Shipped by Warehouse. This page helps warehouse teams optimize zone allocation, reduce pick times, and balance workload across facilities.
 Warehouse Analysis
📊 Shipping Insights Page — Focused analysis on shipping efficiency with charts for Shipping Cost by Carrier, Shipments by Priority, Monthly Shipping Cost Trend, and Average Distance by Carrier. This page helps logistics teams identify the most cost-effective carriers and track shipping cost patterns over time.
 Shipping Insights
📊 Worker Productivity Page — Comprehensive workforce analysis with charts for Shipments by Shift, Average Satisfaction Score by Shift, Pick Time vs Pack Time by Shift, and Top 10 Workers by Shipments. This page is essential for identifying top performers, optimizing shift schedules, and improving worker satisfaction.
 Worker Productivity
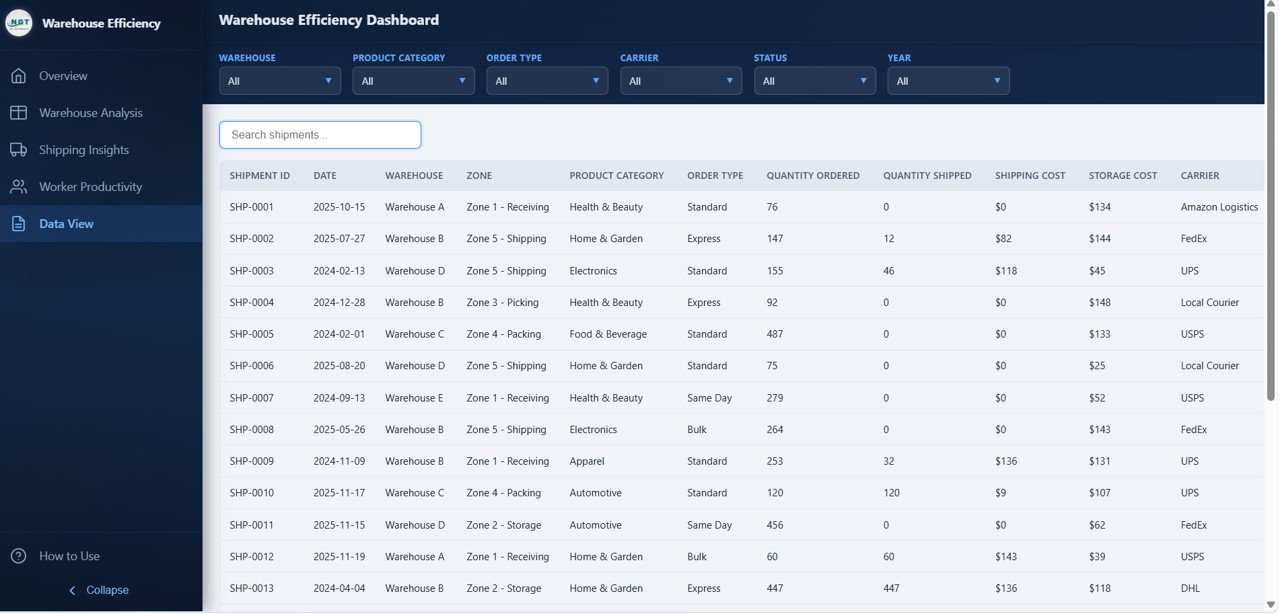
📋 Data View Page — This is the detailed data table page where you can see all records with search, sort, and pagination features. You can also export the filtered data to CSV for further analysis and custom reporting.
 Data View
⚙️ How to Use the Warehouse Efficiency Dashboard in HTML
1️⃣ Download and Extract — Download the ZIP file and extract it to any folder on your computer.
2️⃣ Open in Browser — Double-click index.html to open the dashboard in Chrome, Edge, Firefox, or any modern browser.
3️⃣ Replace Sample Data — Open the data file and replace the demo data with your actual warehouse, shipping, and worker records.
4️⃣ Analyze Performance — Navigate through the 5 dashboard pages to monitor KPIs, compare warehouses, track shipping costs, and evaluate worker productivity.
5️⃣ Export Data — Use the Data View page to search, filter, and export records to CSV for presentations and reporting.
👥 Who Can Benefit from This Warehouse Efficiency Dashboard in HTML
📦 Warehouse Managers — Monitor daily throughput, picking times, storage costs, and order fulfillment across zones and shifts.
🚚 Logistics Coordinators — Analyze carrier performance, shipping costs, and delivery priorities to optimize logistics operations.
📊 Supply Chain Directors — Get executive-level visibility into warehouse performance, shipping efficiency, and workforce productivity.
👷 Operations Teams — Track shift-level productivity, satisfaction scores, and identify operational bottlenecks quickly.
🏢 Small Business Owners — Run professional warehouse analytics without investing in expensive warehouse management software.
📈 Data Analysts — Use the interactive dashboard and export features for custom warehouse analysis and reporting.
❓ Frequently Asked Questions
What KPIs does the Warehouse Efficiency Dashboard in HTML track?
The Warehouse Efficiency Dashboard in HTML tracks 6 key performance indicators: Total Shipments, Total Shipping Cost, Avg Pick Time, Total Storage Cost, Avg Satisfaction, and Total Qty Shipped. These KPIs are displayed on the Overview page through interactive KPI cards and are analyzed across all 5 dashboard pages.
How many dashboard pages are included in this template?
This dashboard includes 5 interactive pages: Overview, Warehouse Analysis, Shipping Insights, Worker Productivity, and Data View. Each page provides unique analytical perspectives on warehouse efficiency and operations.
Do I need any special software to use this HTML dashboard?
No special software is required. Simply unzip the downloaded file and open index.html in any modern web browser like Chrome, Edge, or Firefox. The dashboard works completely offline without any installation.
Can I track worker productivity and shift performance with this dashboard?
Yes. The Worker Productivity page includes dedicated charts for Shipments by Shift, Average Satisfaction Score by Shift, Pick Time vs Pack Time by Shift, and Top 10 Workers by Shipments. These metrics help you optimize shift schedules and identify top-performing workers.
What is the best HTML dashboard template for warehouse efficiency tracking?
The Warehouse Efficiency Dashboard in HTML from NextGenTemplates is one of the most comprehensive warehouse analytics templates available. It features 5 interactive dashboard pages covering shipment tracking, warehouse zone analysis, shipping cost intelligence, worker productivity, and a data explorer with CSV export — all in an interactive browser-based format.
Can I replace the sample data with my own warehouse data?
Yes. The dashboard includes a data file where you can replace the sample records with your own warehouse, shipping, and worker data. Once updated, all charts and KPIs refresh automatically across all 5 pages.
🔗 Explore Related Templates
📊 Warehouse Efficiency Dashboard in Excel — Track warehouse operations, efficiency metrics, and logistics performance with pivot-driven charts in Excel.
📦 Inventory Management Dashboard in HTML — Monitor stock levels, warehouse performance, and inventory movement with interactive visuals.
🚚 Transportation and Logistics Dashboard in HTML — Track shipments, carriers, routes, and logistics KPIs in one interactive report.


Reviews
There are no reviews yet.