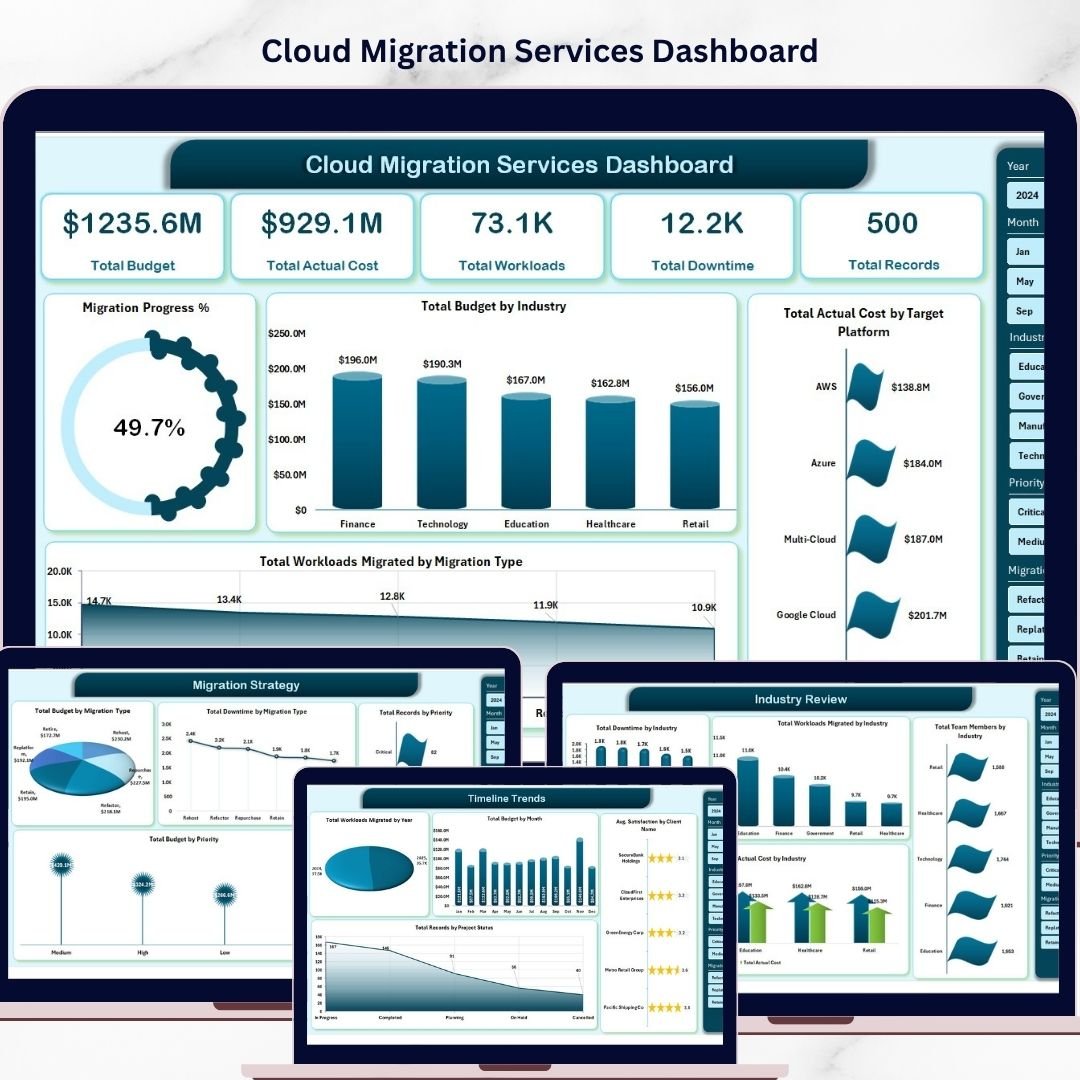


Cloud Migration Services Dashboard in Excel is a powerful, ready-to-use Excel dashboard template designed for IT teams, cloud architects, project managers, and consulting firms who manage cloud migration projects across multiple industries and platforms. This dashboard includes 5 interactive analytical pages, a structured data sheet, and a support sheet with pivot tables that power the entire dashboard dynamically. It tracks 5 key metrics including Total Budget, Total Actual Cost, Total Workloads, Total Downtime, and Total Records — giving you complete visibility into your cloud migration portfolio at a glance.
🔑 Key Features of Cloud Migration Services Dashboard in Excel
📊 5 Interactive Dashboard Pages — Overview, Platform Analysis, Industry Review, Migration Strategy, and Timeline Trends provide multi-dimensional analysis of your cloud migration projects.
📈 Dynamic Pivot-Powered Charts — Every chart is connected to pivot tables in the Support sheet, ensuring all visuals update instantly when you refresh your data.
🎛 Multiple Slicers for Quick Filtering — Apply filters across all pages to instantly drill down into specific industries, platforms, migration types, priorities, or time periods.
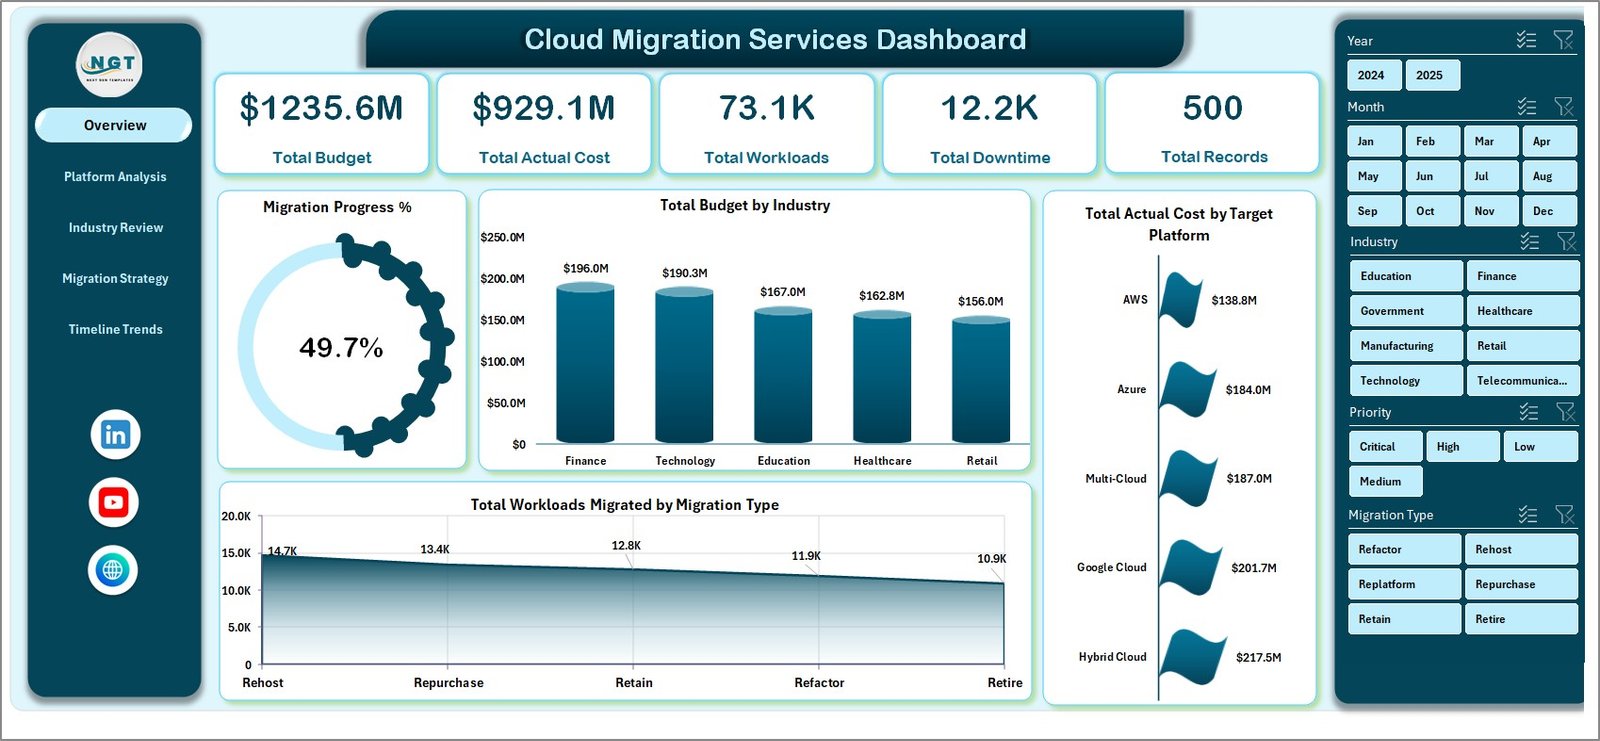
📋 5 KPI Cards on Overview Page — Total Budget, Total Actual Cost, Total Workloads, Total Downtime, and Total Records provide a high-level executive summary.
💰 Budget vs Actual Cost Comparison — Easily compare planned budgets against actual costs by source platform, industry, and migration type to identify cost overruns early.
🔄 Automatic Dashboard Refresh — Simply update data in the Data Sheet, go to the Data tab, and click Refresh All — every pivot table and chart updates instantly.
🏢 Industry-Level and Platform-Level Analysis — Understand which industries consume the most resources and which target platforms (AWS, Azure, GCP) drive the highest workload migration.
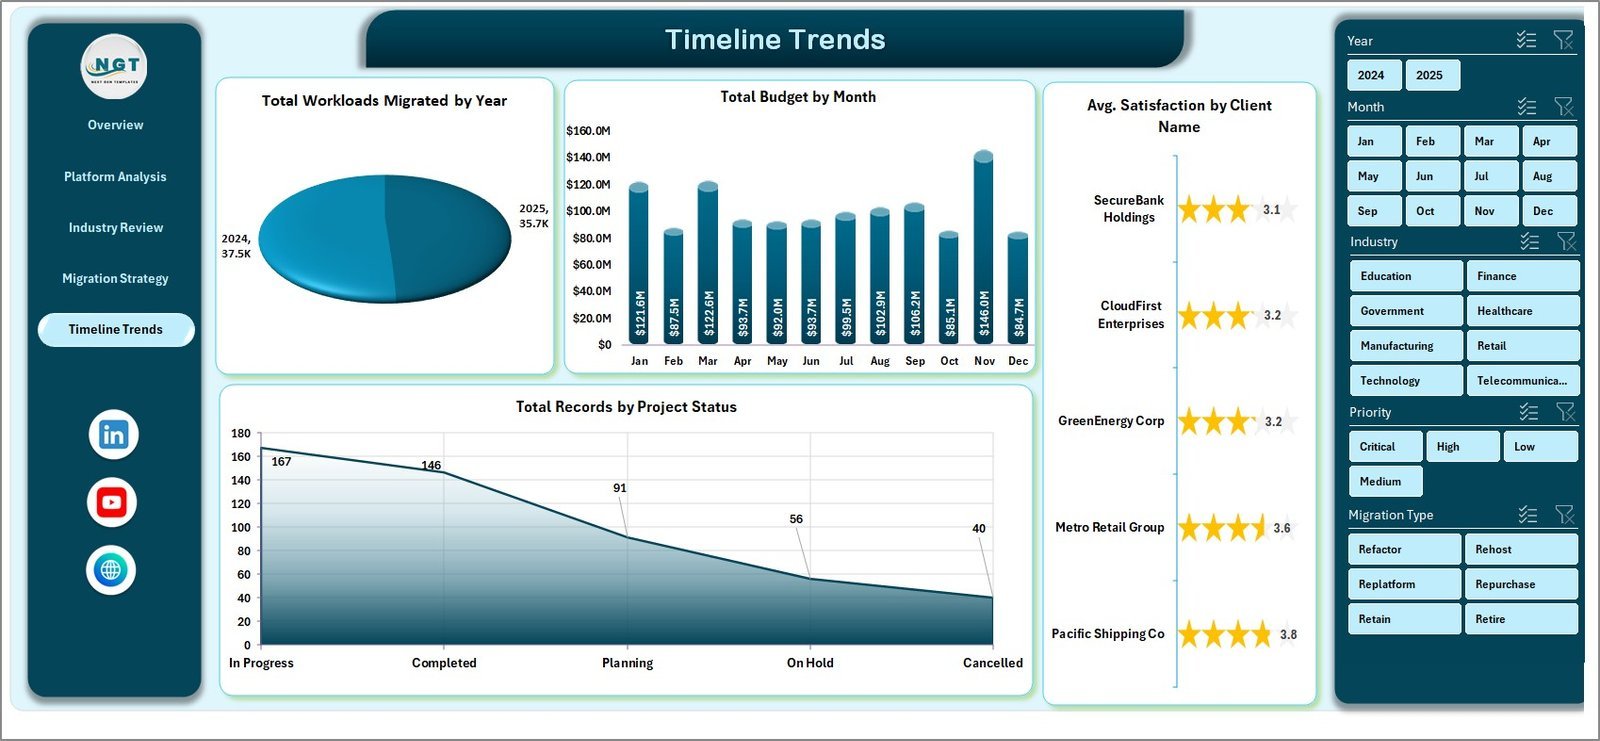
📅 Timeline Trends — Track workload migration by year, monthly budget trends, client satisfaction averages, and project status distribution over time.
📦 What’s Inside the Cloud Migration Services Dashboard in Excel
This Excel dashboard template includes 7 sheet tabs designed for comprehensive cloud migration tracking and analysis:
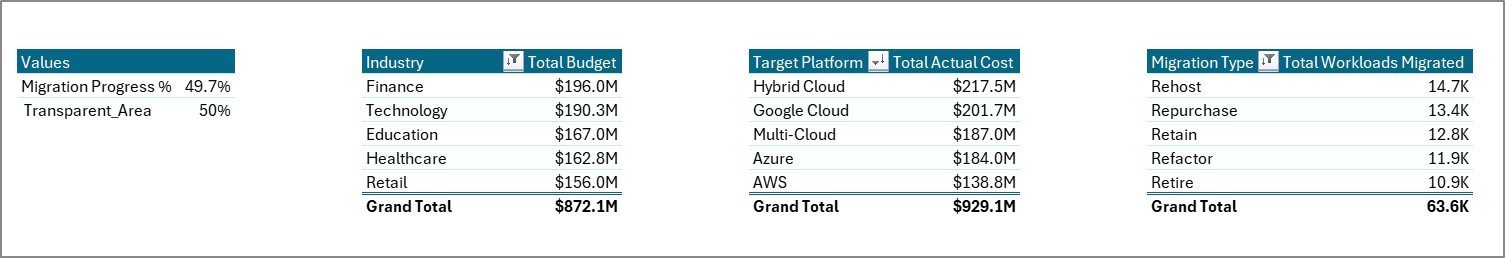
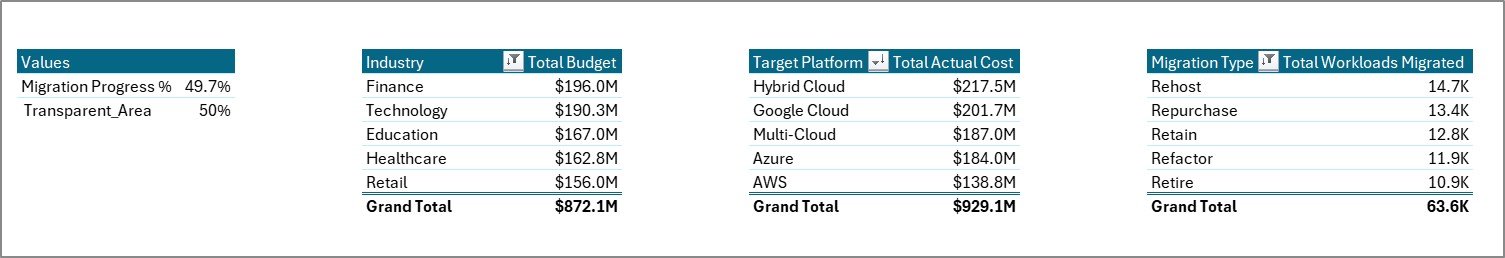
📊 Overview Page — Displays 5 KPI cards (Total Budget, Total Actual Cost, Total Workloads, Total Downtime, Total Records) along with charts showing Migration Progress % by Overall, Total Budget by Industry, Total Actual Cost by Target Platform, and Total Workloads Migrated by Migration Type. Multiple slicers allow instant filtering across all dimensions.
 Cloud Migration Services Dashboard
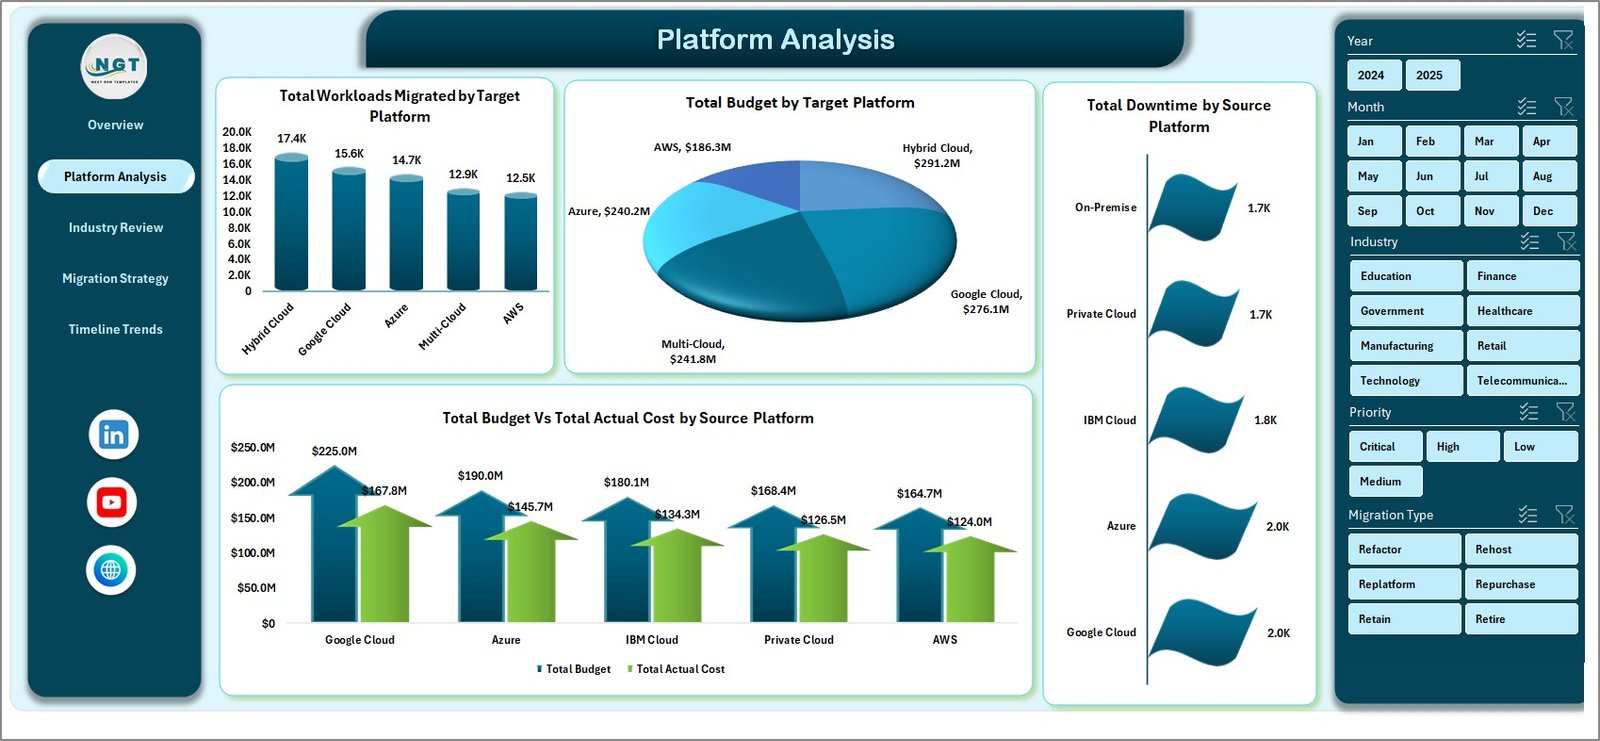
🖥 Platform Analysis Page — Provides deep analysis of cloud platforms with charts for Total Workloads Migrated by Target Platform, Total Budget by Target Platform, Total Downtime by Source Platform, and Total Budget Vs Total Actual Cost by Source Platform.
 Platform Analysis
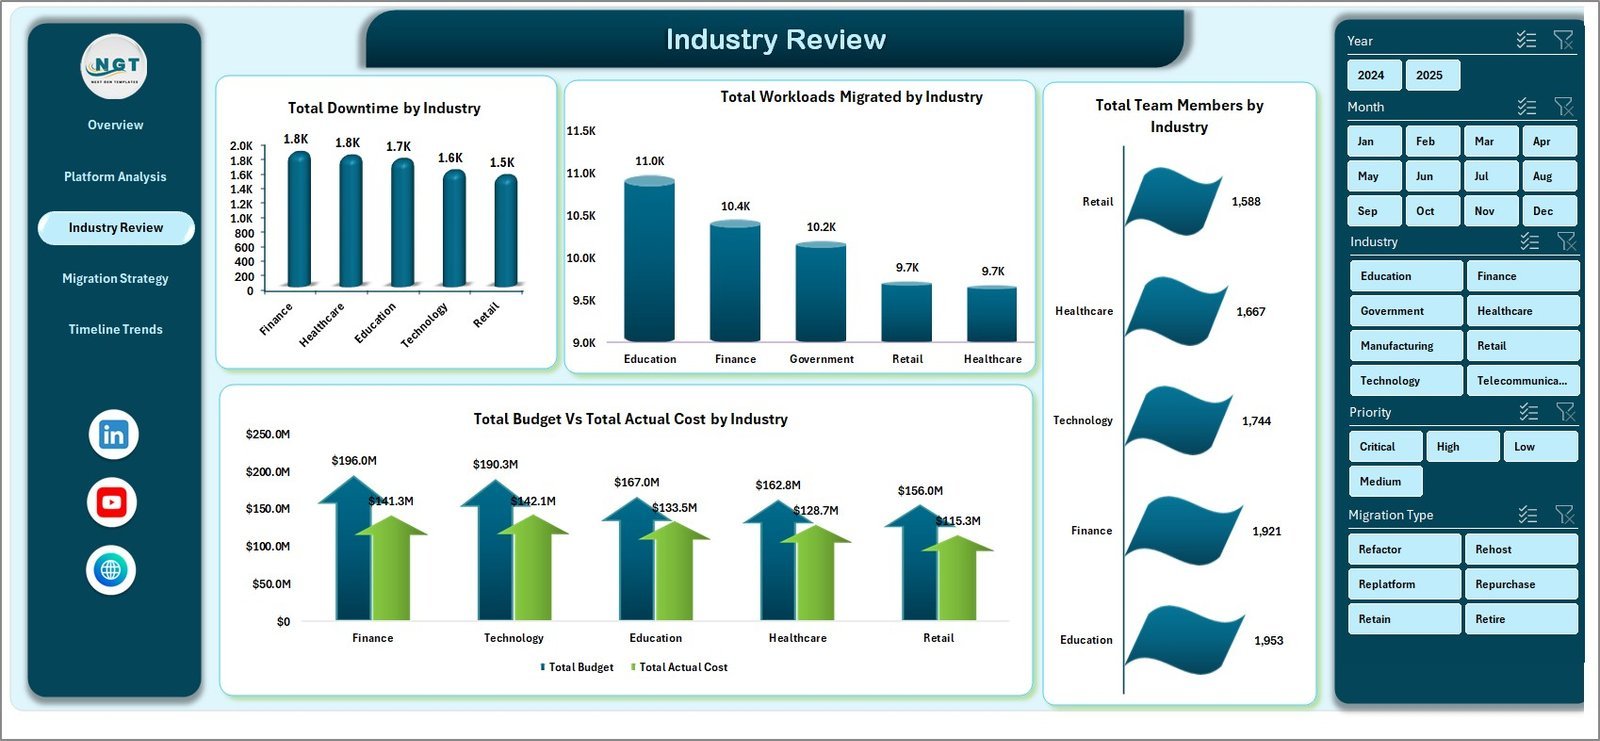
🏭 Industry Review Page — Analyzes cloud migration data by industry with charts for Total Downtime by Industry, Total Workloads Migrated by Industry, Total Team Members by Industry, and Total Budget Vs Total Actual Cost by Industry.
 Industry Review
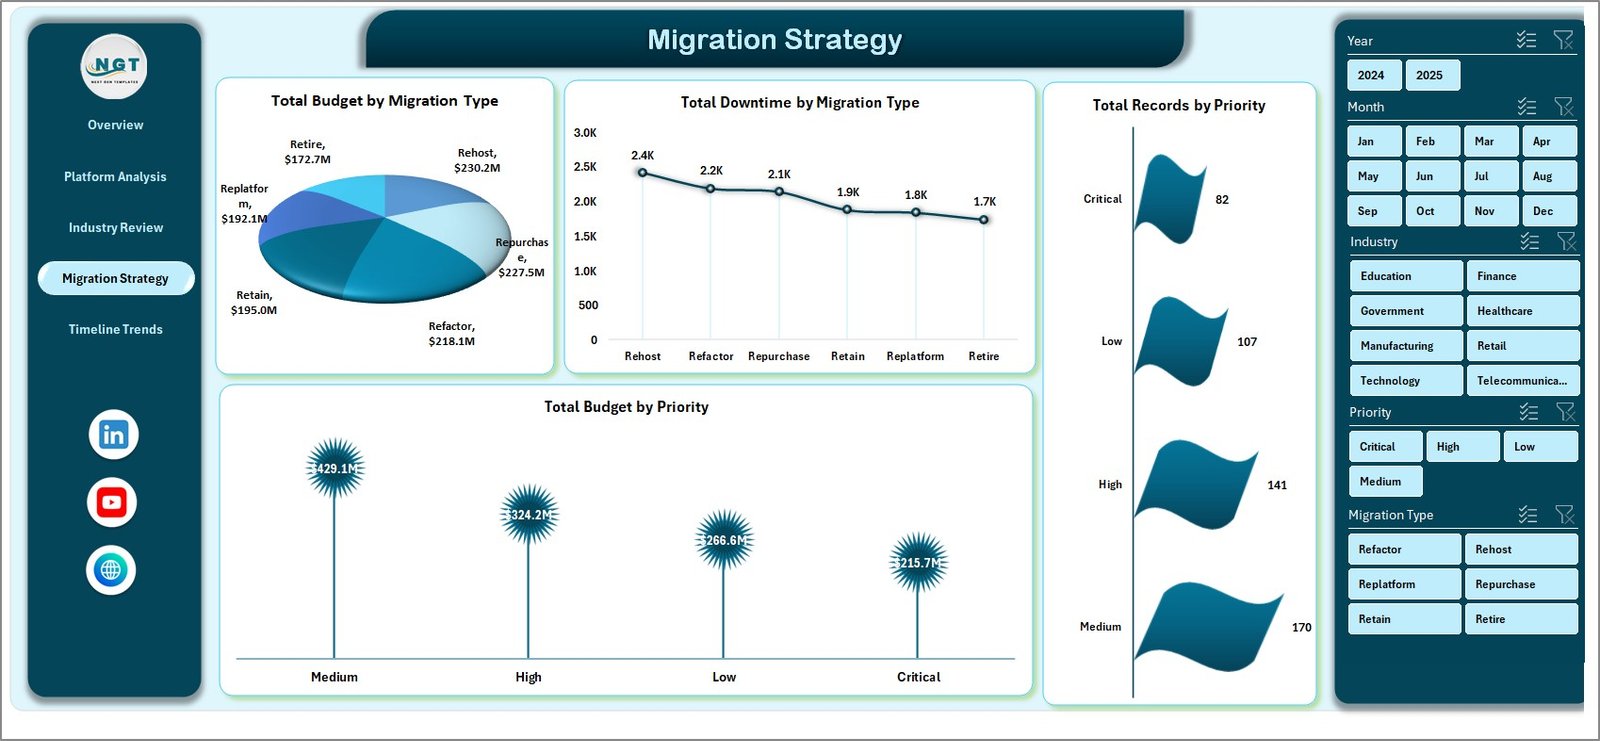
🔀 Migration Strategy Page — Focuses on migration approach analysis with charts for Total Budget by Migration Type, Total Downtime by Migration Type, Total Records by Priority, and Total Budget by Priority.
 Migration Strategy
📅 Timeline Trends Page — Tracks migration performance over time with charts for Total Workloads Migrated by Year, Total Budget by Month, Avg. Satisfaction by Client Name, and Total Records by Project Status.
 Timeline Trends
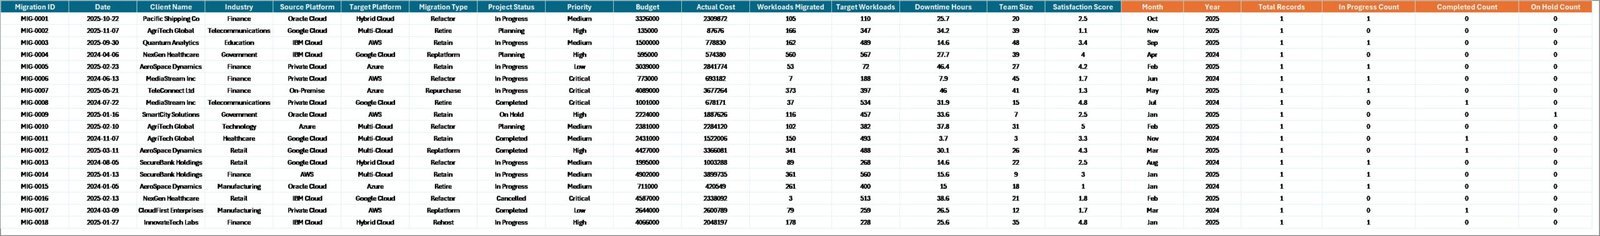
📋 Data Sheet Tab — The core data input sheet. Add your cloud migration records in the same format and refresh the dashboard.
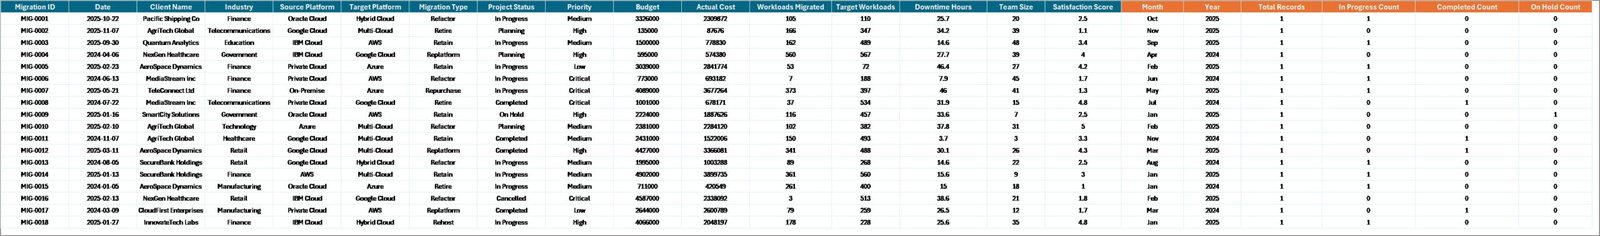 Data Sheet Tab
⚙ Support Sheet Tab — Contains multiple pivot tables powering all charts. After updating data, click Refresh All. Keep this sheet hidden during presentations.
 Support Sheet Tab
⚙️ How to Use the Cloud Migration Services Dashboard in Excel
1️⃣ Open the Excel File — Download and open in Microsoft Excel.
2️⃣ Navigate to the Data Sheet — Replace sample data with your own cloud migration project data.
3️⃣ Refresh All Pivots — Go to Data tab and click Refresh All.
4️⃣ Explore Dashboard Pages — Analyze data across Overview, Platform Analysis, Industry Review, Migration Strategy, and Timeline Trends.
5️⃣ Apply Slicers — Filter by industry, platform, migration type, priority, or project status.
6️⃣ Present to Stakeholders — Share insights with leadership and clients.
👥 Who Can Benefit from This Cloud Migration Services Dashboard in Excel
☁ Cloud Architects & Engineers — Track workload migration across platforms and monitor downtime and cost.
📋 IT Project Managers — Monitor budget vs actual cost, project status, and migration timelines.
🏢 IT Consulting Firms — Manage multi-industry cloud migration portfolios with a single dashboard.
💼 CIOs & IT Directors — Get executive-level visibility into cloud transformation progress.
📊 Business Analysts — Analyze migration trends and cost patterns for data-driven recommendations.
❓ Frequently Asked Questions
What metrics does the Cloud Migration Services Dashboard track?
It tracks Total Budget, Total Actual Cost, Total Workloads, Total Downtime, and Total Records across 5 dashboard pages covering platform performance, industry breakdown, migration strategy, and timeline trends.
Do I need advanced Excel skills?
No. Replace sample data in the Data Sheet and click Refresh All. All pivots and charts update automatically.
Can I add more data rows?
Yes. Add rows in the Data Sheet, click Refresh All, and the dashboard updates instantly.
What cloud platforms does this support?
Any platform including AWS, Azure, GCP, IBM Cloud, Oracle Cloud, and hybrid environments.
Is this suitable for consulting firms?
Absolutely. It includes Client Name, Industry, and Project Status fields for multi-client portfolio management.
🔗 Explore Related Templates
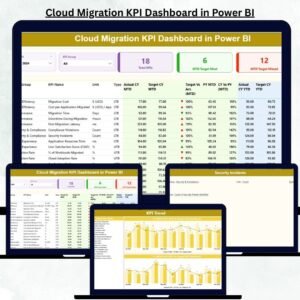
📊 Cloud Migration KPI Dashboard in Power BI — Track cloud migration KPIs with MTD/YTD analysis and trend charts.
📊 Cloud Migration KPI Dashboard in Google Sheets — Monitor cloud migration with collaborative Google Sheets.
📊 Digital Transformation Dashboard in Power BI — Track digital projects, budgets, and completion rates.
Browse all Excel Dashboard Templates on NextGenTemplates.
📖 Click here to read the Detailed Blog Post
🎥 Visit our YouTube channel to learn step-by-step video tutorials
👉 YouTube.com/@NextGenTemplates


Reviews
There are no reviews yet.