Key Features of Art Gallery KPI Scorecard
Unlock the full potential of your art gallery’s performance with our Art Gallery KPI Scorecard-a meticulously designed, ready-to-use digital template crafted to help you track, analyze, and optimize your key performance indicators (KPIs) with ease and precision. This powerful scorecard offers a seamless way to monitor your gallery’s monthly, quarter-to-date, and year-to-date results, enabling timely decision-making and strategic improvements.
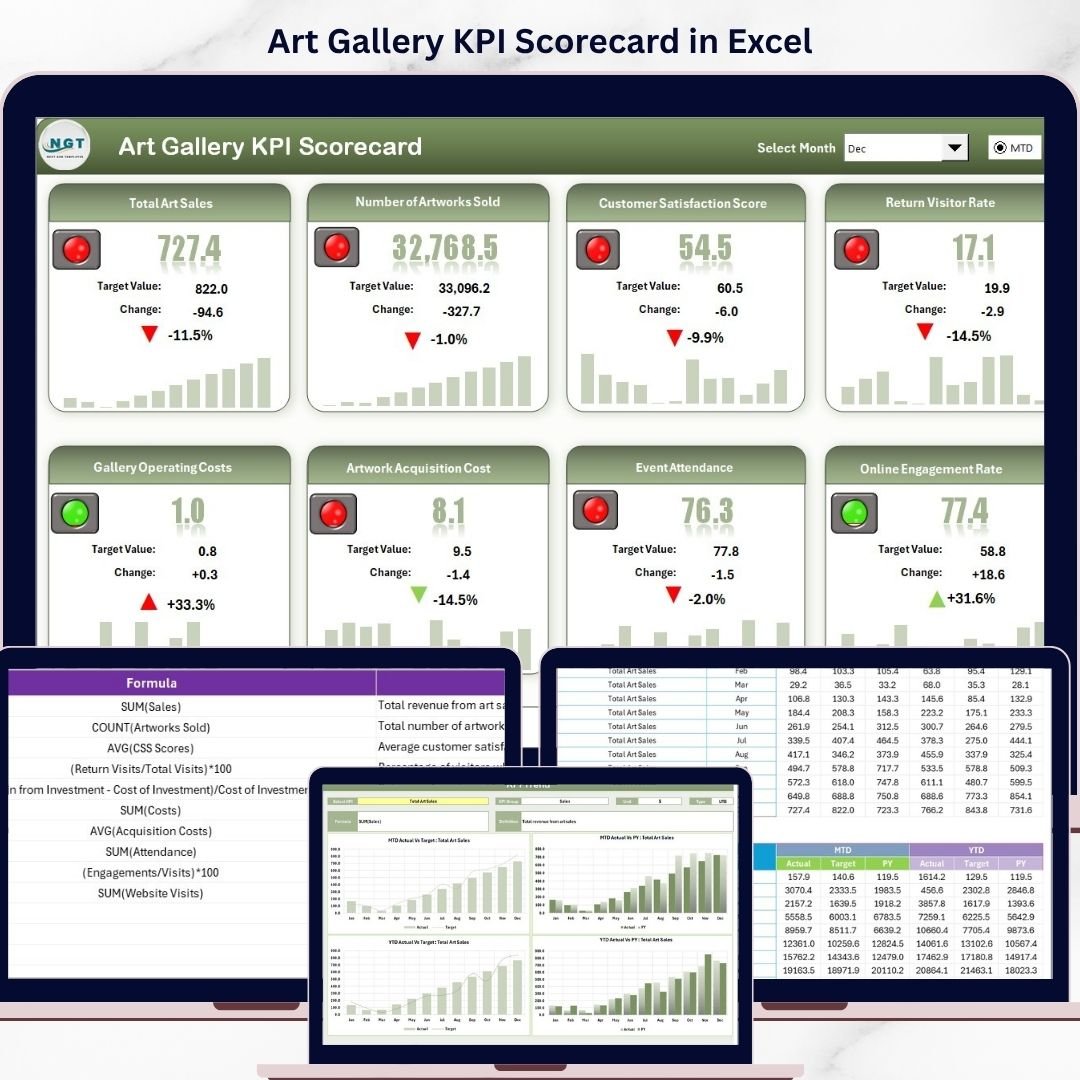
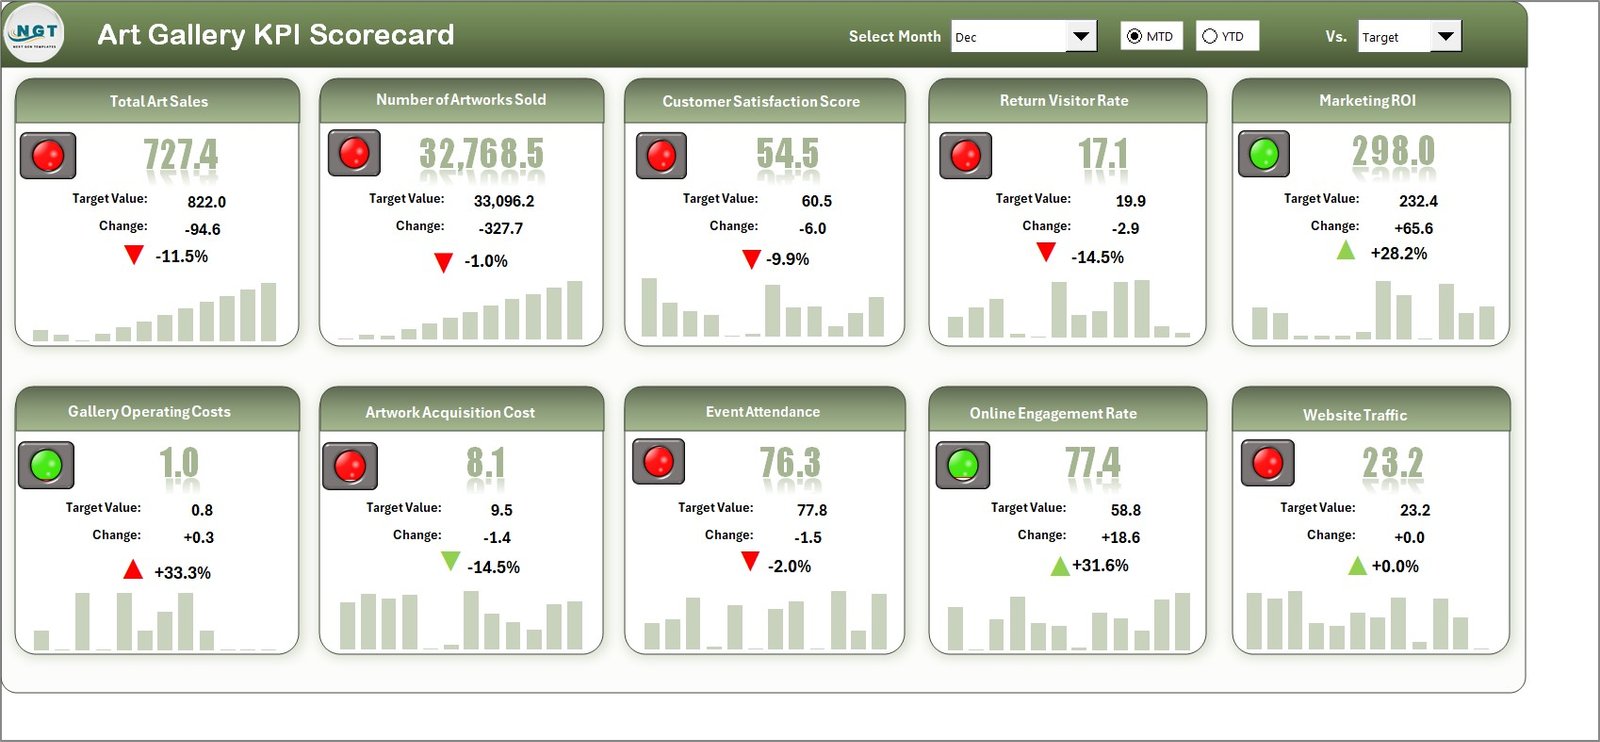
At the heart of this scorecard is the Scorecard Sheet, the main interface where you get a comprehensive snapshot of your KPIs. Featuring intuitive dropdown menus, you can effortlessly select the month, MTD (Month-to-Date), or YTD (Year-to-Date) views to measure your gallery’s success against set targets. The dynamic actual vs target comparison highlights gaps or achievements, while vibrant, color-coded visuals provide instant performance insights at a glance. This empowers you to identify trends, strengths, and areas needing attention fast.
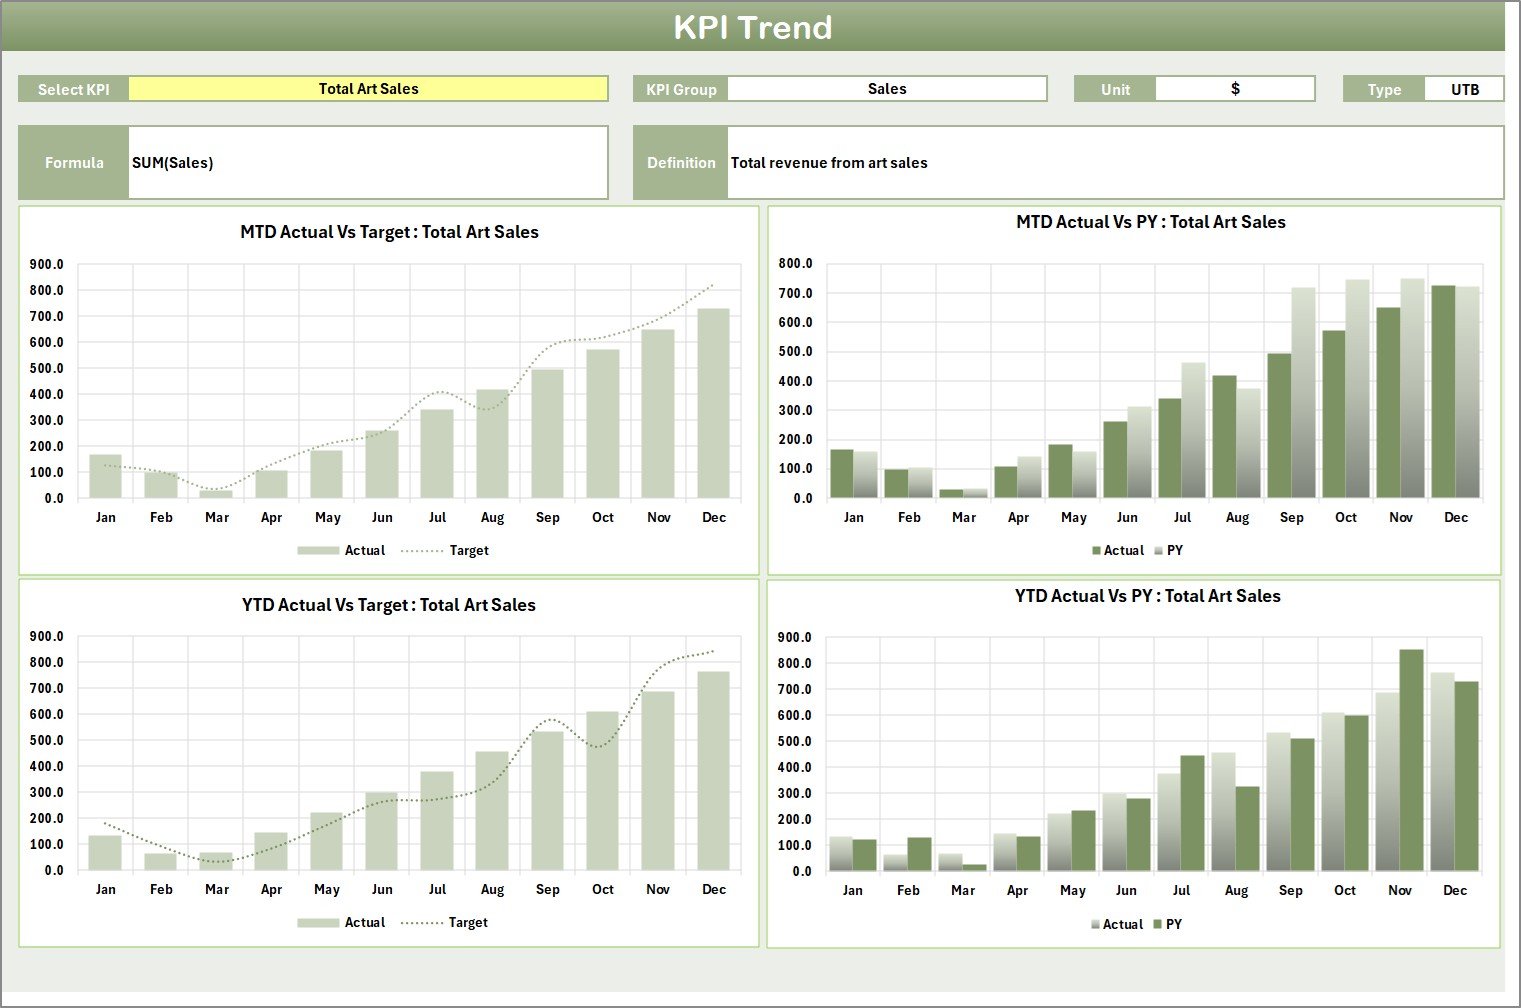
The KPI Trend Sheet allows deeper analysis by letting you select individual KPIs from a dropdown menu. Here, you can explore detailed attributes such as KPI Group, Unit of Measure, Type (whether lower or upper values are better), Formula, and a clear Definition. Along with these, interactive MTD and YTD trend charts display Actual, Target, and Previous Year (PY) data, helping you track progress visually and plan accordingly.
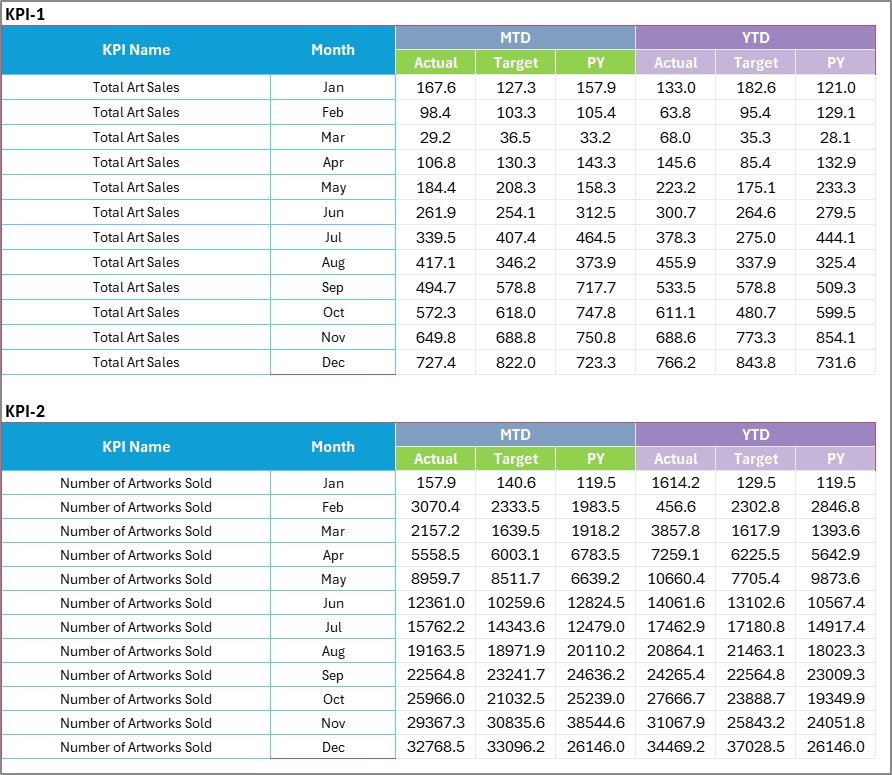
The Input Data Sheet serves as your data entry hub. It provides a user-friendly format to record actual values, targets, and other critical metrics for every KPI. Its flexible setup ensures you can update results regularly, keeping your scorecard current and actionable.
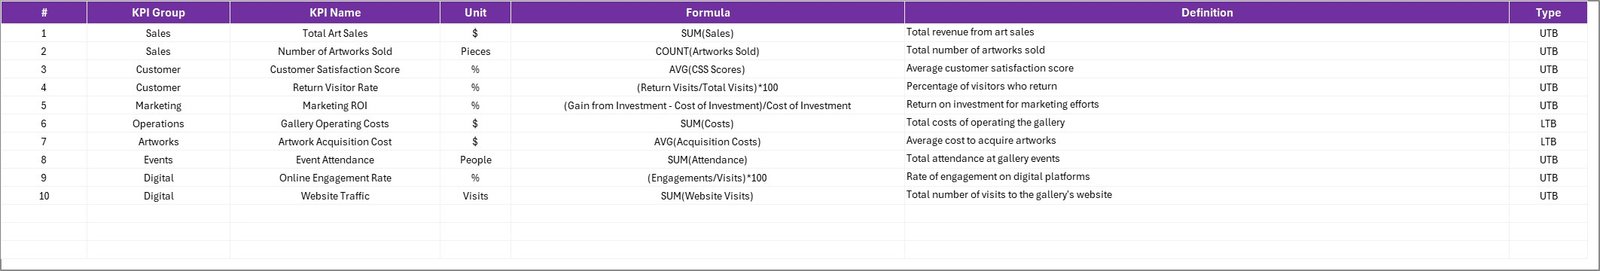
Lastly, the KPI Definition Sheet tab lets you maintain a well-documented KPI inventory by entering KPI Names, Groups, Units, Formulas, and Definitions. This clarity promotes shared understanding across teams and stakeholders.
What’s Inside the Art Gallery KPI Scorecard
- 🖼️ Four Essential Worksheets: Scorecard Sheet, KPI Trend Sheet, Input Data Sheet, and KPI Definition Sheet
- 📊 Interactive Dropdown Menus for easy navigation between months, MTD, and YTD views
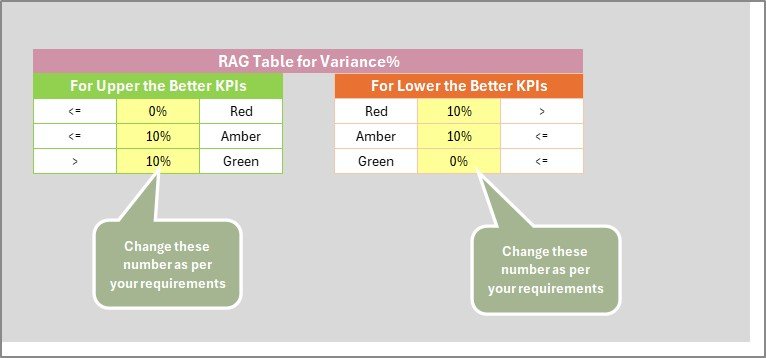
- 🎯 Actual vs Target performance comparisons with color-coded visual indicators
- 📈 Dynamic trend charts showing KPI progress over time, including previous year benchmarks
- 📝 Comprehensive KPI details, including formulas and definitions for clarity and accuracy
- 🗂️ Flexible data input sheet designed for quick updates and smooth data management
- 💼 Suitable for art galleries aiming to optimize operational and financial performance
How to Use the Art Gallery KPI Scorecard
Using this scorecard is straightforward and designed for maximum efficiency:
- 🔍 Start at the Scorecard Sheet to get a bird’s eye view of your gallery’s monthly and yearly performance.
- 📅 Use the dropdown menus to select the desired timeframe (month, MTD, or YTD) for your analysis.
- 📊 Dive into the KPI Trend Sheet to study individual KPIs in detail, review formulas, and observe trends via charts.
- ✍️ Regularly enter or update your KPI data in the Input Data Sheet to keep your dashboard current and relevant.
- 📚 Use the KPI Definition Sheet to add or edit KPIs, ensuring your team understands each metric’s meaning and calculation.
- 🚀 Leverage the visual indicators and comparisons to identify performance gaps and take informed action.
Who Can Benefit from This Art Gallery KPI Scorecard
- 🎨 Art Gallery Owners looking to track sales, visitor engagement, and operational efficiency.
- 📈 Gallery Managers who need a clear overview of monthly and yearly performance metrics.
- 💼 Marketing Teams aiming to measure campaign impact and visitor trends.
- 🧑💼 Financial Analysts focused on revenue, budget adherence, and cost management.
- 📊 Data Analysts seeking structured and visual KPI reporting tools.
- 🖥️ Consultants advising art institutions on performance improvement and strategic planning.
- 👥 Teams collaborating on gallery operations with a need for shared, real-time KPI tracking.


Reviews
There are no reviews yet.