Managing city gas distribution data across multiple locations can quickly become overwhelming. From billing and revenue to maintenance costs and safety monitoring, handling everything manually leads to errors, delays, and poor decision-making.
But what if you could track everything in one powerful dashboard?
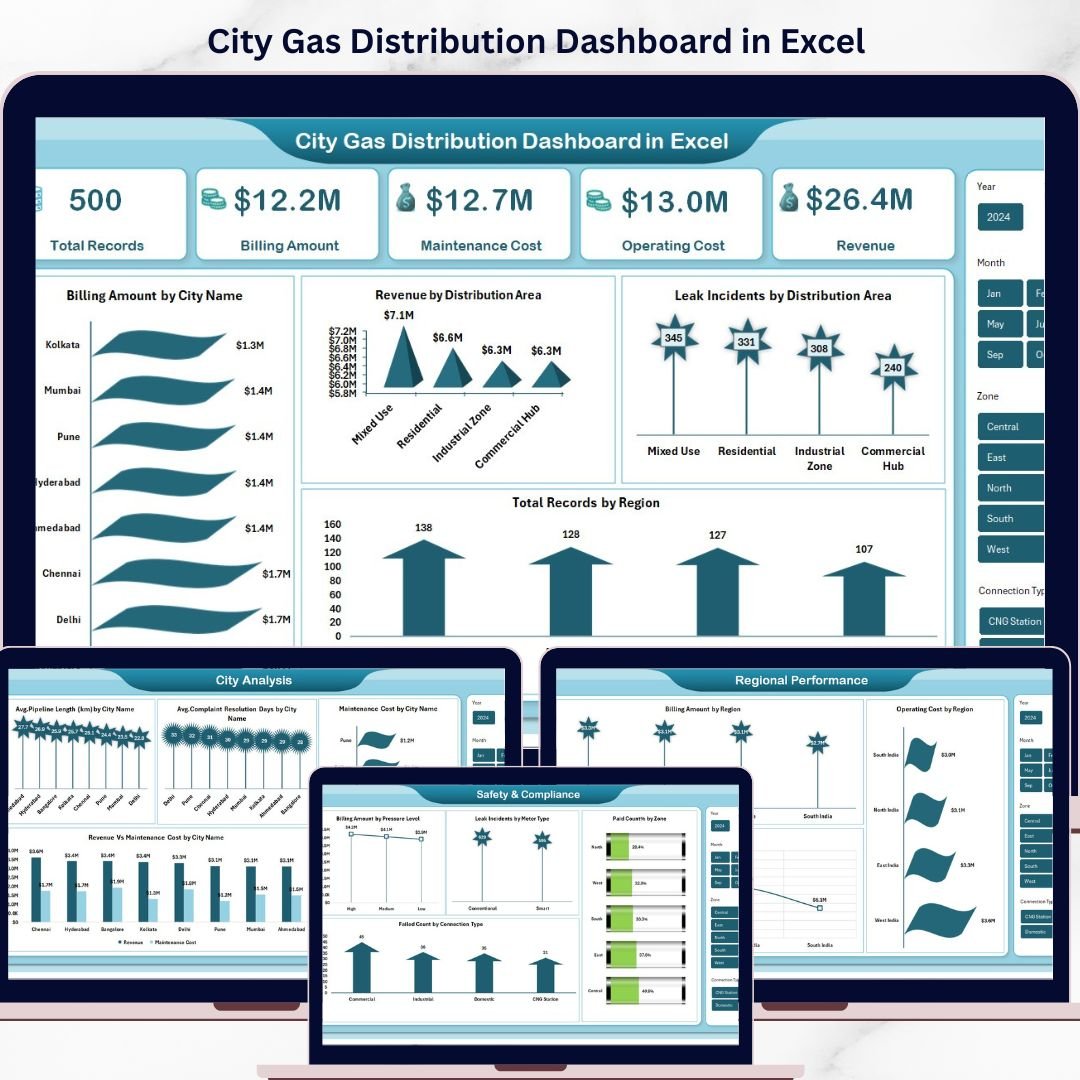
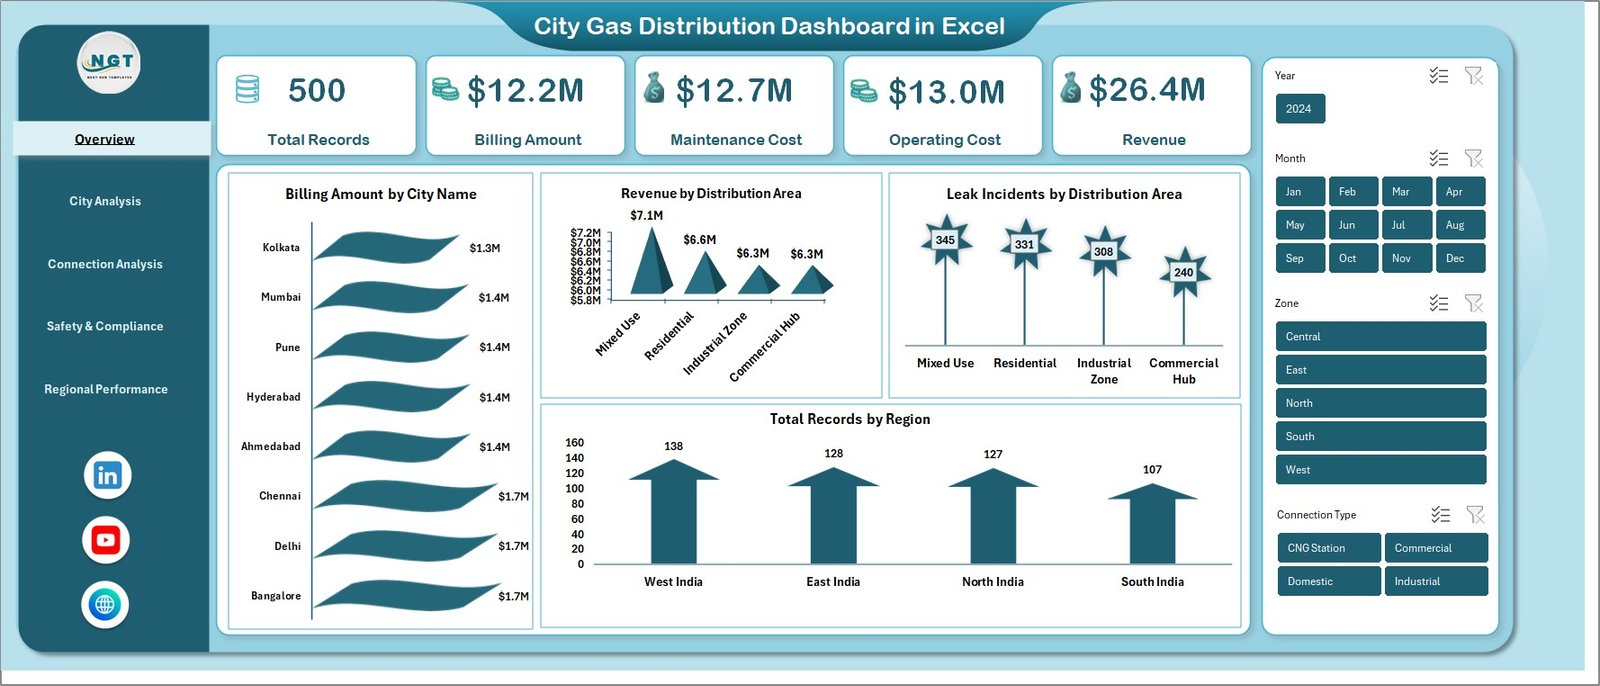
👉 Introducing the City Gas Distribution Dashboard in Excel — a ready-to-use, smart solution designed to simplify your operations and give you complete control over your gas distribution data.
This dashboard transforms complex datasets into clear, interactive visuals. As a result, you can monitor performance, identify trends, and make faster, data-driven decisions without any technical expertise.
🚀 Key Features of City Gas Distribution Dashboard in Excel
✨ All-in-One Overview Dashboard – Instantly view Total Records, Billing Amount, Maintenance Cost, Operating Cost, and Revenue in one place.
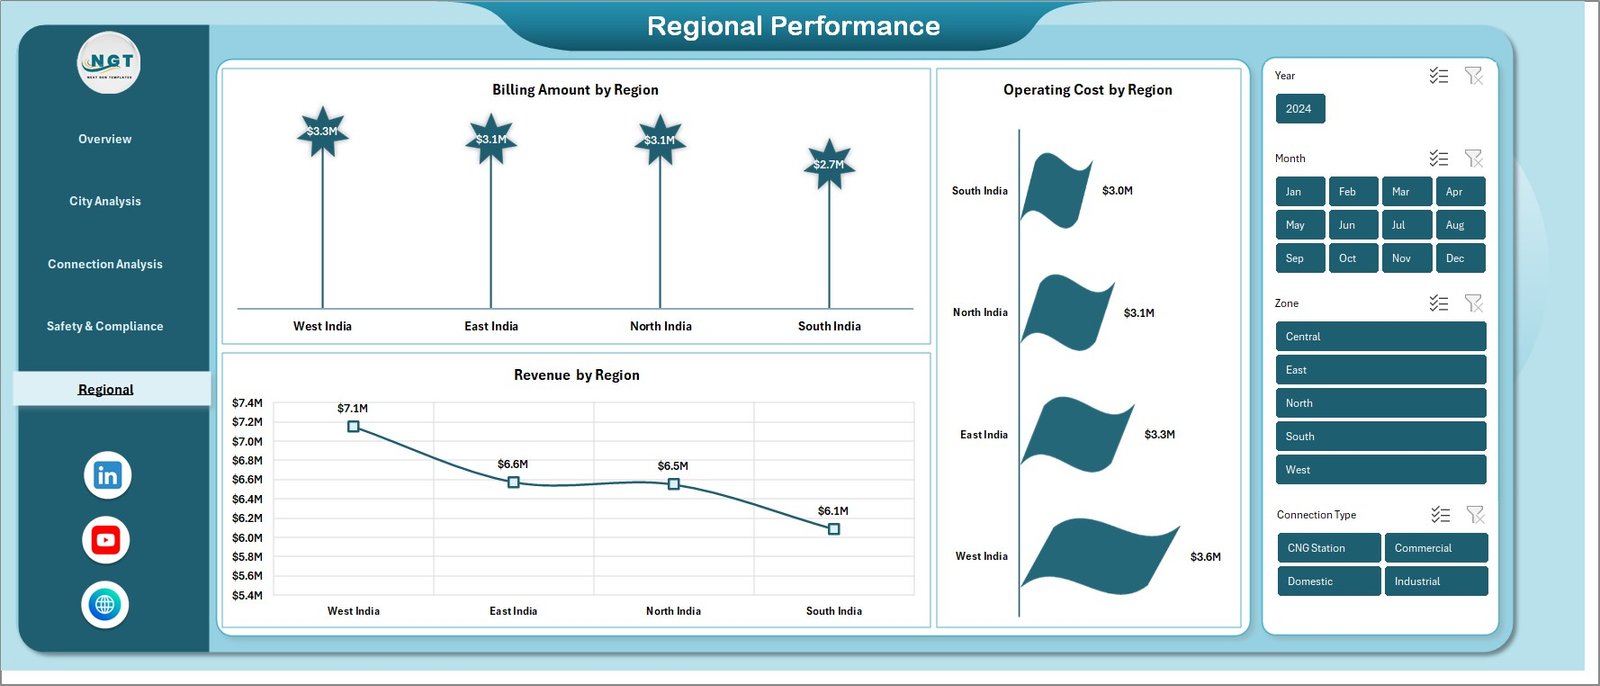
📊 Interactive Visual Reports – Analyze Billing by City, Revenue by Area, Leak Incidents, and Region-wise performance with dynamic charts.
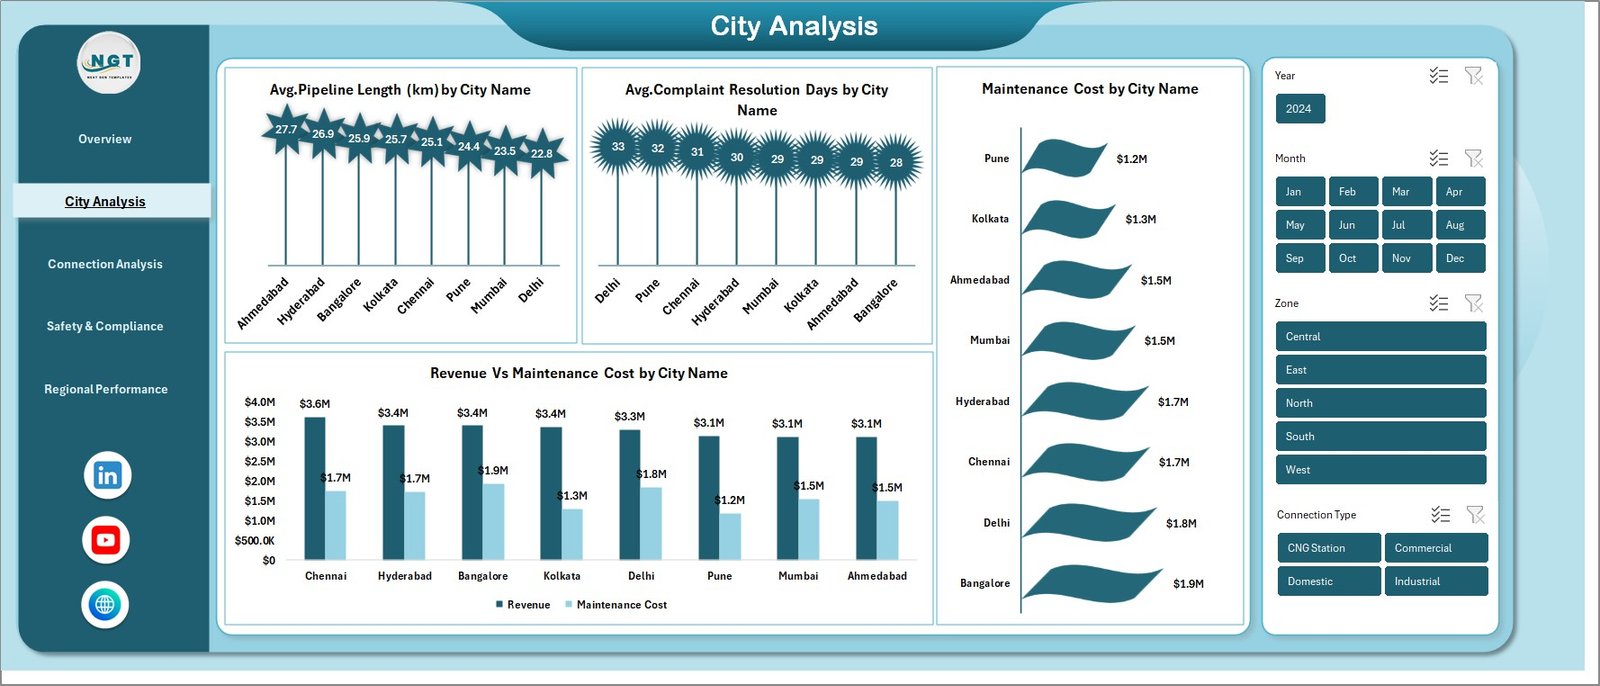
🏙️ City-Level Analysis – Compare pipeline length, complaint resolution time, and maintenance costs across cities.
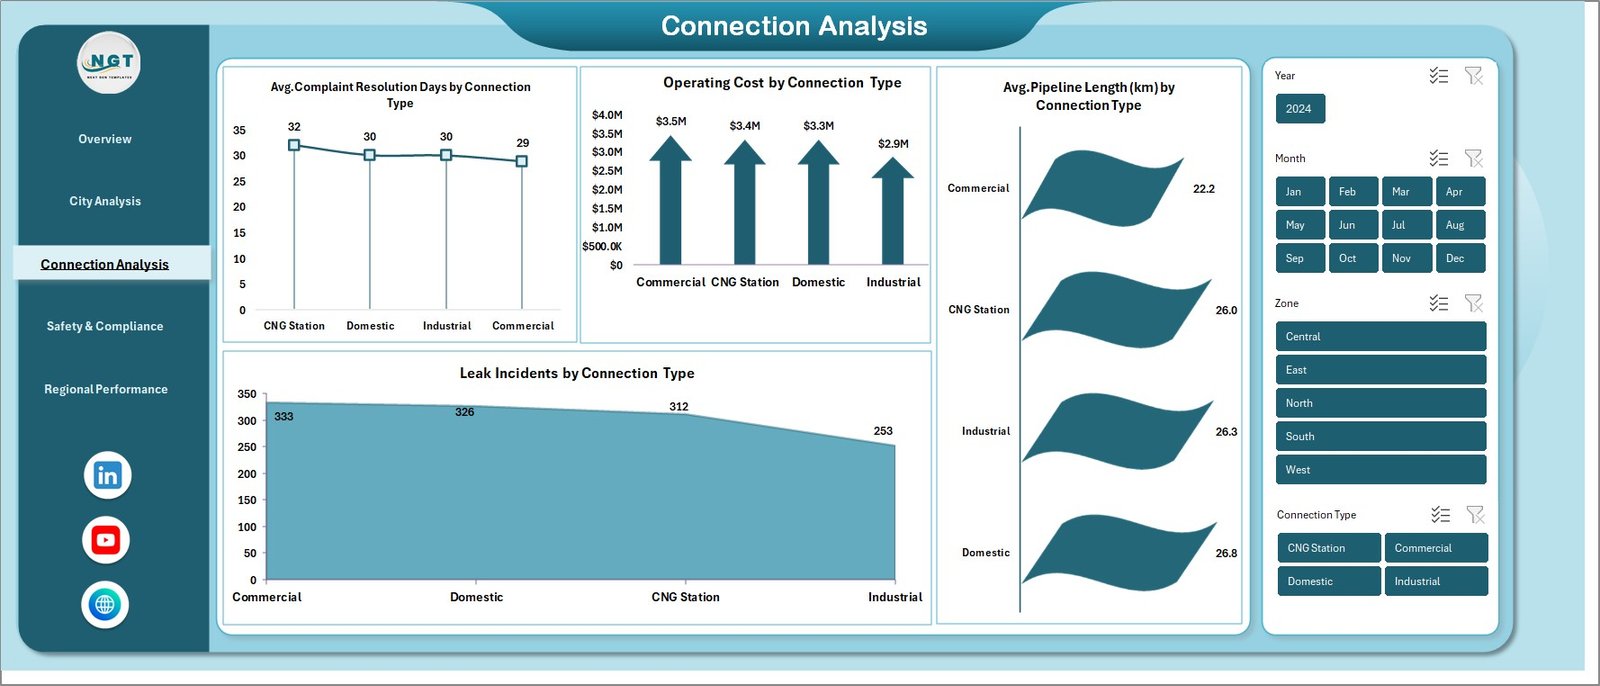
🔌 Connection-Based Insights – Understand performance by connection types such as residential, commercial, and industrial.
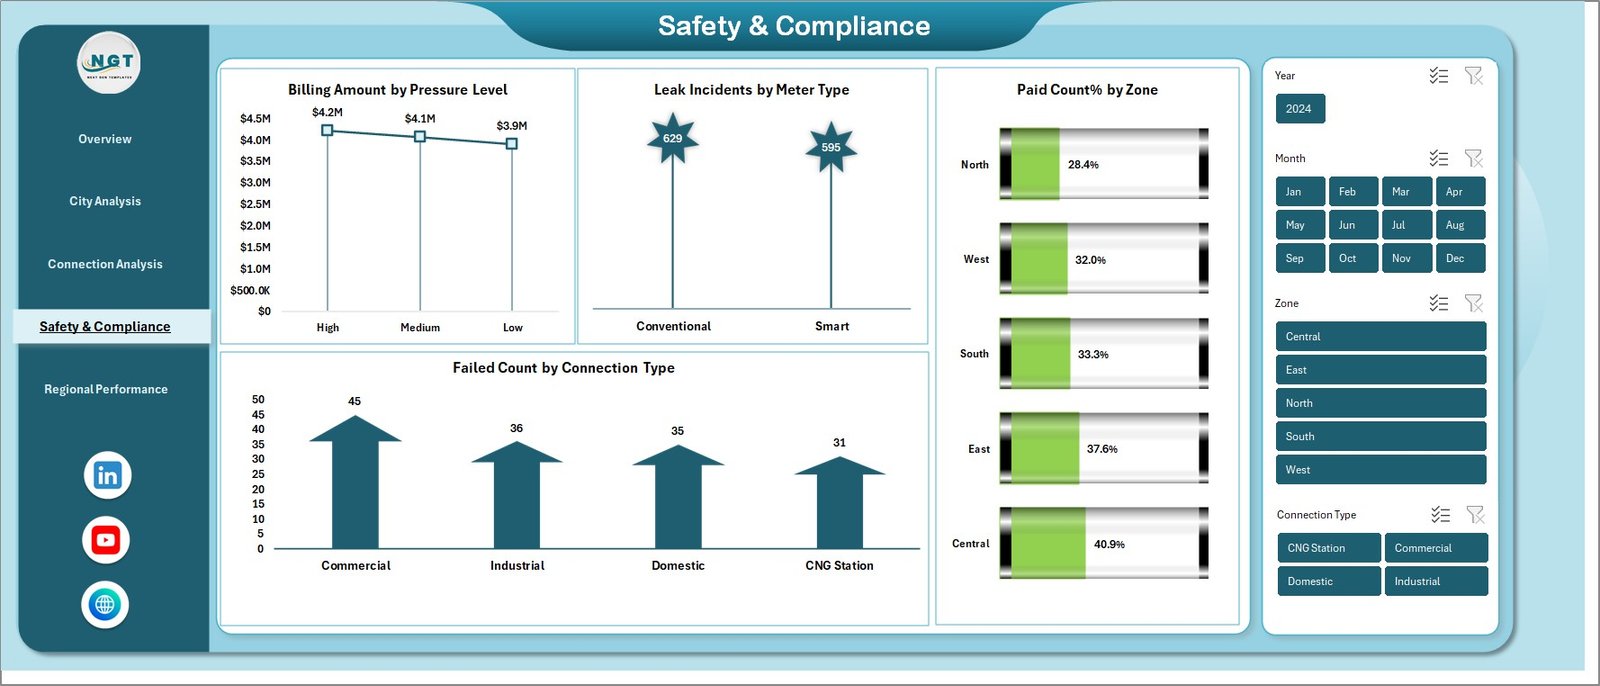
⚠️ Safety & Compliance Tracking – Monitor leak incidents, pressure levels, meter types, and compliance metrics.
📈 Monthly Trend Analysis – Track billing, costs, and revenue trends over time for better forecasting.
🎯 User-Friendly Interface – Designed for easy navigation with slicers and filters.
🔄 Fully Customizable – Add new KPIs, modify visuals, and adapt the dashboard as per your needs.
📂 What’s Inside the City Gas Distribution Dashboard in Excel
This dashboard comes with multiple pre-designed sheets, each built for specific analysis:
📊 Overview Sheet – Get a complete snapshot of operations with key KPIs and charts.
🏙️ City Analysis Sheet – Evaluate city-wise performance and identify improvement areas.
🔌 Connection Analysis Sheet – Analyze customer segments and operational efficiency.
⚠️ Safety & Compliance Sheet – Track risk indicators and ensure safety standards.
📈 Monthly Trends Sheet – Monitor performance over time and identify patterns.
Each sheet is fully interactive, allowing you to filter and explore data effortlessly.
⚙️ How to Use the City Gas Distribution Dashboard in Excel
Using this dashboard is simple and requires no advanced Excel skills:
📝 Step 1: Enter your data into the Excel input sheet
🔄 Step 2: Update records regularly
📊 Step 3: Refresh pivot tables and charts
🎛️ Step 4: Use slicers to filter data
📈 Step 5: Analyze insights instantly
Within minutes, you’ll have a complete overview of your gas distribution performance.
👥 Who Can Benefit from This City Gas Distribution Dashboard in Excel
This dashboard is perfect for professionals working in the gas distribution industry:
🏭 Gas Distribution Companies – Manage operations across multiple cities efficiently
👨💼 Operations Managers – Track performance and optimize processes
🛠️ Maintenance Teams – Monitor costs and service efficiency
⚠️ Safety Officers – Identify risks and improve compliance
📊 Financial Analysts – Analyze revenue, costs, and profitability
🏛️ Government Authorities – Monitor regional performance and compliance
No matter your role, this dashboard helps you stay informed and make smarter decisions.
💡 With this dashboard, you can centralize your data, reduce manual effort, improve safety monitoring, and boost operational efficiency — all in one place.
If you want to transform your gas distribution management and gain complete visibility over your operations, this dashboard is your ultimate solution.