Are you struggling to manage your baby products retail data efficiently? 😓
Tired of juggling multiple spreadsheets and still missing key insights?
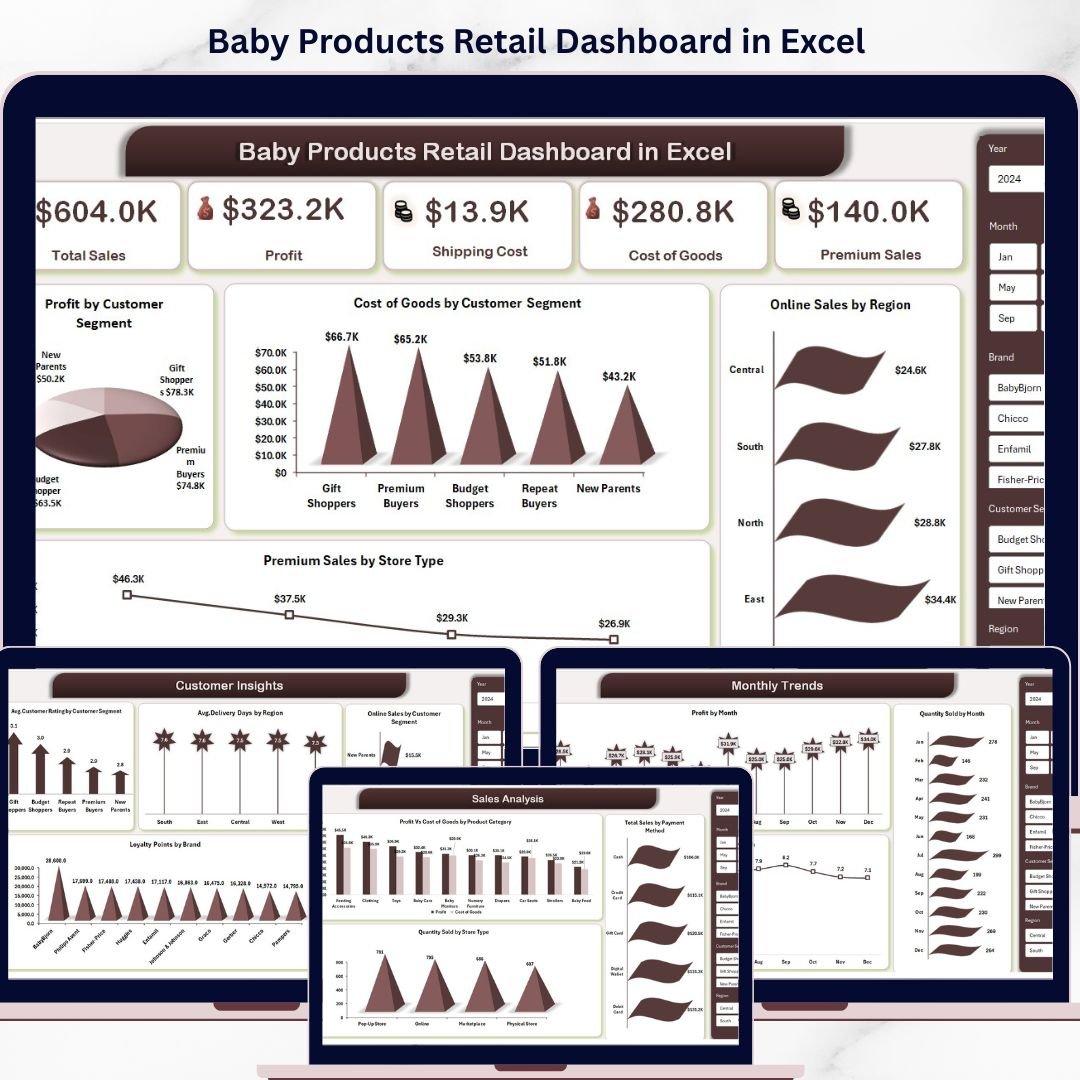
👉 The solution is here — Baby Products Retail Dashboard in Excel!
This powerful, ready-to-use Excel dashboard is designed to transform your raw retail data into clear, actionable insights. Whether you run a baby store, eCommerce business, or wholesale operation, this dashboard helps you track performance, analyze trends, and make smarter decisions—all in one place.
Say goodbye to manual reporting and hello to real-time business intelligence 🚀
✨ Key Features of Baby Products Retail Dashboard in Excel
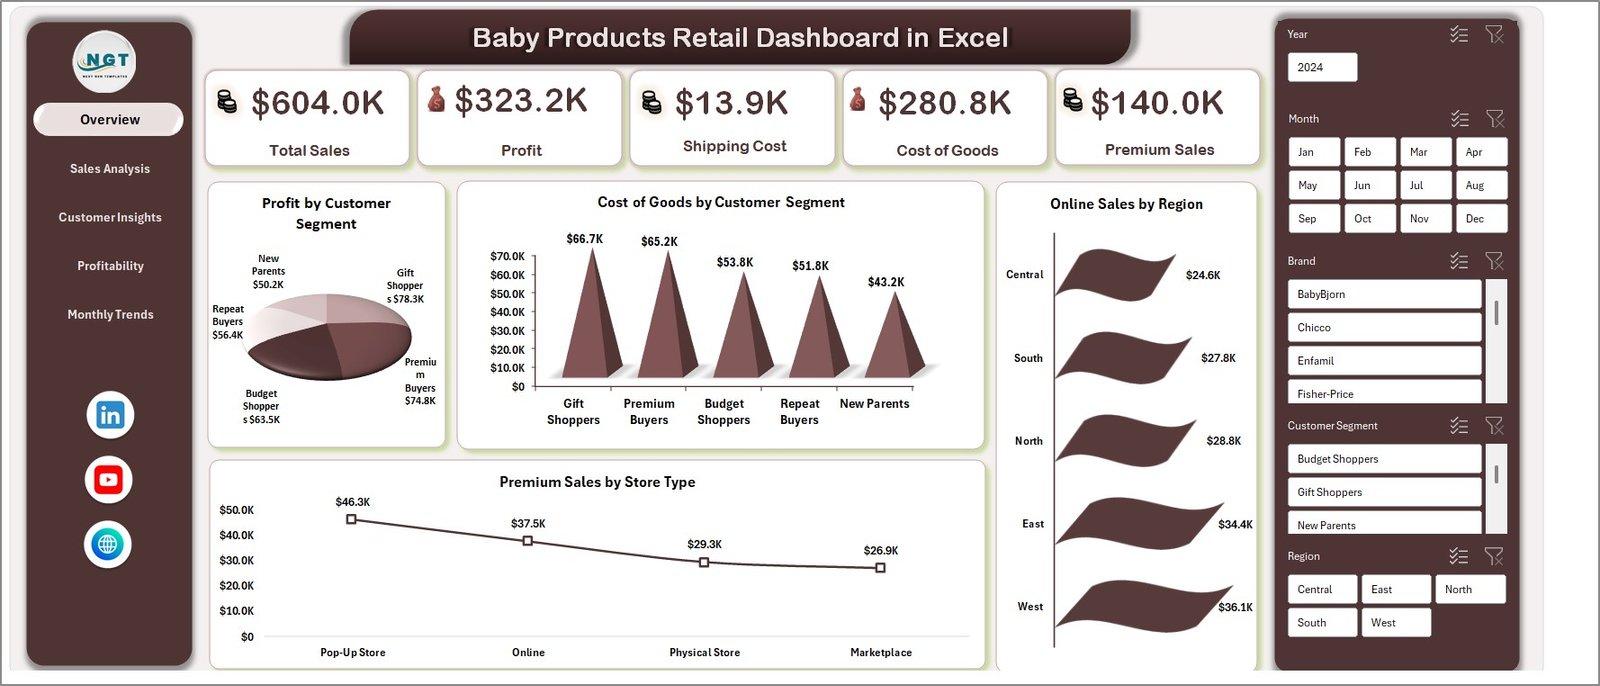
📊 All-in-One Business Overview
Get instant visibility into Total Sales, Profit, Shipping Cost, Cost of Goods, and Premium Sales from a single screen.
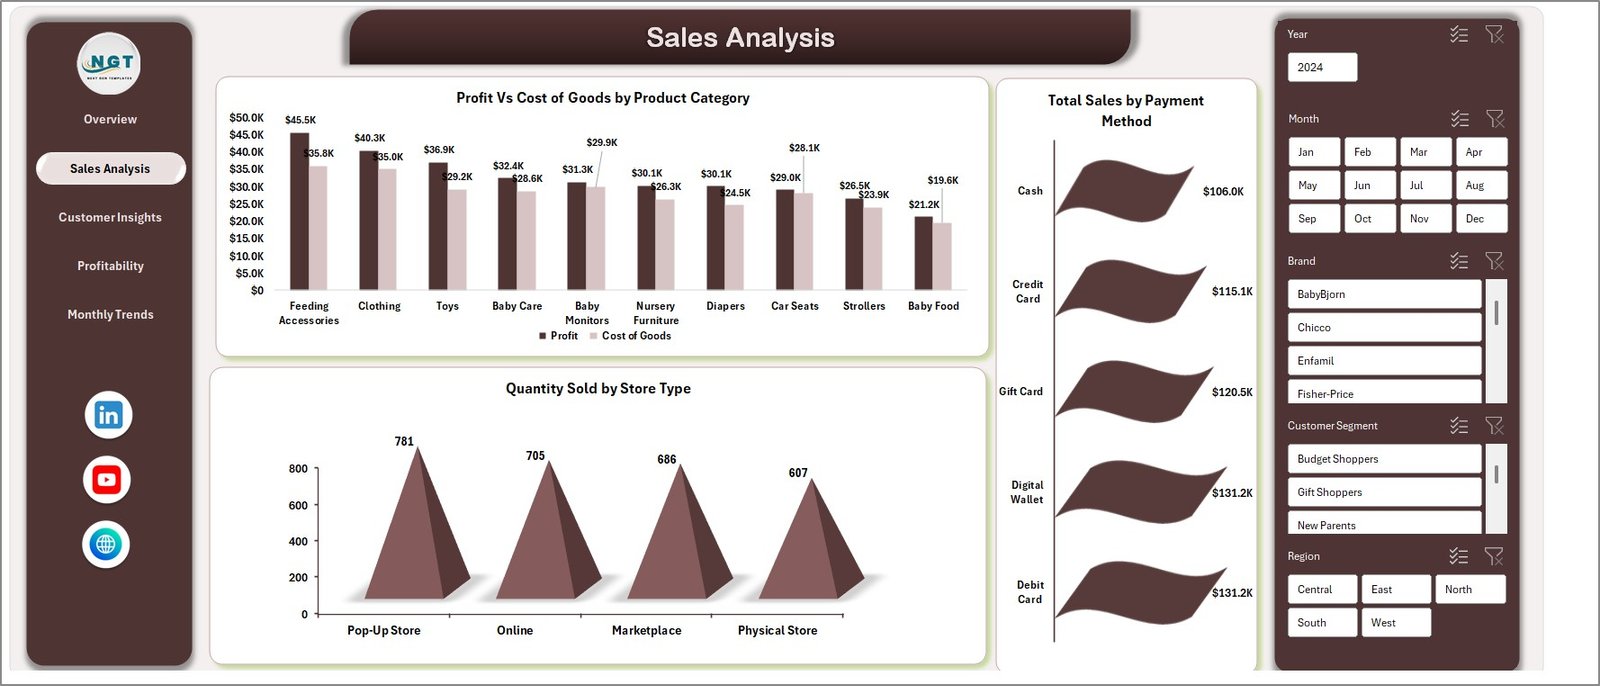
📈 Interactive Sales Analysis
Analyze Profit vs Cost, Sales by Payment Method, and Quantity Sold by Store Type to identify what’s driving your revenue.
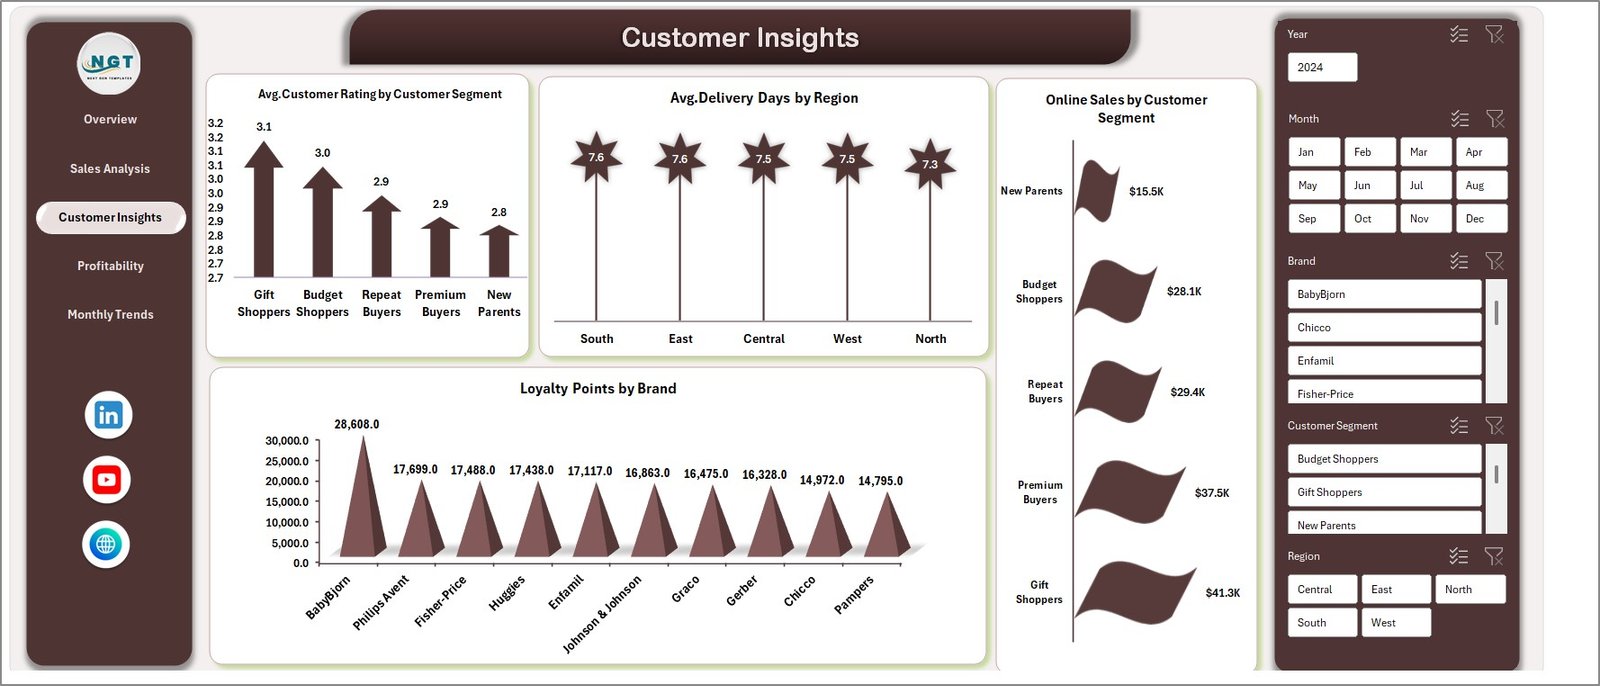
👶 Customer Behavior Insights
Understand your customers better with metrics like Avg. Ratings, Delivery Days, Loyalty Points, and Online Sales trends.
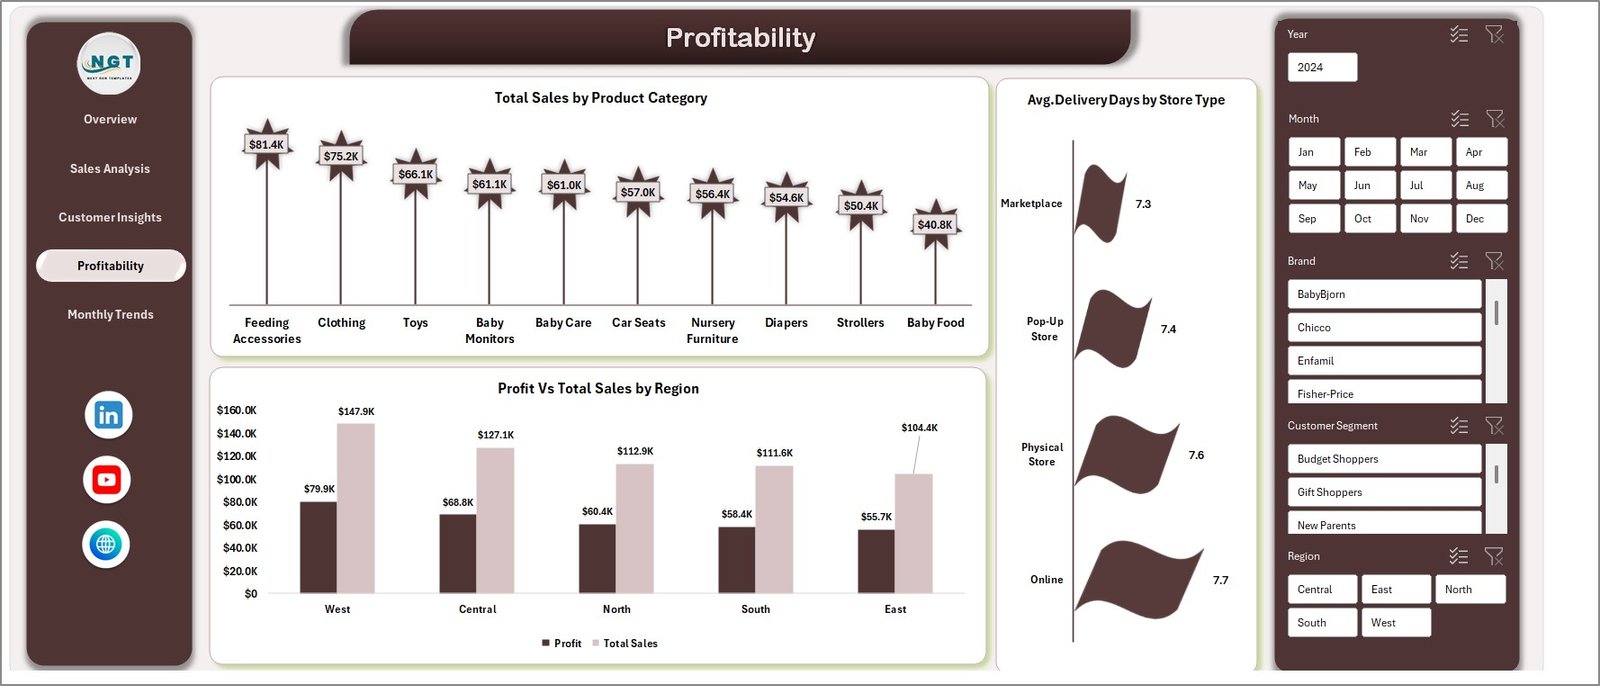
💰 Profitability Tracking
Identify high-performing regions and product categories to maximize your profit margins.
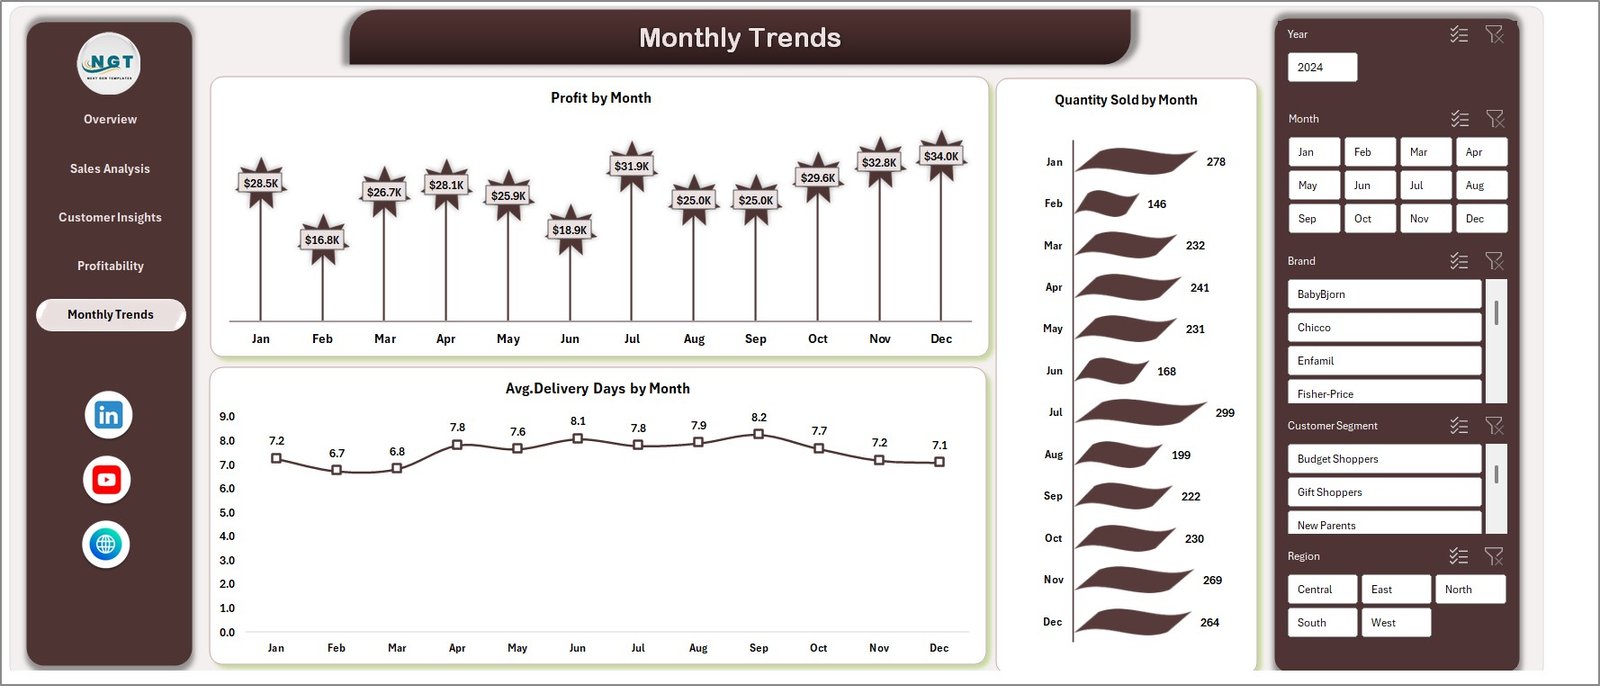
📅 Monthly Trend Analysis
Track Profit, Quantity Sold, and Delivery performance over time to spot seasonal trends and forecast demand.
⚡ Dynamic & Interactive Dashboard
Use slicers and filters to instantly drill down into specific regions, categories, or time periods.
🎯 Decision-Making Made Easy
Turn complex data into simple visuals that help you make faster and smarter business decisions.
📂 What’s Inside the Baby Products Retail Dashboard in Excel
📌 Overview Sheet
A powerful snapshot of your business performance with KPIs and visual charts.
📌 Sales Analysis Sheet
Deep dive into sales metrics, product performance, and payment trends.
📌 Customer Insights Sheet
Analyze customer satisfaction, loyalty behavior, and delivery efficiency.
📌 Profitability Sheet
Evaluate financial performance across regions, categories, and store types.
📌 Monthly Trends Sheet
Monitor performance trends over time and plan future strategies effectively.
🛠️ How to Use the Baby Products Retail Dashboard in Excel
Getting started is super easy—even if you’re not an Excel expert! 💡
1️⃣ Enter Your Data
Add your sales, product, and customer data into the input sheets.
2️⃣ Refresh the Dashboard
Update pivot tables with a single click.
3️⃣ Apply Filters & Slicers
Analyze data by region, product category, or time period.
4️⃣ Review Insights
Explore charts and KPIs to understand business performance.
5️⃣ Take Action
Use insights to improve sales strategies, optimize operations, and boost profitability.
👥 Who Can Benefit from This Baby Products Retail Dashboard in Excel
🛍️ Baby Product Retailers – Track store performance effortlessly
🏬 Store Owners – Monitor daily sales and profitability
🌐 eCommerce Businesses – Analyze online sales trends and customer behavior
📊 Data Analysts – Generate insights quickly without manual reporting
🚚 Supply Chain Managers – Improve delivery performance and efficiency
💡 Why This Dashboard is a Game-Changer?
✔ Centralized data management
✔ Faster reporting and analysis
✔ Improved decision-making
✔ Better customer understanding
✔ Increased profitability
👉 If you want to scale your baby products business with data-driven decisions, this dashboard is your ultimate tool!
Click here to read the Detailed blog post
Watch the step-by-step video tutorial: