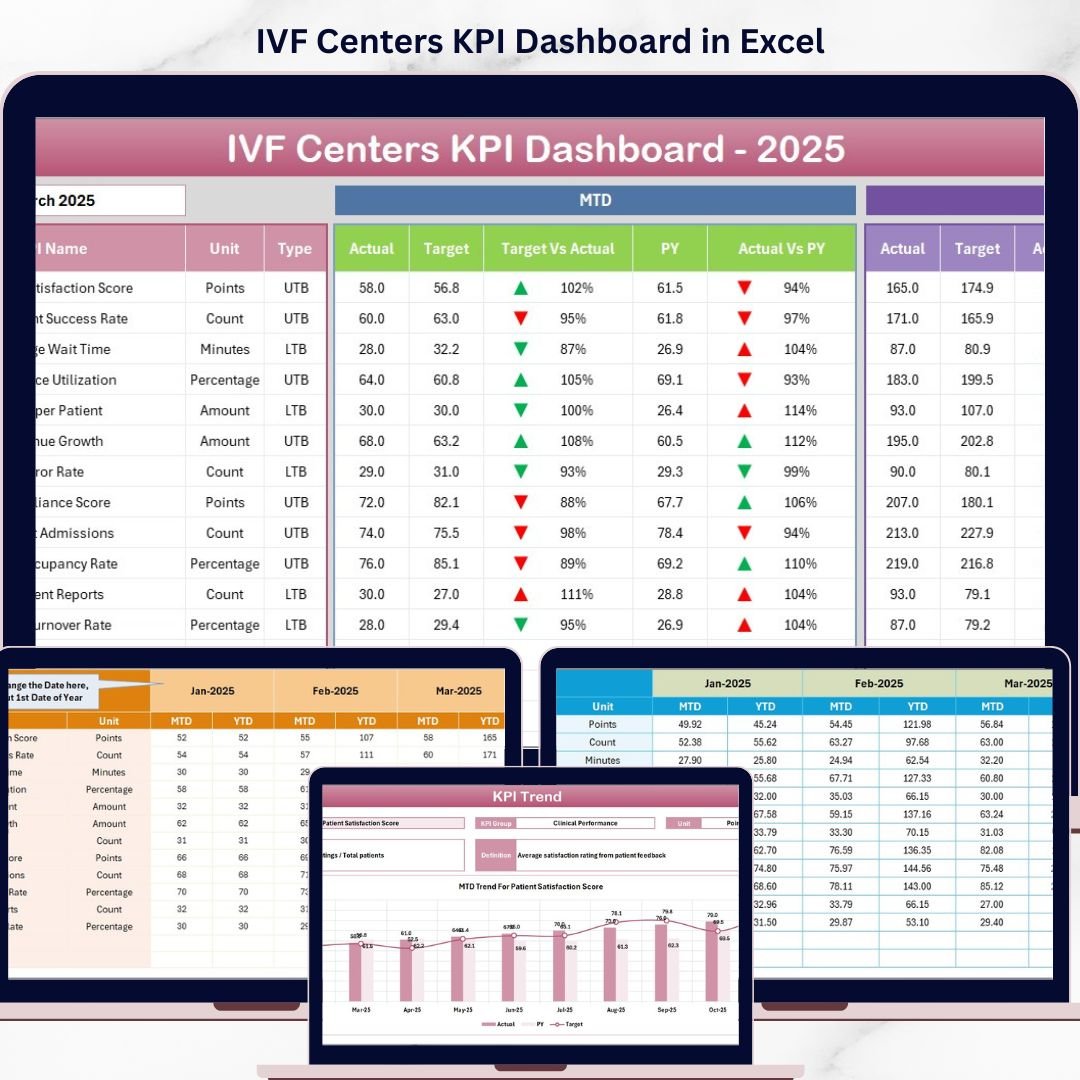
Key Features of IVF Centers KPI Dashboard
The IVF Centers KPI Dashboard is a comprehensive digital solution designed to help fertility clinics and IVF centers track, analyze, and improve their key performance indicators (KPIs) with ease and accuracy. This dashboard includes 7 meticulously crafted worksheets that cover every aspect of KPI monitoring, from data input to trend analysis. It offers dynamic monthly selection, conditional formatting with intuitive up/down arrows, and detailed KPI definitions to empower data-driven decisions.
Each worksheet is tailored to specific tasks: The Home Sheet provides an interactive index with quick navigation buttons to jump seamlessly across sheets. The Dashboard Sheet acts as the command center, showcasing month-to-date (MTD) and year-to-date (YTD) actuals, targets, and previous year data with comparative visuals. The KPI Trend Sheet allows selection of individual KPIs, presenting clear trend charts and comprehensive KPI metadata, including formulas and performance types.
Additional sheets facilitate easy data input: Actual Numbers Input, Target Number Input, and Previous Year Number Input, ensuring all relevant data is updated systematically. The KPI Definition Sheet offers a structured space to define KPIs, their units, formulas, and whether performance is better when higher or lower, ensuring clarity throughout the dashboard.
What’s Inside the IVF Centers KPI Dashboard
🗂️ Home Sheet: Central navigation hub with 6 interactive buttons for easy access to other sheets.
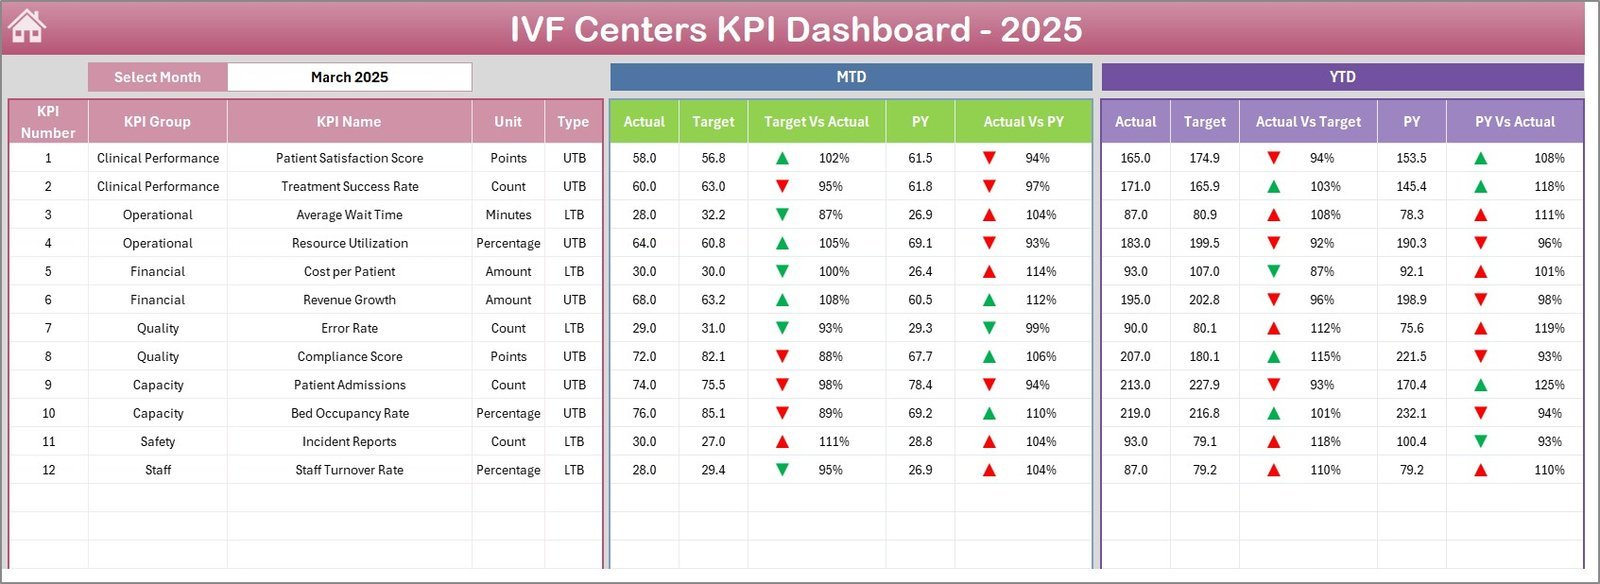
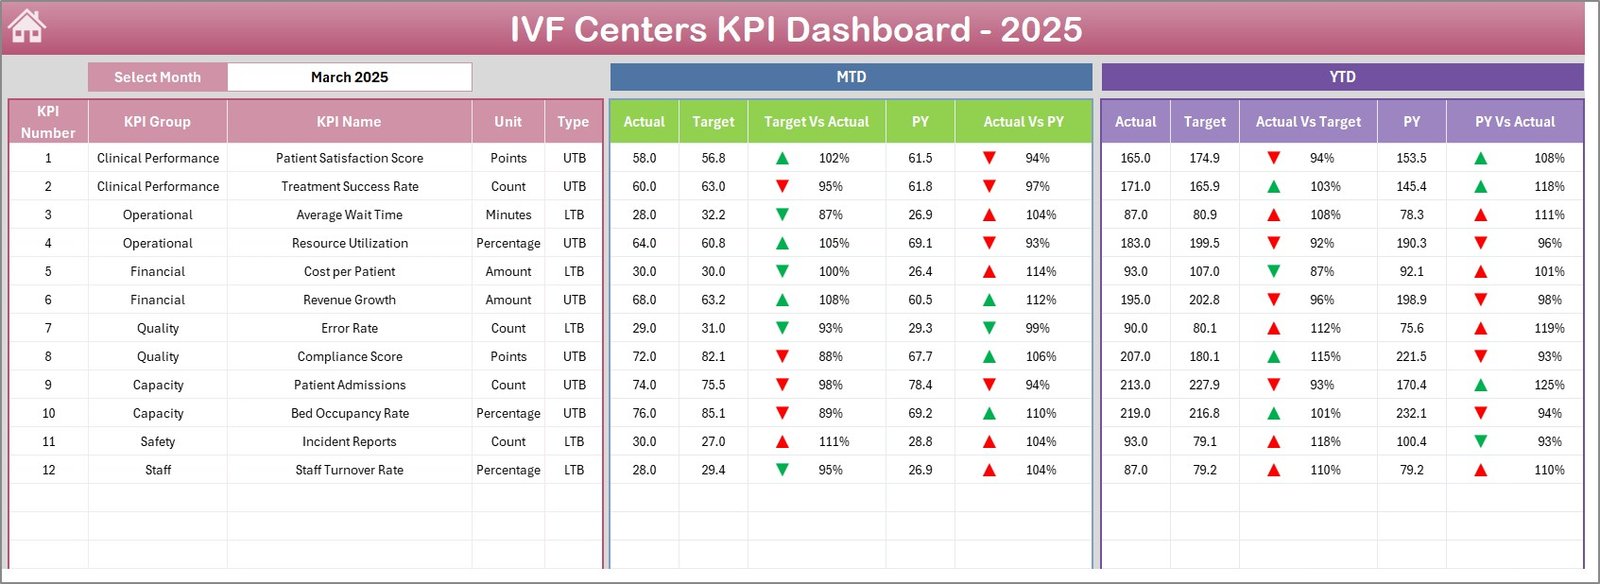
📊 Dashboard Sheet: Core analytics view with selectable month, showing MTD and YTD Actuals, Targets, and Previous Year comparisons with conditional formatting.
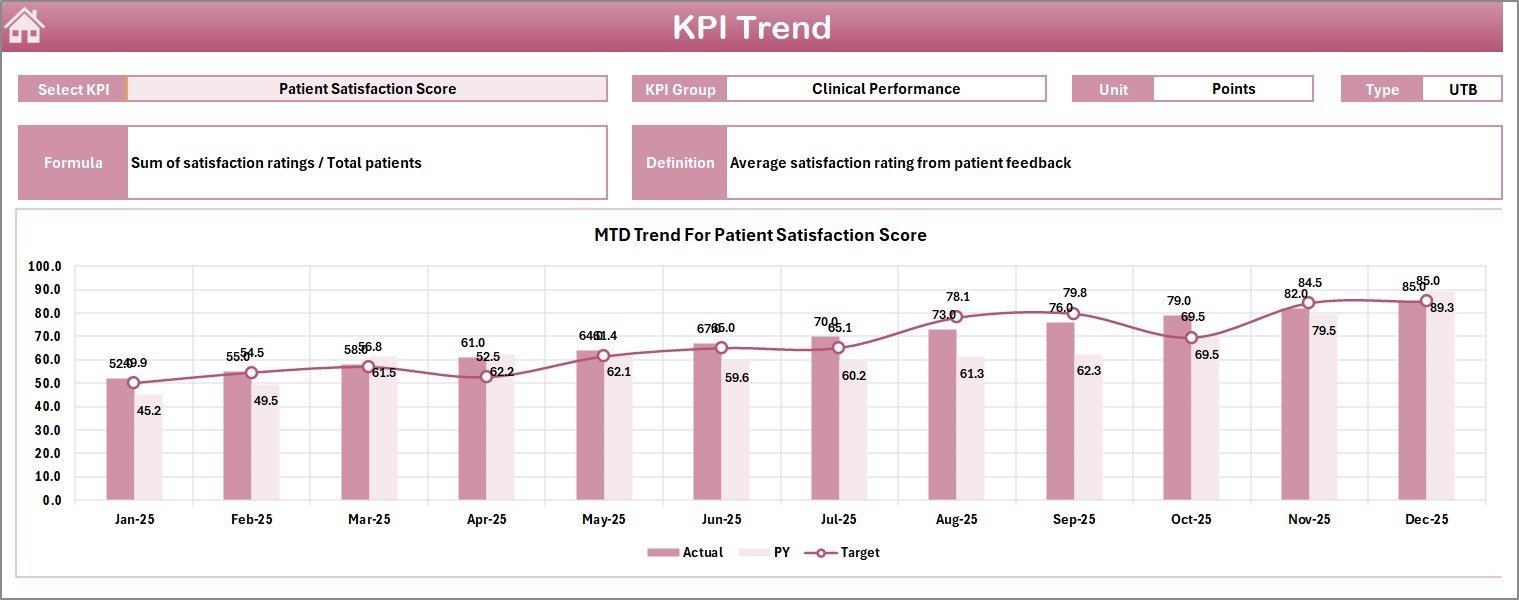
📈 KPI Trend Sheet: Select any KPI to visualize MTD and YTD trends with detailed KPI attributes like group, unit, formula, and performance type.
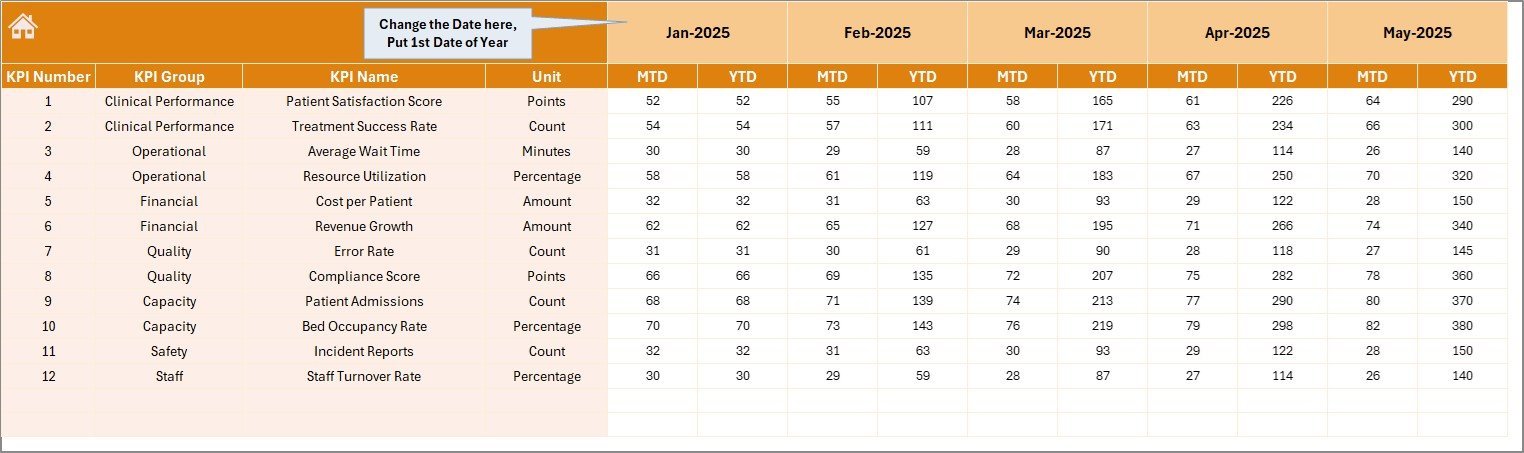
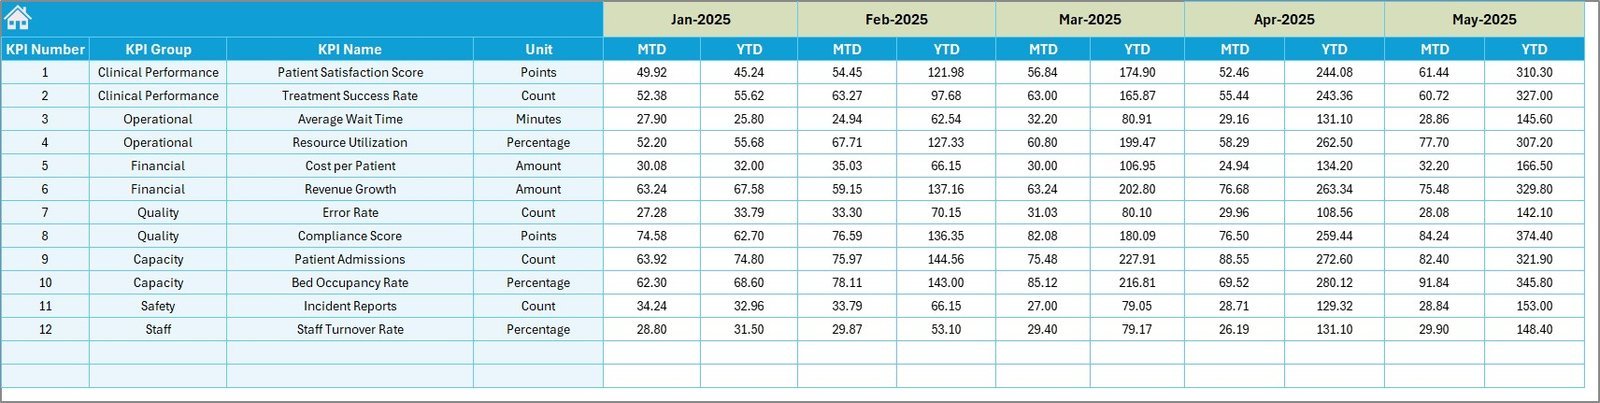
✍️ Actual Numbers Input Sheet: Enter monthly actual data with flexible month selection.
🎯 Target Number Input Sheet: Input monthly target KPIs for precise goal tracking.
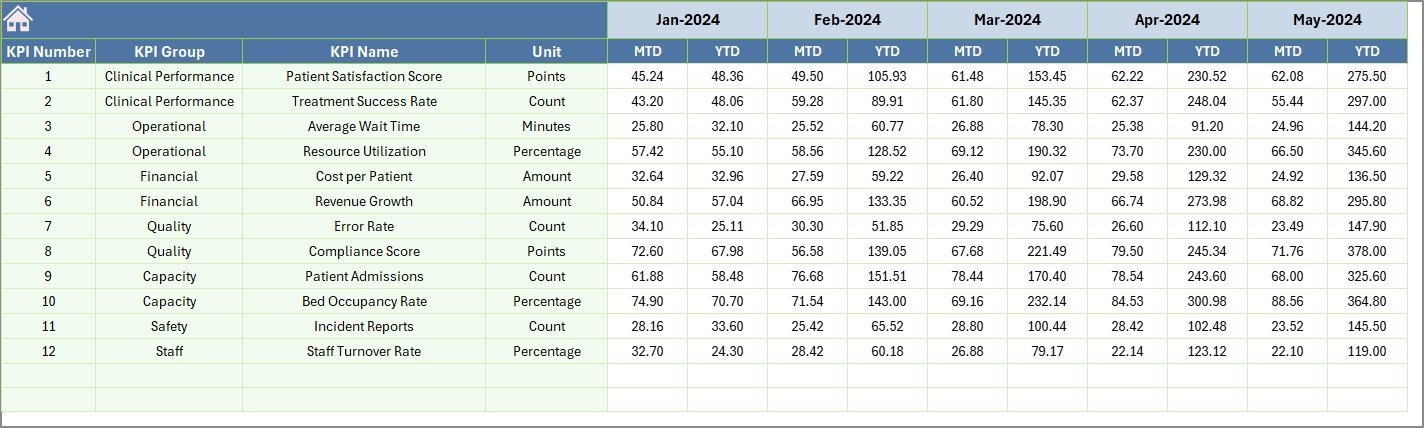
📅 Previous Year Number Sheet: Record last year’s KPI data for comparative analysis.
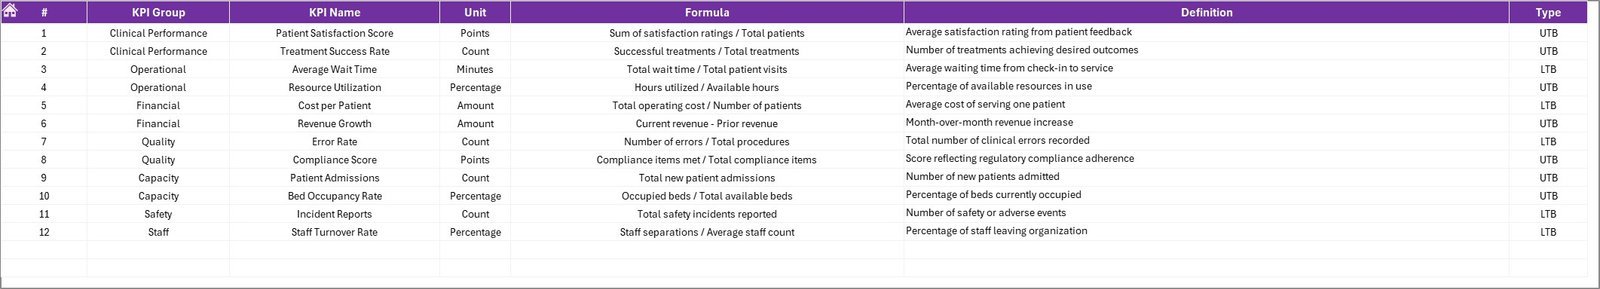
📚 KPI Definition Sheet: Define KPI names, groups, units, formulas, and performance types (Lower The Better or Upper The Better).
How to Use the IVF Centers KPI Dashboard
🖱️ Navigate easily via the Home Sheet to jump between different data views and input sheets.
📅 Use the drop-down menu on the Dashboard Sheet (cell D3) to select the month you want to analyze; all figures will automatically update to reflect that period.
📝 Input your actual monthly numbers in the Actual Numbers Input Sheet, adjusting the starting month as needed.
🎯 Enter your monthly target KPIs in the Target Number Input Sheet to set clear goals.
🔄 Fill in the previous year’s data in the Previous Year Number Sheet to enable meaningful year-over-year comparisons.
📊 Visit the KPI Trend Sheet to select specific KPIs and review their performance trends with visual charts and detailed KPI info.
📖 Update the KPI Definition Sheet whenever new KPIs are added or to clarify existing KPI metrics and performance expectations.
⚙️ Leverage the conditional formatting and comparison arrows on the Dashboard Sheet to quickly identify KPIs performing above or below expectations.
Who Can Benefit from This IVF Centers KPI Dashboard
👩⚕️ Clinic Managers & Administrators: Gain full visibility into clinic performance, allowing data-driven strategic decisions.
📈 Fertility Specialists & Doctors: Monitor treatment success rates and operational efficiency effortlessly.
📊 Data Analysts & Reporting Teams: Streamline KPI tracking with automated comparisons and trend visualizations.
🏥 IVF Center Owners: Evaluate overall business health and optimize resource allocation.
📅 Quality Control Teams: Track and improve key quality metrics to enhance patient outcomes.
💡 Consultants & Advisors: Provide actionable insights backed by clear, visual KPI data.
Click here to read the Detailed blog post.
Visit our YouTube channel to learn step-by-step video tutorials


Reviews
There are no reviews yet.