Are you struggling to manage auction data spread across multiple spreadsheets? Want to track bids, revenue, and buyer behavior in one powerful view?
👉 The solution is here – Auction Houses Dashboard in Excel!
This ready-to-use Excel dashboard is designed to help auction houses streamline operations, monitor key performance indicators, and make data-driven decisions faster than ever. Whether you manage art auctions, antiques, or online bidding platforms, this tool transforms complex data into clear, actionable insights.
With interactive visuals, automated calculations, and dynamic charts, you can instantly understand your auction performance without wasting time on manual reports.
🔑 Key Features of Auction Houses Dashboard in Excel
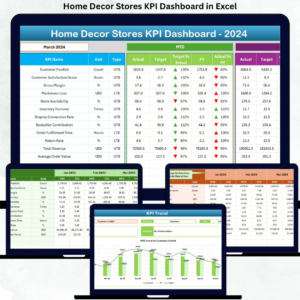
✨ 📊 Interactive Overview Dashboard – Get a complete snapshot of key metrics like Estimate Low, Estimate High, Starting Bid, Winning Bid, and Revenue in one place.
✨ 🏷️ Category Performance Analysis – Identify top-performing categories with insights like total lots, commission rates, and starting bids.
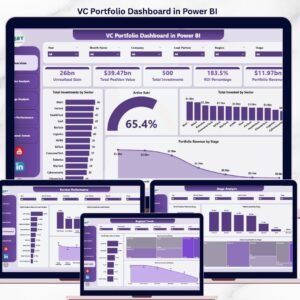
✨ 🏢 Auction House Comparison – Compare multiple auction houses based on bids, estimates, and revenue to identify top performers.
✨ 👥 Buyer Insights Analysis – Understand buyer behavior with detailed metrics like bidder count, buyer types, and revenue contribution.
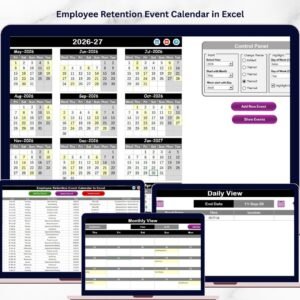
✨ 📅 Monthly Trend Tracking – Analyze trends over time to identify peak seasons and optimize auction planning.
✨ ⚡ Automated Updates – Simply enter your data, and the dashboard updates instantly with refreshed KPIs and charts.
✨ 🎯 Data-Driven Decision Making – Turn raw data into meaningful insights that help increase profitability.

📂 What’s Inside the Auction Houses Dashboard in Excel
📁 Overview Sheet – Your main control panel with KPIs and summary charts.
📁 Category Analysis Sheet – Analyze category-wise performance including estimates, lots, and commissions.
📁 Auction Performance Sheet – Evaluate auction house performance with detailed comparisons.
📁 Buyer Analysis Sheet – Gain deep insights into buyer types, bidding patterns, and revenue sources.
📁 Monthly Trends Sheet – Track performance over time and identify seasonal patterns.
📁 Fully Automated Charts & KPIs – All visuals update automatically based on your input data.
🛠️ How to Use the Auction Houses Dashboard in Excel
👉 Step 1: Enter your auction data into the Excel data sheets
👉 Step 2: Ensure your data is clean and properly formatted
👉 Step 3: Watch the dashboard update automatically
👉 Step 4: Use charts, filters, and visuals to analyze performance
👉 Step 5: Make smarter business decisions based on insights
💡 No advanced Excel skills required—this dashboard is designed for ease of use!
👥 Who Can Benefit from This Auction Houses Dashboard in Excel
✔️ Auction House Owners – Track overall performance and increase revenue
✔️ Auction Managers – Monitor bids, lots, and auction results efficiently
✔️ Data Analysts – Analyze trends and generate insights quickly
✔️ Finance Teams – Track revenue, commissions, and financial performance
✔️ Art & Antique Dealers – Understand buyer behavior and category demand
This dashboard is more than just a reporting tool—it’s your complete auction analytics solution. It helps you identify profitable categories, track buyer trends, and optimize auction strategies with confidence.
If you want to save time, reduce manual work, and boost your auction performance, this dashboard is a must-have.
Click here to read the Detailed blog post
Watch the step-by-step video tutorial: