Key Features of Market Research KPI Scorecard
Introducing the Market Research KPI Scorecard, your ultimate ready-to-use digital template designed to help you effortlessly track, analyze, and optimize your market research performance. This comprehensive scorecard empowers you to monitor critical KPIs with precision, enabling data-driven decisions that can elevate your marketing strategies and business outcomes.
With four meticulously designed worksheets, this template covers every aspect of KPI management, making it an indispensable tool for market researchers, analysts, and business professionals alike.
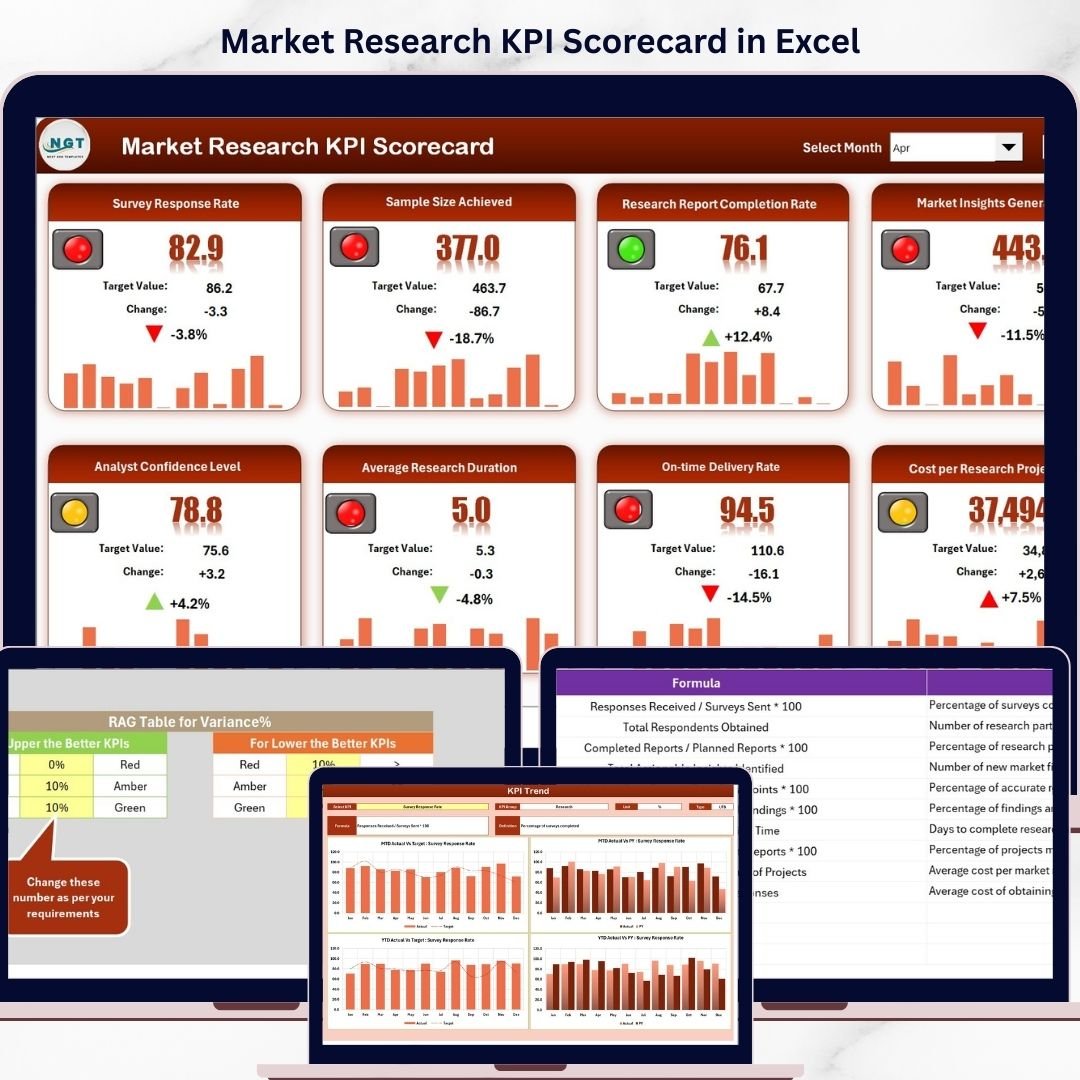
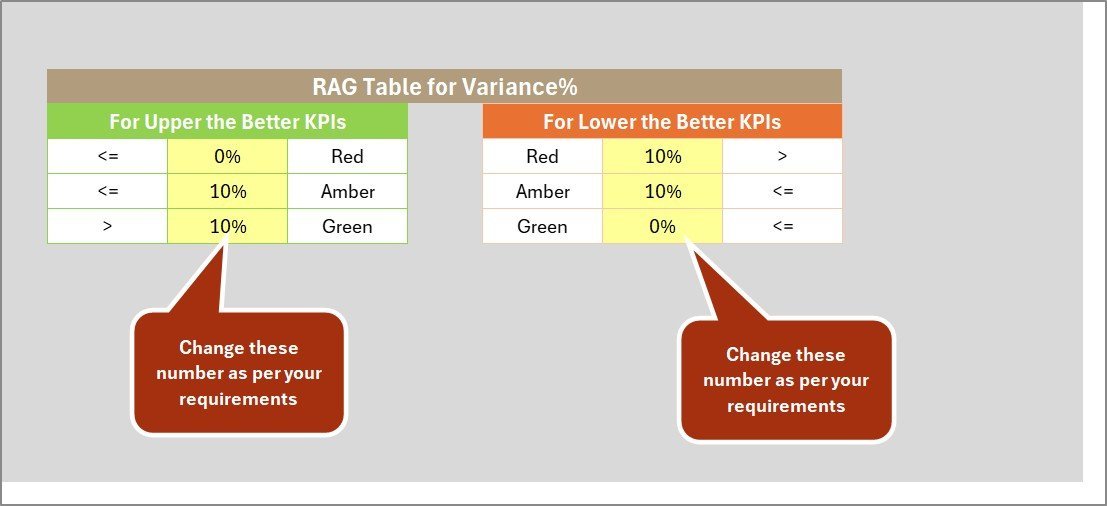
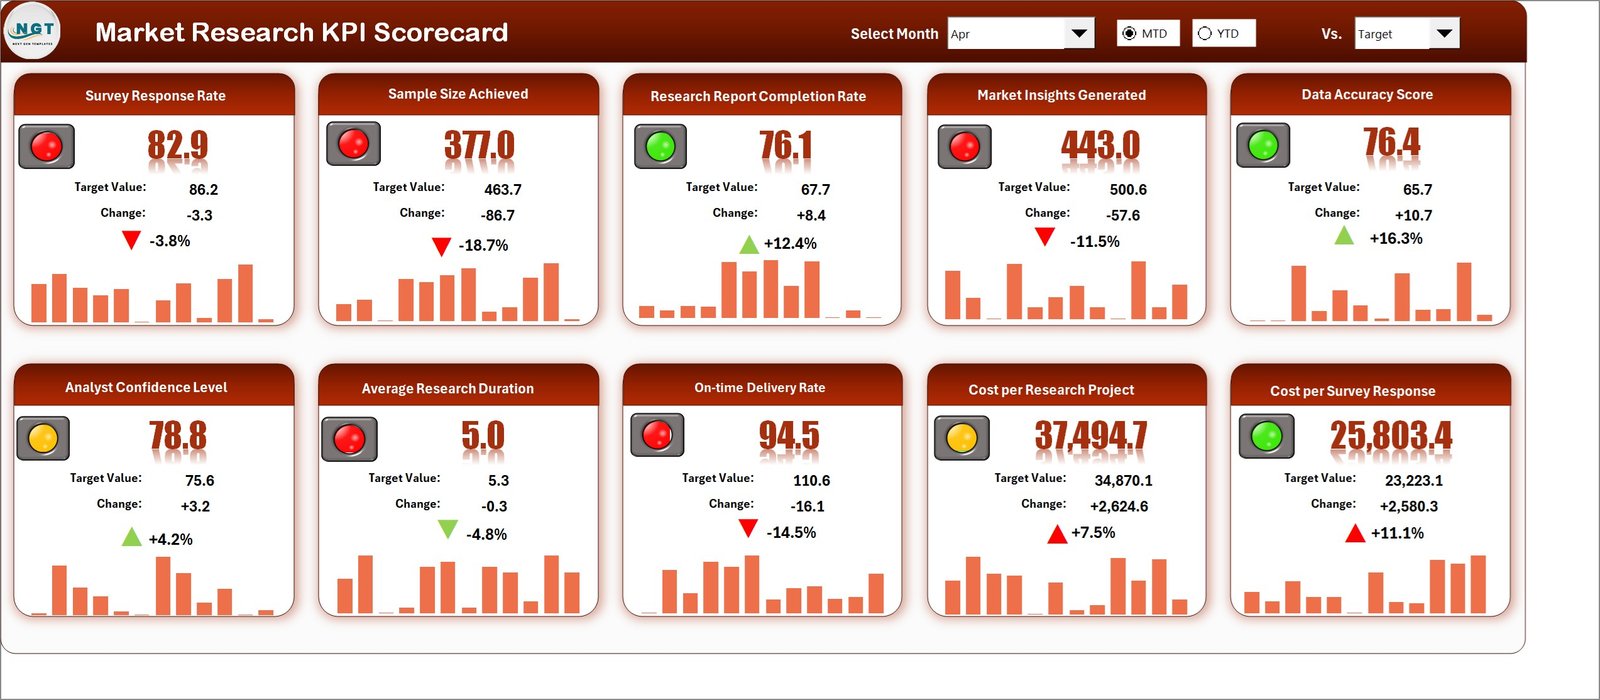
- 📊 Scorecard Sheet: The main dashboard lets you select the month, Month-to-Date (MTD), or Year-to-Date (YTD) performance through intuitive dropdown menus. It displays actual values versus targets, enhanced with color-coded visual indicators for instant performance insights.
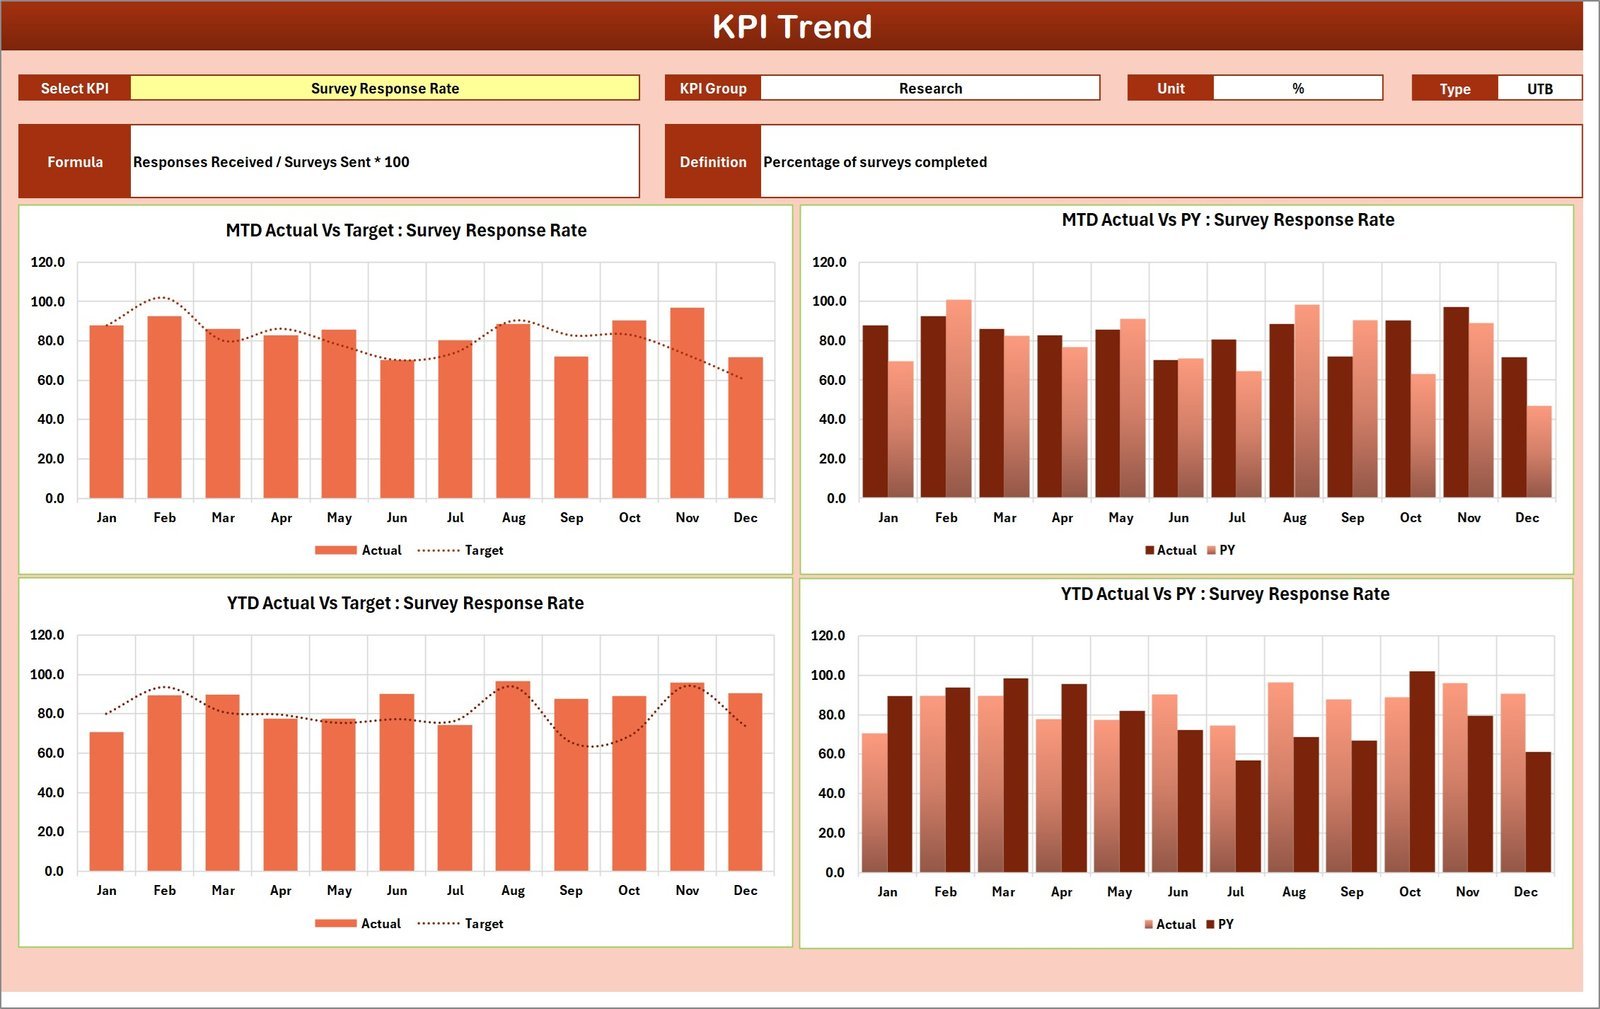
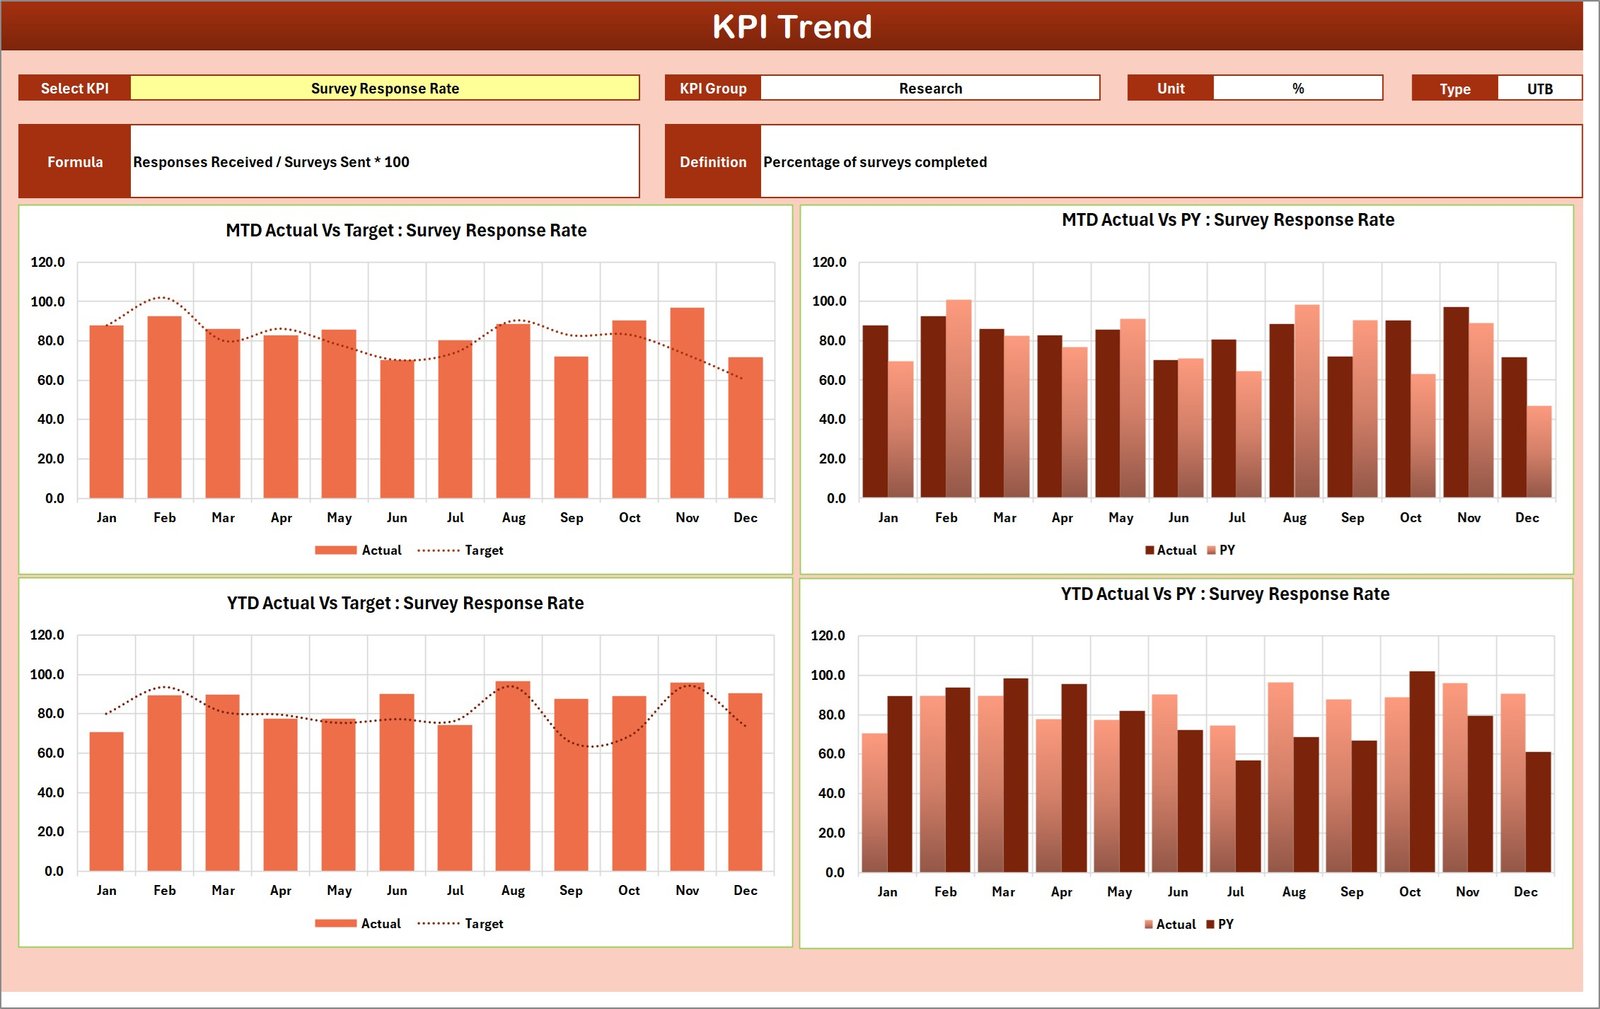
- 📈 KPI Trend Sheet: Track individual KPI trends over time. Select KPIs from a dropdown menu to view their groups, units, formulas, and definitions. Visual charts compare MTD, YTD, actual, target, and previous year data for effective trend analysis.
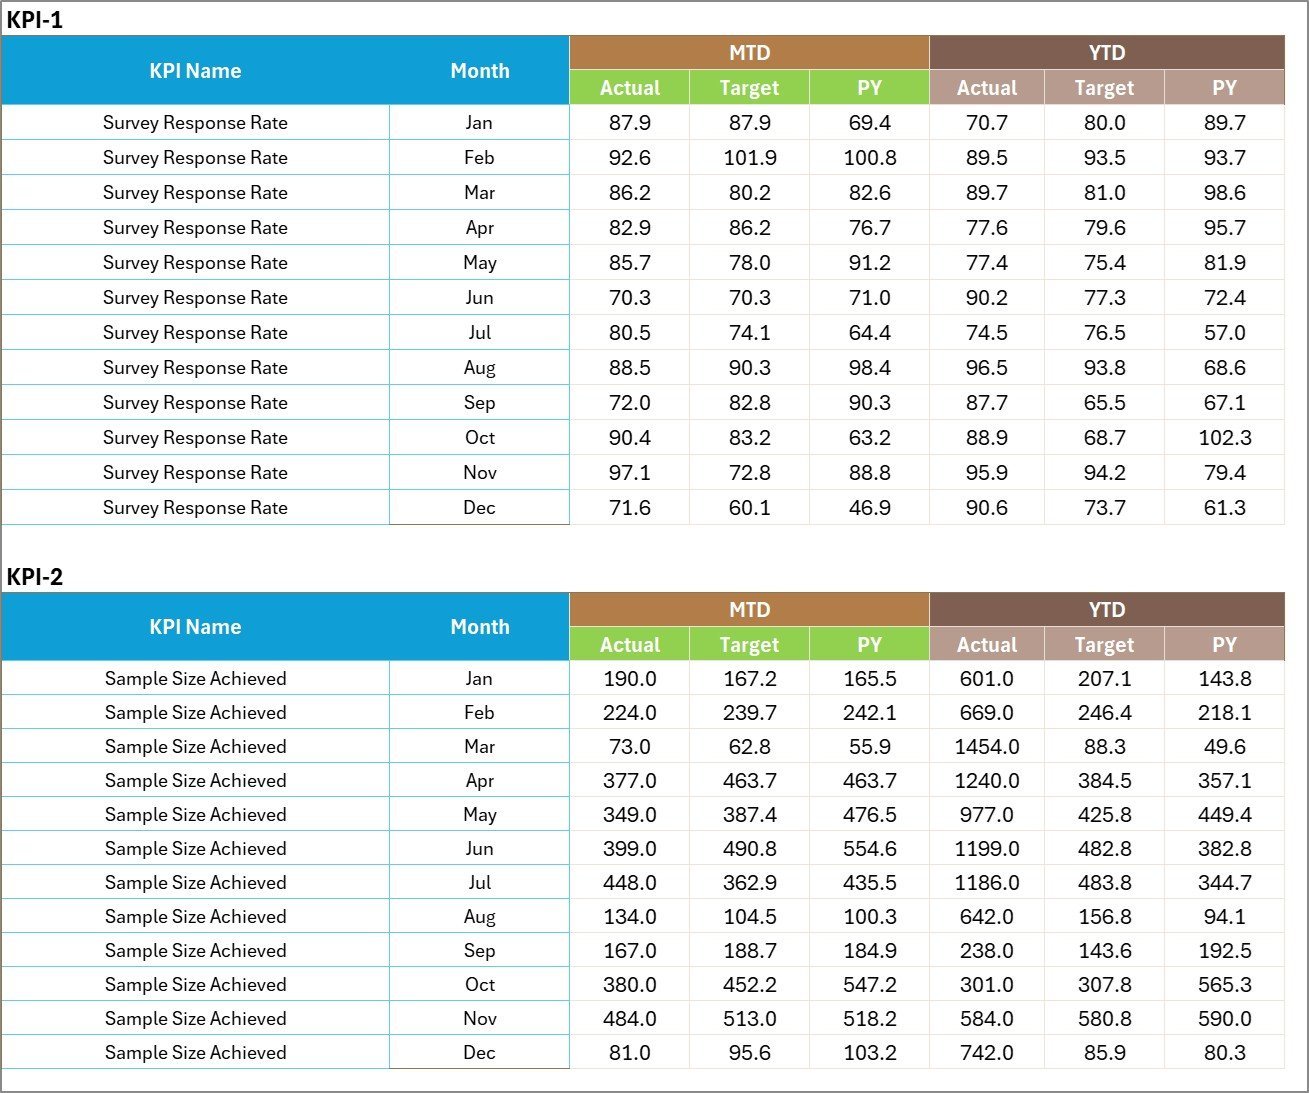
- ✍️ Input Data Sheet: Easily input and update KPI metrics such as actuals and targets. This sheet ensures your scorecard stays current and accurate with flexible data entry options.
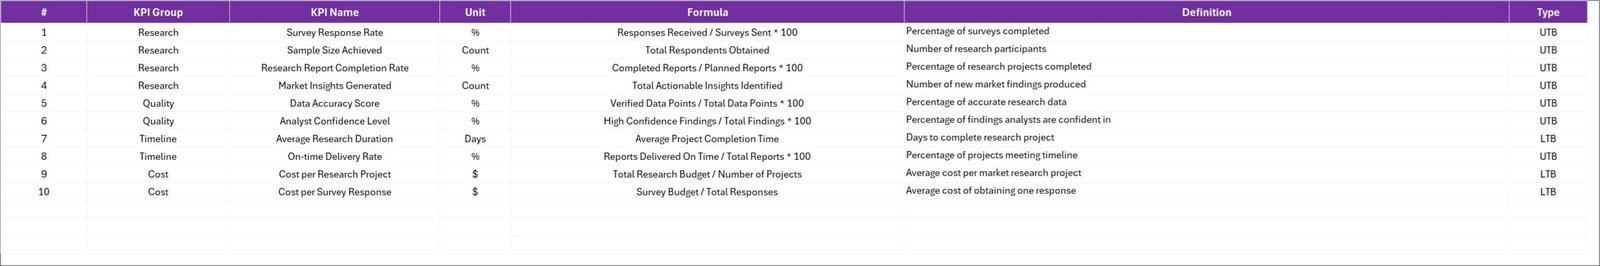
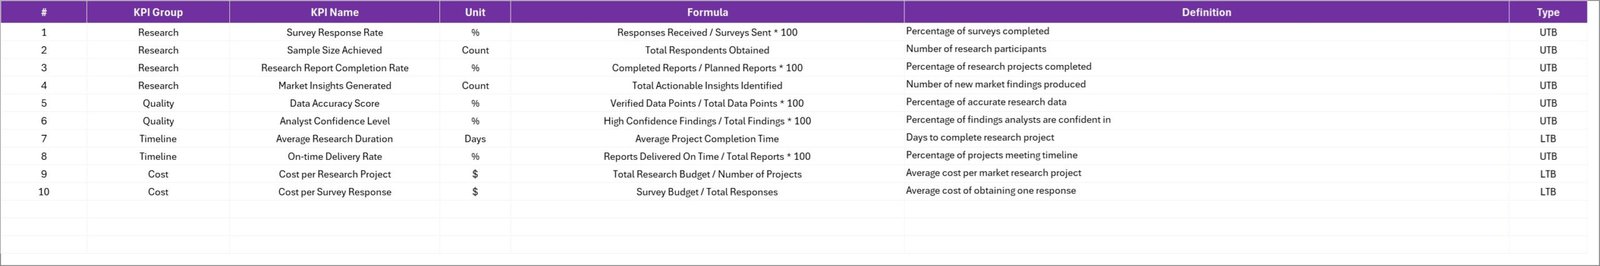
- 📚 KPI Definition Sheet: Define each KPI clearly by entering its name, group, unit, formula, and detailed explanation, providing complete clarity and context for your analysis.
What’s Inside the Market Research KPI Scorecard
This digital product includes a fully functional Excel-based KPI scorecard template featuring four integrated worksheets designed for seamless performance tracking and analysis:
Market Research KPI Scorecard
KPI Trend Sheet

Input Data Sheet
KPI Definition sheet tab
How to Use the Market Research KPI Scorecard
- 🛠️ Select Your Time Frame: Use the dropdown menus on the Scorecard Sheet to choose the month, MTD, or YTD data for performance evaluation.
- 📥 Enter Your Data: Fill in the Input Data Sheet with actual KPI values and targets to keep the dashboard updated.
- 🔍 Analyze Trends: Navigate to the KPI Trend Sheet to view visual charts and detailed KPI definitions, helping you understand performance patterns and areas for improvement.
- 📑 Define KPIs Clearly: Use the KPI Definition sheet to input KPI names, groups, units, formulas, and definitions, ensuring everyone understands the metrics.
- 📊 Make Data-Driven Decisions: Leverage the visual indicators and comparisons to quickly identify gaps between actual and target metrics and adjust strategies accordingly.
Who Can Benefit from This Market Research KPI Scorecard
- 👩💼 Market Researchers: Streamline performance tracking and reporting to boost research effectiveness.
- 📈 Marketing Analysts: Analyze KPI trends and optimize campaigns with precise data visualization.
- 👨💻 Business Managers: Monitor team and project performance to ensure targets are met on time.
- 📊 Data Analysts: Simplify complex KPI data into actionable insights using built-in charts and definitions.
- 🏢 Consultants & Agencies: Deliver professional-grade KPI reports to clients quickly and efficiently.
- 🎯 Product Managers: Track product performance metrics and market research outcomes in one place.
- 👥 Teams & Departments: Foster transparency and accountability by centralizing KPI tracking across teams.
Click here to read the Detailed blog post.
Visit our YouTube channel to learn step-by-step video tutorials.


Reviews
There are no reviews yet.