Managing aquaponics farming can quickly become overwhelming when you need to track fish production, plant yield, water usage, and financial performance simultaneously. That’s exactly why we created the Aquaponics Dashboard in Excel — a powerful, ready-to-use solution designed to simplify your entire operation.
Instead of juggling multiple spreadsheets, this dashboard gives you a centralized, interactive system to monitor, analyze, and optimize your aquaponics farm with ease. Whether you are a beginner or an experienced farmer, this tool helps you make smarter, faster, and data-driven decisions.
📊 Key Features of Aquaponics Dashboard in Excel
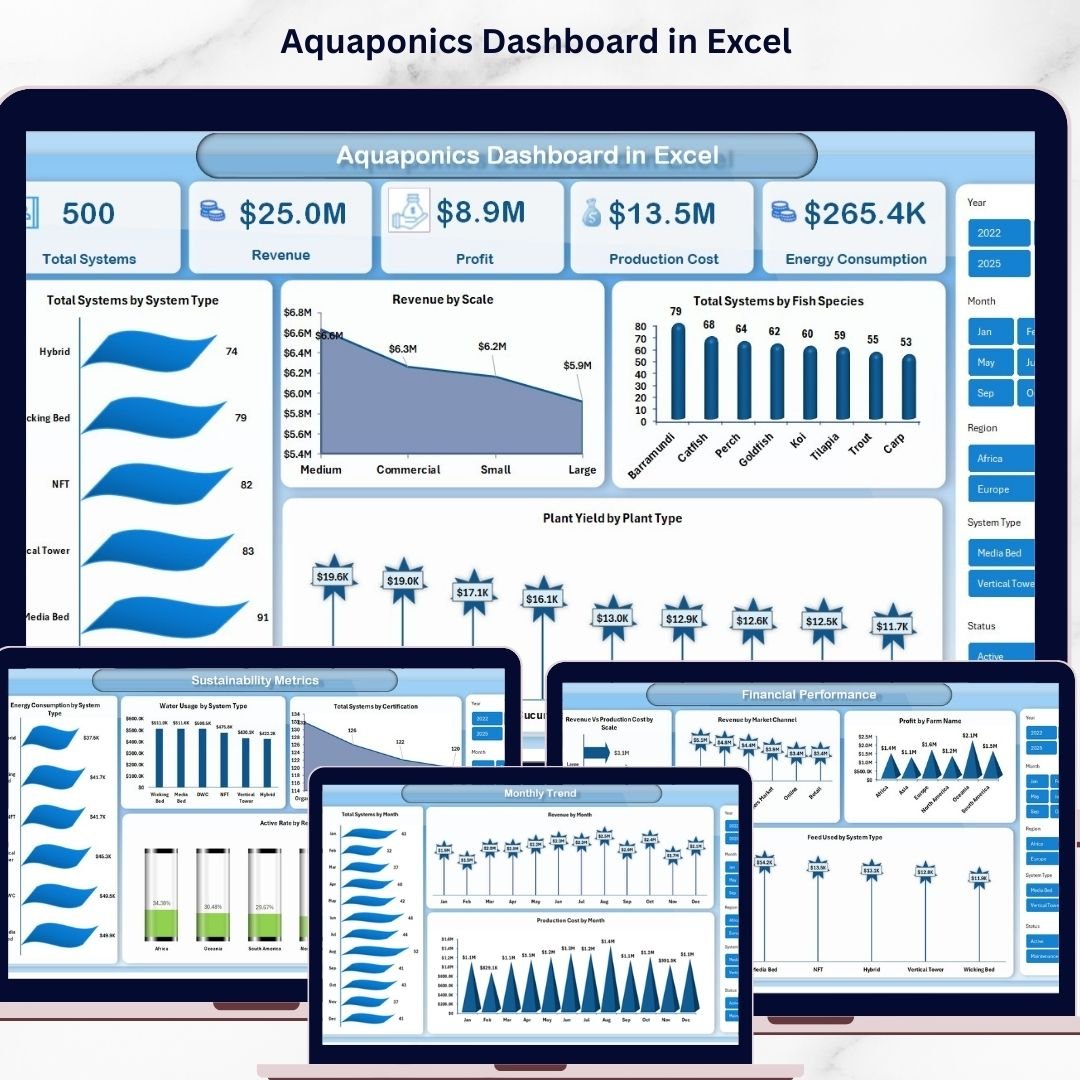
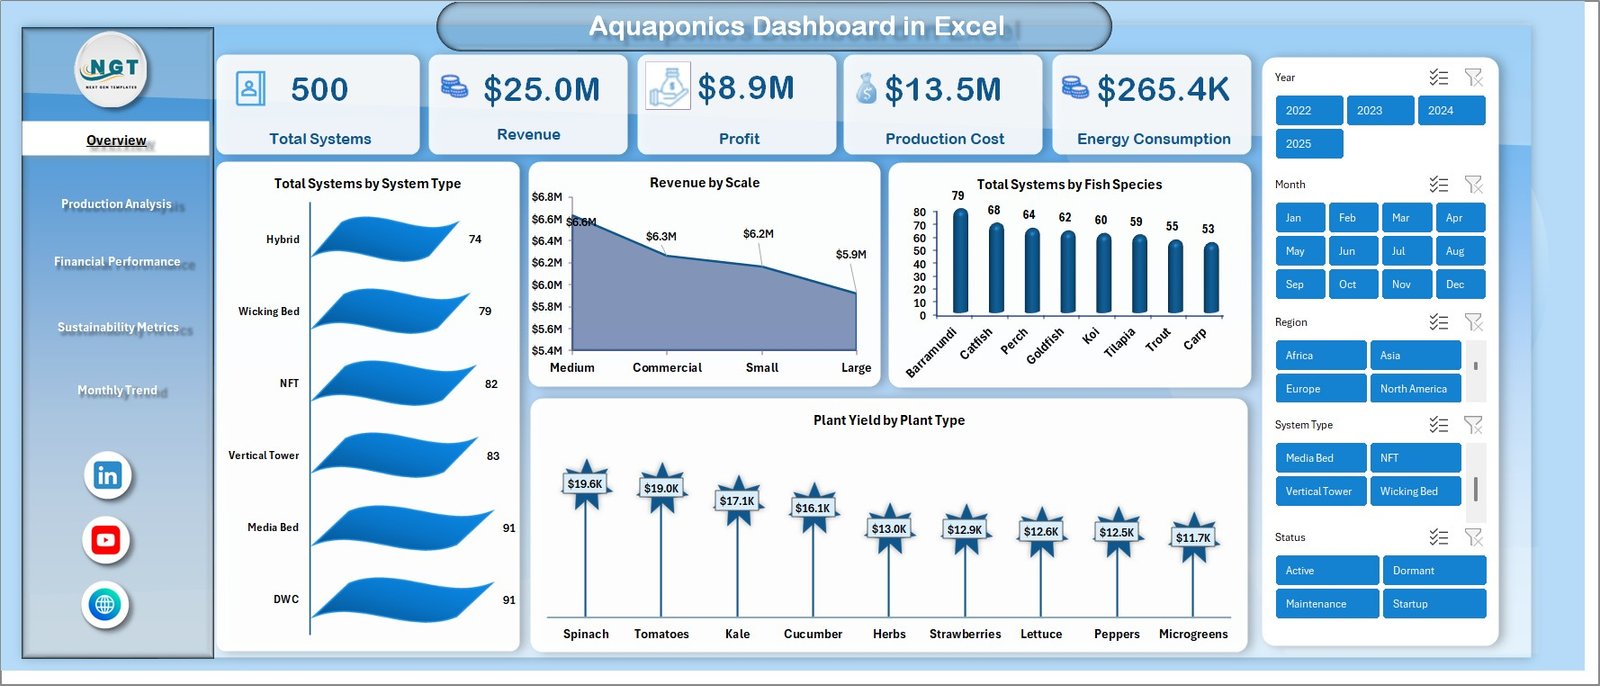
✨ All-in-One Overview Dashboard – Get a complete snapshot with KPIs like Total Systems, Revenue, Profit, Production Cost, and Energy Consumption.
📈 Advanced Visual Charts – Analyze performance through charts such as System Type, Fish Species, Plant Yield, and Revenue by Scale.
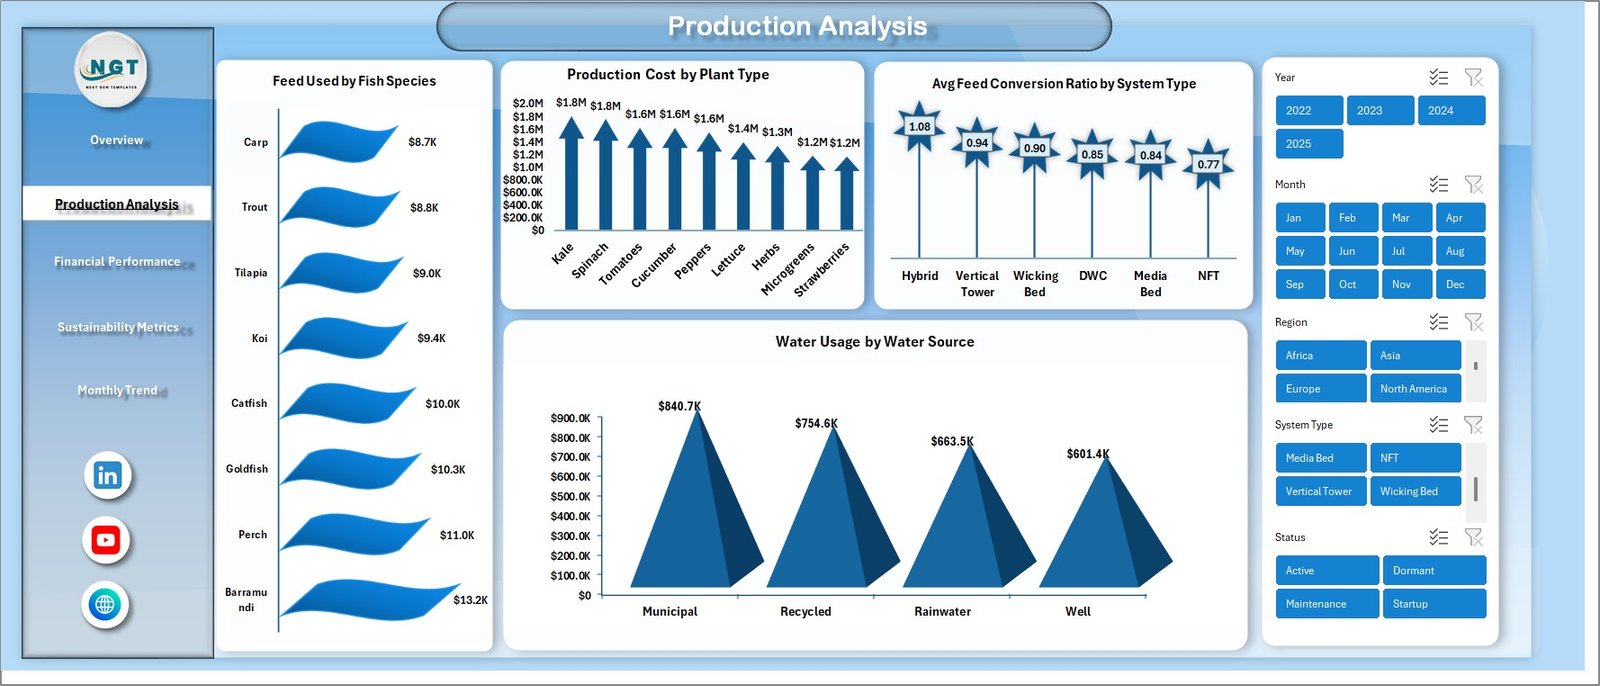
🐟 Production Optimization Insights – Track feed usage, conversion ratios, and water consumption to improve efficiency.
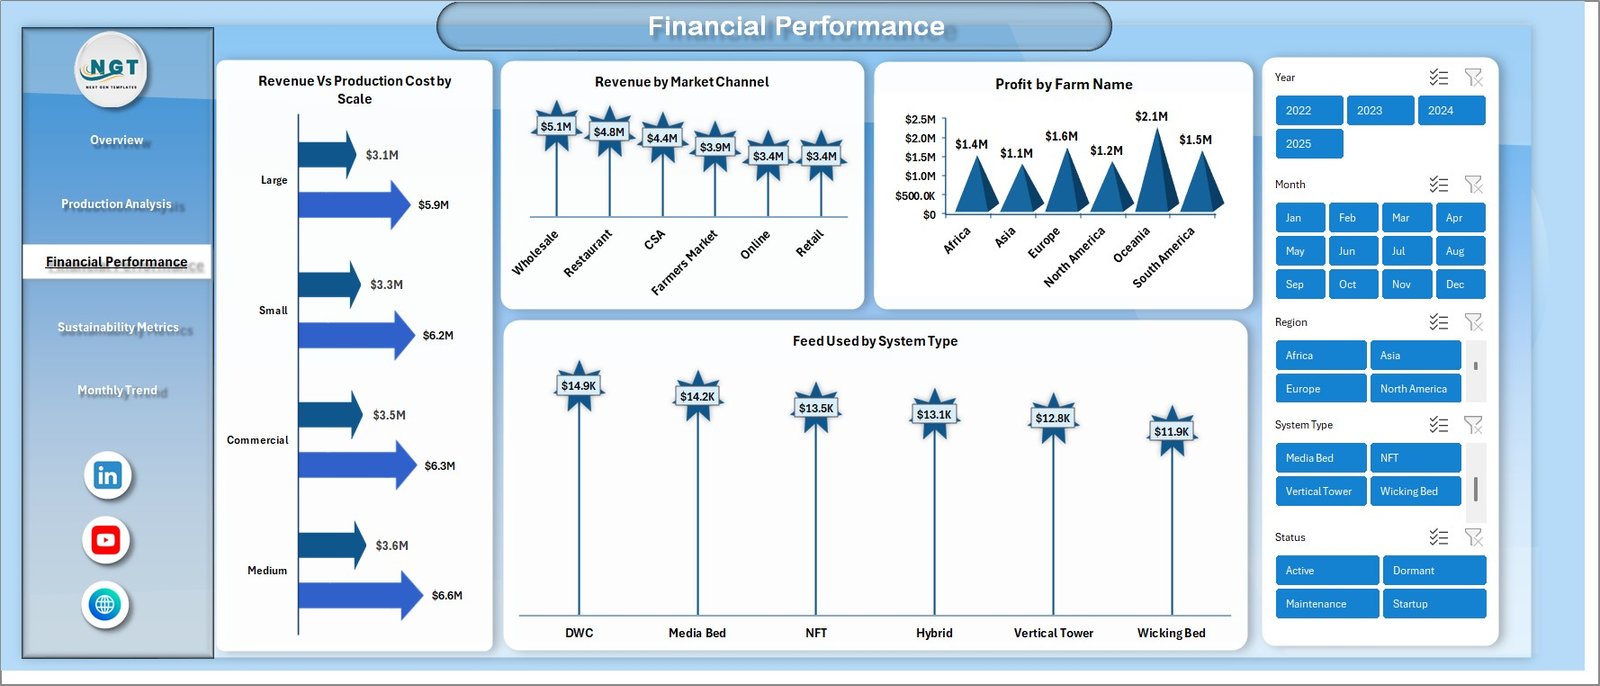
💰 Financial Performance Tracking – Compare revenue vs cost, identify profitable farms, and monitor market channels.
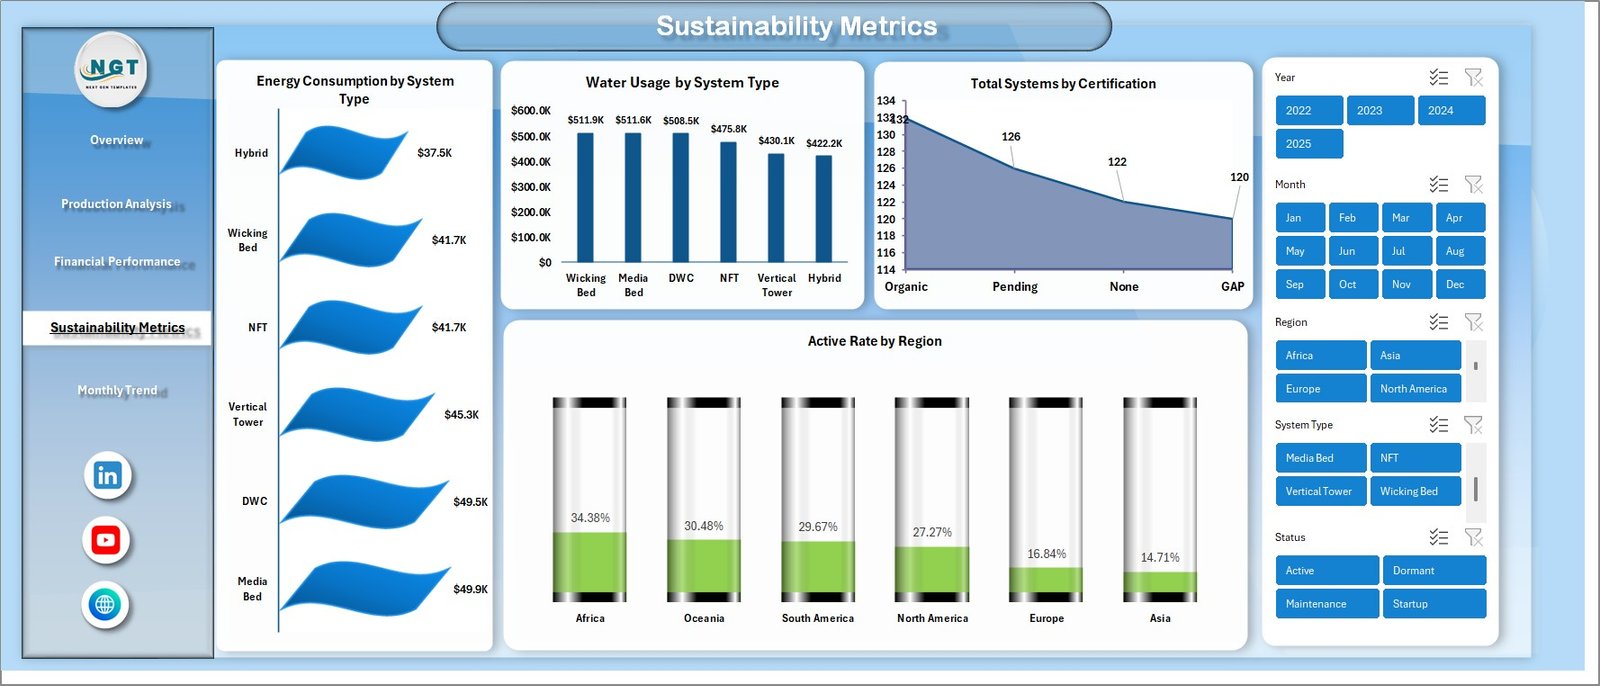
🌱 Sustainability Monitoring – Measure water usage, energy consumption, certifications, and regional activity rates.
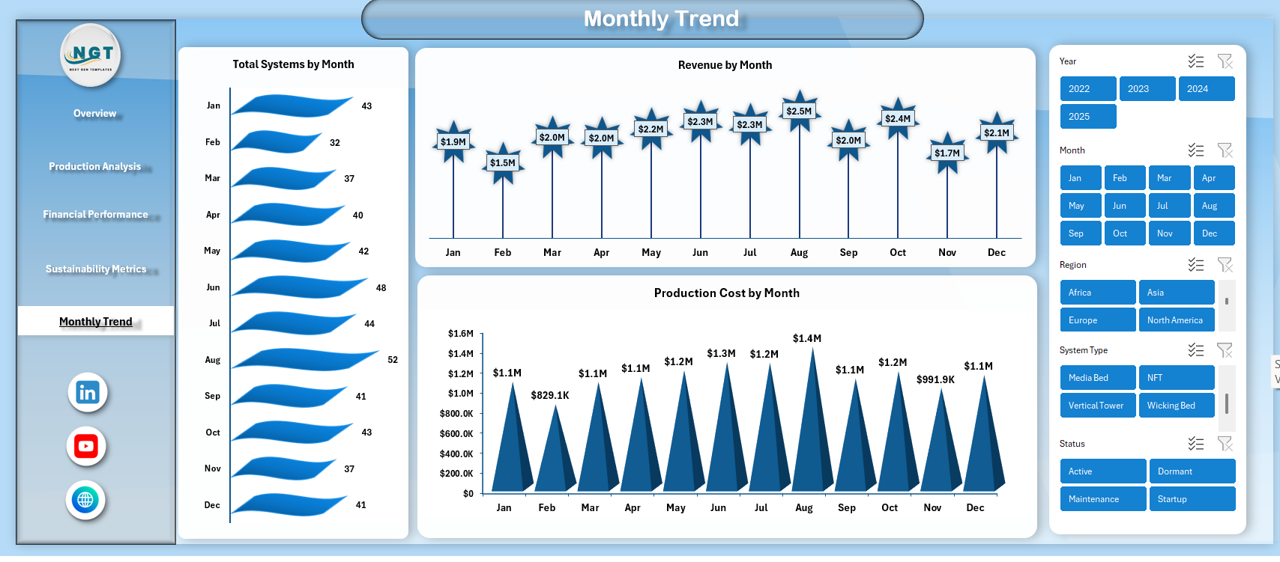
📅 Monthly Trend Analysis – Identify seasonal patterns with monthly tracking of systems, revenue, and production costs.
⚡ Interactive Slicers & Filters – Easily slice data for deeper analysis and quick decision-making.
🔄 Fully Customizable Excel Model – Modify based on your farm size and requirements.
📦 What’s Inside the Aquaponics Dashboard in Excel
📁 Overview Sheet – Central dashboard with 5 KPI cards and 4 visual charts for quick insights.
📊 Production Analysis Sheet – Detailed insights into feed usage, cost distribution, and water sources.
💵 Financial Performance Sheet – Deep financial analysis including revenue, profit, and cost comparisons.
🌍 Sustainability Metrics Sheet – Track eco-friendly operations with energy and water usage analytics.
📆 Monthly Trends Sheet – Monitor growth patterns and performance over time.
📌 Structured Data Model – Pre-built Excel tables, pivot tables, and dynamic charts.
⚙️ How to Use the Aquaponics Dashboard in Excel
👉 Step 1: Enter your raw data (fish production, plant yield, costs, etc.)
👉 Step 2: Update the Excel tables provided
👉 Step 3: Refresh pivot tables and charts
👉 Step 4: Use slicers to filter data dynamically
👉 Step 5: Analyze insights and make informed decisions
Within minutes, you will have a fully functional analytics system for your farm.
👨🌾 Who Can Benefit from This Aquaponics Dashboard?
✅ Aquaponics Farmers
✅ Agricultural Businesses
✅ Sustainable Farming Startups
✅ Farm Managers & Supervisors
✅ Researchers & Analysts
✅ Beginners entering aquaponics
No advanced Excel skills required — anyone can use it easily!
💡 Why This Dashboard is a Must-Have
This dashboard is not just a reporting tool — it’s a complete decision-making system. It helps you:
✔ Identify high-performing systems
✔ Reduce feed wastage
✔ Improve plant yield
✔ Optimize water and energy usage
✔ Increase profitability
As a result, you can run a more efficient, sustainable, and profitable aquaponics business.
Click here to read the Detailed blog post
Watch the step-by-step video tutorial:


