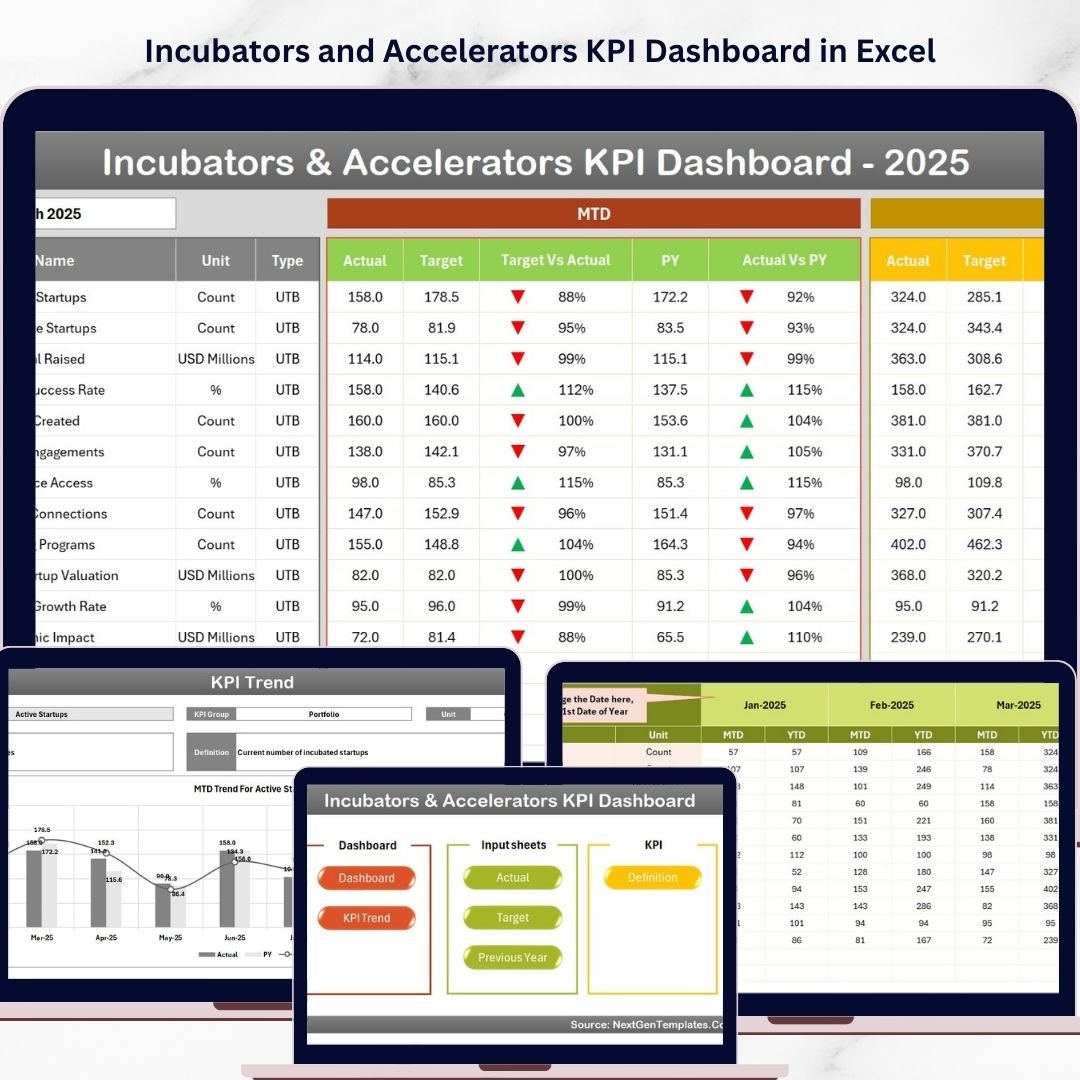

Key Features of Incubators & Accelerators KPI Dashboard
Introducing the Incubators and Accelerators KPI Dashboard, a comprehensive digital tool designed to help startups, incubators, and accelerator programs track and analyze their key performance indicators (KPIs) with ease and precision. This dashboard is meticulously crafted to provide clear, actionable insights that empower decision-makers to optimize growth and performance.
The dashboard consists of 7 interactive worksheets, each serving a unique purpose to streamline your data management and visualization needs:
- 🏠 Home Sheet: A centralized index page featuring six intuitive buttons that allow quick navigation to the respective worksheets, helping users move seamlessly across the dashboard.
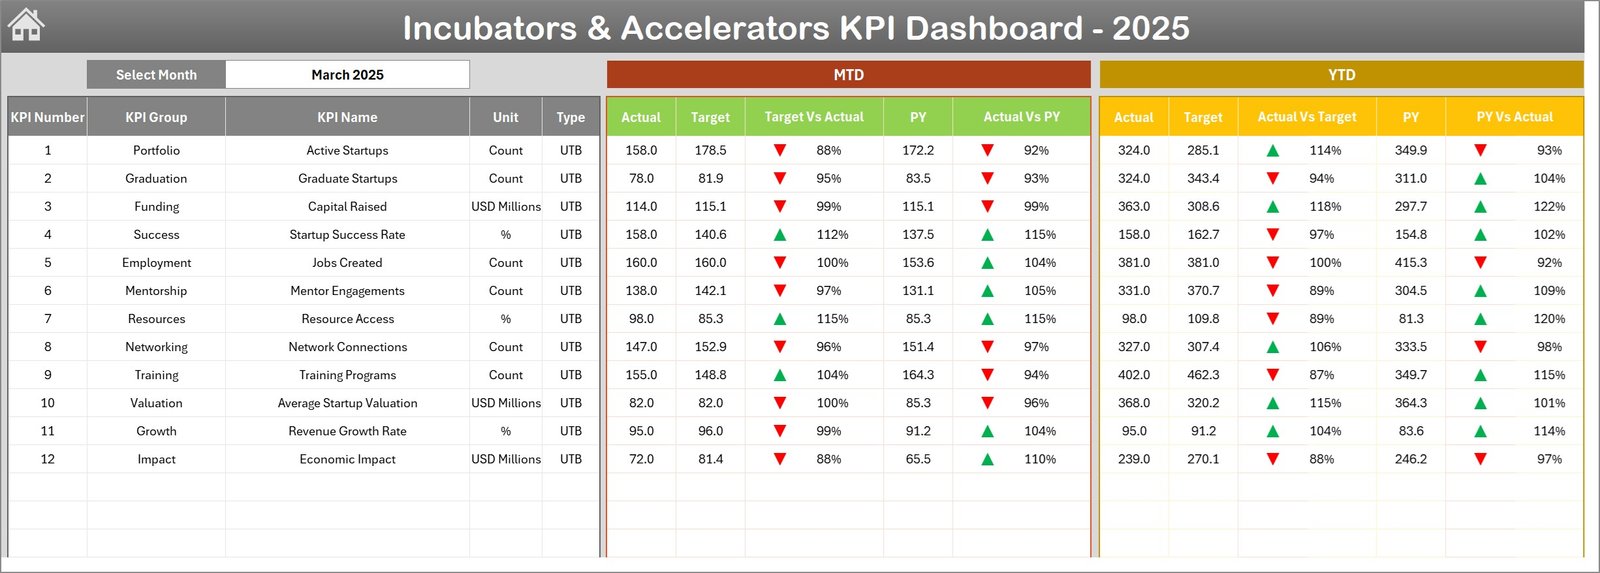
- 📊 Dashboard Sheet Tab: The core of the dashboard where you can select the month via a drop-down menu (cell D3) to dynamically update all KPIs. It displays Month-to-Date (MTD) Actual, Target, Previous Year (PY) data, and highlights Target vs Actual as well as PY vs Actual comparisons using conditional formatting with up and down arrows. Year-to-Date (YTD) data is also presented with the same detailed comparison and formatting.
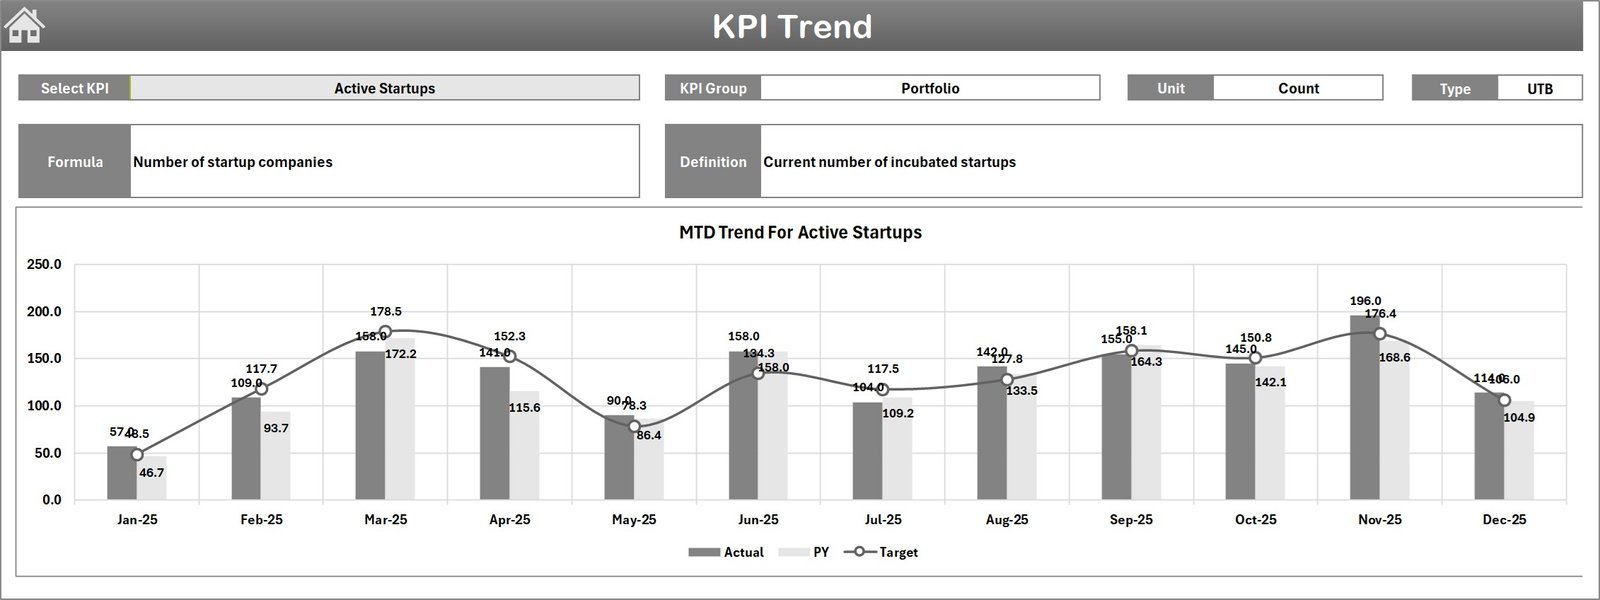
- 📈 KPI Trend Sheet Tab: Select any KPI from a drop-down (cell C3) to view its group, unit, KPI type (whether Lower the Better or Upper the Better), formula, and definition. This sheet features dynamic MTD and YTD trend charts for Actual, Target, and PY values, enabling visual tracking of KPI progress over time.
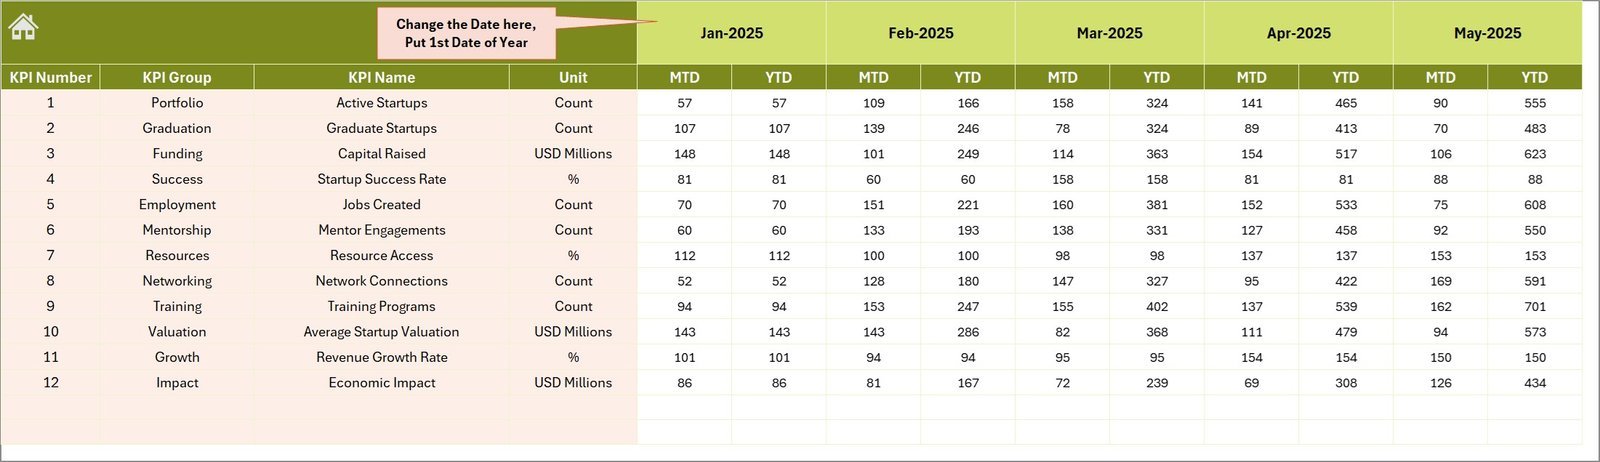
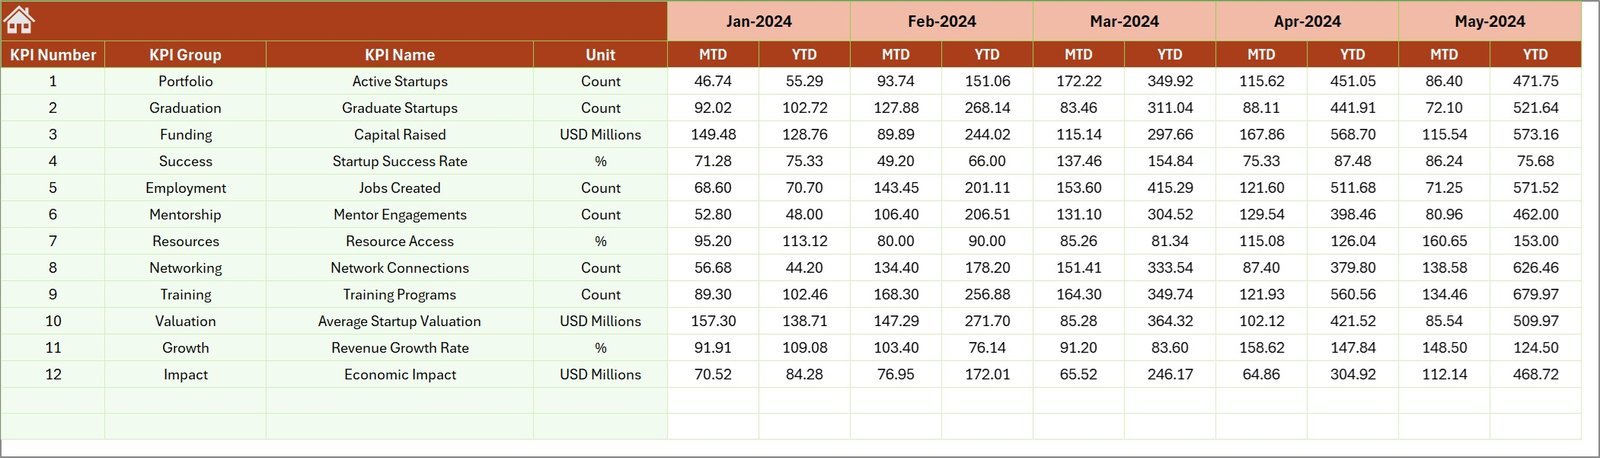
- 📝 Actual Numbers Input Sheet: Enter the actual MTD and YTD numbers for each KPI here. You can set the first month of the year (cell E1) to adjust the timeline accordingly, ensuring your data is always aligned and up to date.
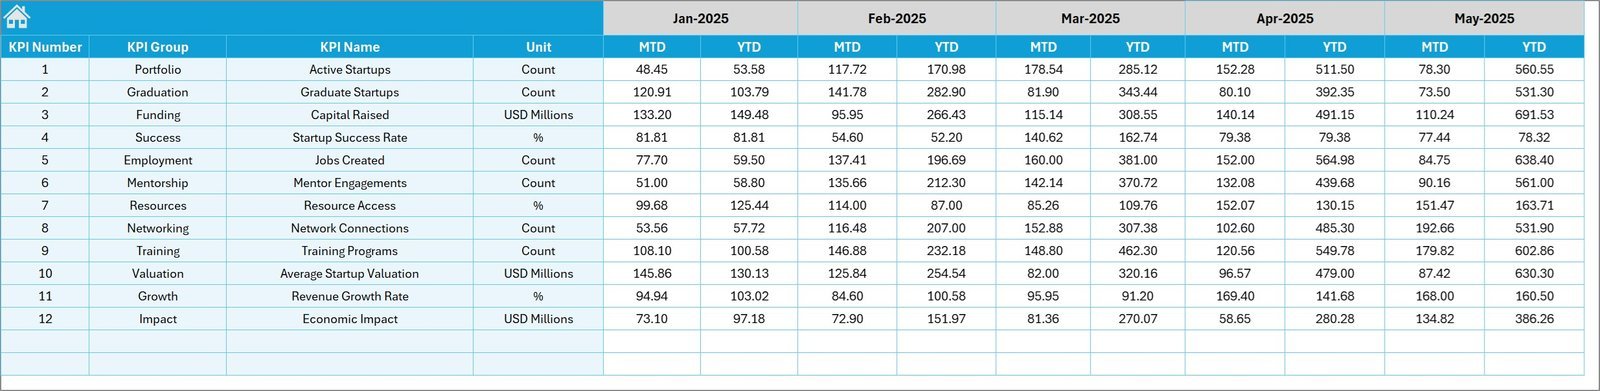
- 🎯 Target Number Input Sheet: Input your monthly MTD and YTD target numbers for each KPI, allowing you to set clear goals and track your performance against them effectively.
- 📅 Previous Year Number Sheet Tab: Record the previous year’s corresponding KPI numbers here to enable year-over-year performance comparisons and trend analysis.
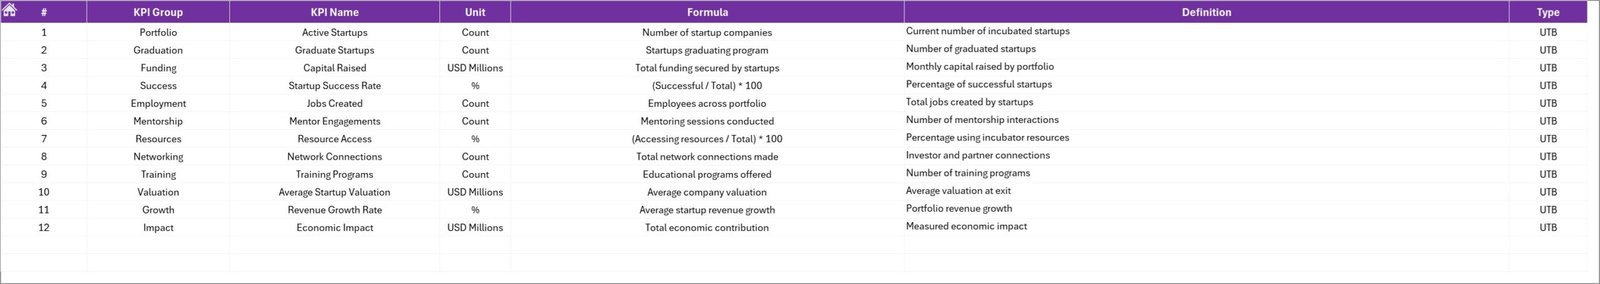
- 📚 KPI Definition Sheet Tab: Define each KPI by entering its name, group, unit, formula, and a detailed description. The sheet also requires specifying the KPI type as LTB (Lower the Better) or UTB (Upper the Better), ensuring clarity and consistency in KPI evaluation.
What’s Inside the Incubators & Accelerators KPI Dashboard
This digital product includes a fully editable Excel-based KPI dashboard with all seven sheets described above, optimized for easy data entry, visualization, and performance tracking. The dashboard is designed to be user-friendly and flexible, making it perfect for organizations of all sizes involved in startup incubation and acceleration programs.
Each sheet is thoughtfully designed to offer a seamless experience, with features like drop-down menus, conditional formatting, and dynamic charts that update instantly based on input data. The dashboard supports accurate month-to-month, year-to-date, and year-over-year comparisons, ensuring you never miss vital insights.
How to Use the Incubators & Accelerators KPI Dashboard
Using this KPI dashboard is straightforward and intuitive:
- 🔍 Start at the Home Sheet to navigate between sections quickly.
- 📅 Select the month on the Dashboard Sheet to view updated KPIs.
- ✍️ Input actual performance data in the Actual Numbers Input Sheet and targets in the Target Number Input Sheet.
- 🗓️ Enter previous year data into the Previous Year Number Sheet for comparative analysis.
- 📊 Use the KPI Trend Sheet to monitor KPI progress with visual charts and detailed KPI info.
- 📝 Maintain and update KPI definitions in the KPI Definition Sheet to ensure all users understand the metrics’ context and calculation methods.
Regularly updating this dashboard will provide you with actionable insights and allow you to stay on track with your incubation or acceleration goals.
Who Can Benefit from This Incubators & Accelerators KPI Dashboard
This KPI Dashboard is an essential tool for:
- 🚀 Startup Incubators seeking to monitor the progress and success metrics of their portfolio startups.
- ⚡ Accelerator Programs aiming to track performance improvements and program effectiveness over time.
- 📈 Program Managers who need a consolidated view of KPIs for strategic decision-making.
- 👥 Investors and Stakeholders requiring transparent, easy-to-understand performance reports.
- 🧑💼 Consultants and Analysts who want to deliver precise KPI tracking and reporting to clients.
Whether you are managing a small startup cohort or a large accelerator program, this dashboard will simplify your KPI tracking and empower data-driven decisions.
Click here to read the Detailed blog post.
Visit our YouTube channel to learn step-by-step video tutorials


Reviews
There are no reviews yet.