Arbitration and Mediation Dashboard are an inevitable part of modern business operations. Organizations regularly handle conflicts related to contracts, regulatory compliance, financial claims, service agreements, and partnership obligations. Because these disputes can significantly impact financial stability, reputation, and operational continuity, businesses must carefully track arbitration and mediation processes.
However, many legal teams still rely on scattered spreadsheets, emails, and manual reports to manage dispute resolution activities. As a result, it becomes difficult to monitor case progress, analyze settlement outcomes, track claim amounts, and evaluate legal performance effectively.
To solve this challenge, organizations are increasingly adopting structured analytics solutions to centralize dispute data. One powerful solution is the Arbitration and Mediation Dashboard in Excel.
The Arbitration and Mediation Dashboard in Excel is a ready-to-use, interactive reporting tool designed to help legal teams, arbitration centers, law firms, and corporate legal departments monitor dispute resolution cases through clear visual insights. This dashboard transforms complex legal case data into intuitive charts, KPI cards, and filters that enable faster and more accurate decision-making.
Instead of reviewing large spreadsheets manually, legal professionals can use this dashboard to analyze dispute trends, monitor case status, evaluate settlement performance, and track financial outcomes in one centralized interface.
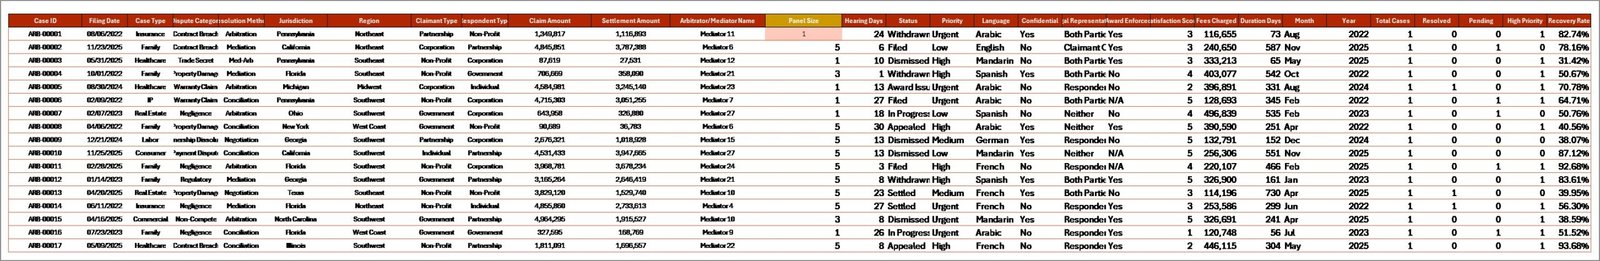
This dashboard collects and analyzes dispute data such as case ID, dispute category, claim amount, settlement value, arbitrator details, claimant type, case status, and resolution method. Using Excel’s powerful analytics capabilities, the dashboard converts this information into interactive charts and performance indicators.
With dynamic slicers and filters, users can easily analyze dispute cases based on case type, resolution method, jurisdiction, claimant category, or time period. As a result, legal teams gain deeper insights into case distribution, dispute trends, and financial exposure.
The dashboard is structured across five analytical pages, each designed to provide insights into different aspects of dispute management, including case analysis, resolution performance, financial outcomes, and monthly dispute trends.
Whether used by corporate legal teams, arbitration institutions, government dispute resolution departments, or law firms, this dashboard offers a comprehensive platform to monitor arbitration and mediation cases.
By converting raw dispute data into meaningful analytics, the Arbitration and Mediation Dashboard in Excel helps organizations improve dispute management efficiency, enhance legal decision-making, and strengthen financial transparency.
⚖️ Key Feature of Arbitration and Mediation Dashboard in Excel
📊 Interactive Legal Analytics Dashboard
Monitor arbitration and mediation cases using visual charts and KPI indicators.
⚖️ Dispute Case Monitoring
Track case status, pending disputes, and resolution performance.
💰 Claim & Settlement Analysis
Analyze claim amounts, settlement values, and recovery rates.
📂 Case Category Insights
Understand trends across dispute categories and case types.
📈 Resolution Method Evaluation
Compare arbitration and mediation performance.
👨⚖️ Arbitrator Performance Tracking
Evaluate dispute resolution efficiency by arbitrator.
📅 Monthly Dispute Trend Analysis
Track claim amounts, case volumes, and resolution rates across months.
🎛 Interactive Slicers & Filters
Filter dispute data by case type, claimant category, region, or month.
📊 Pivot-Based Excel Analytics
Leverage pivot tables, charts, and conditional formatting for powerful analysis.
⚙️ Easy Data Input Structure
Simple data sheets allow users to update case data quickly.
📊 What’s Inside the Arbitration and Mediation Dashboard in Excel
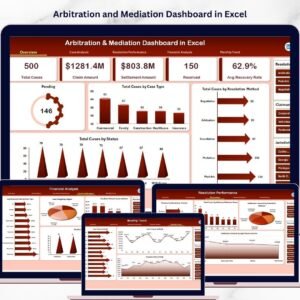
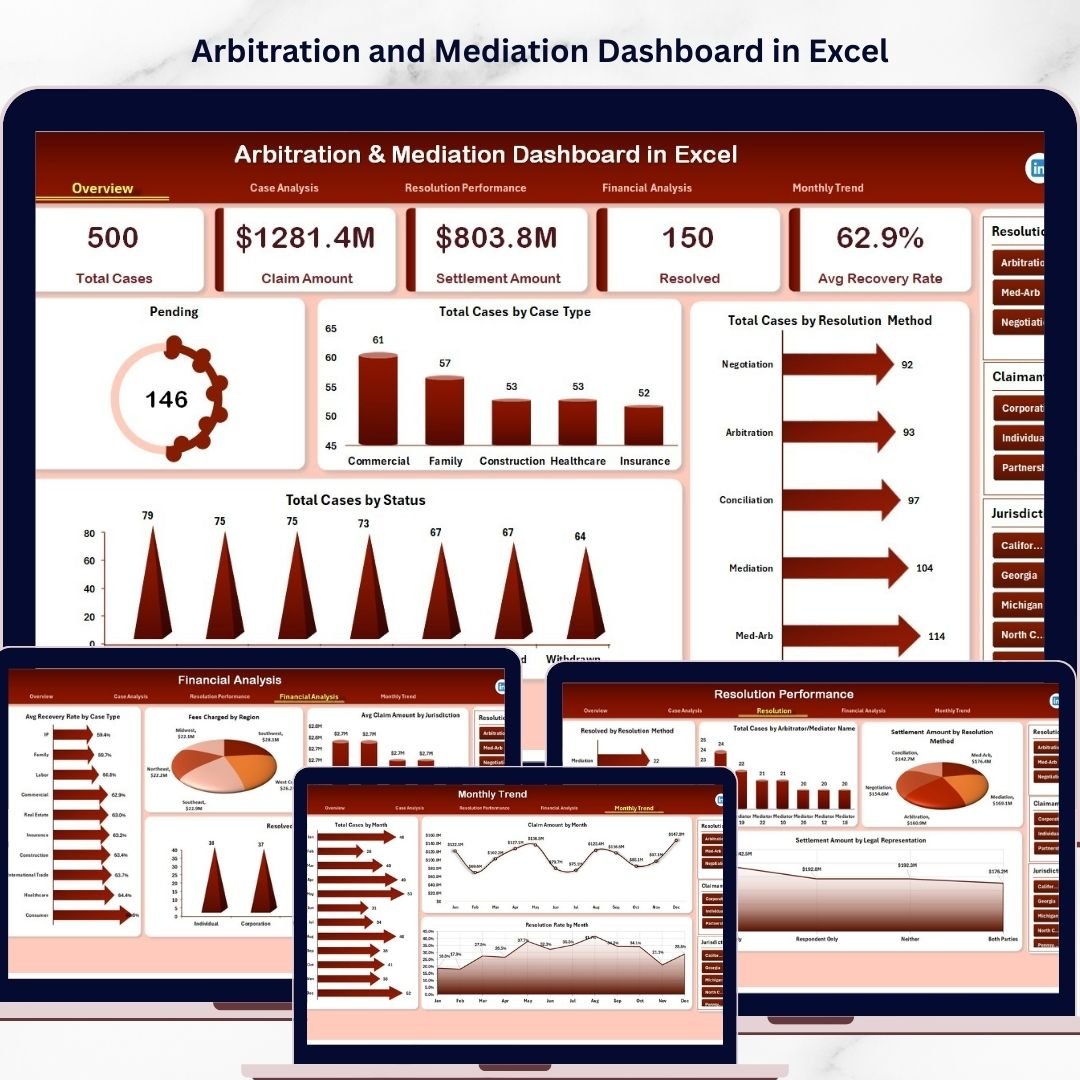
The dashboard includes five analytical pages, each focusing on a specific aspect of dispute resolution.
⚖️ Overview Page – Dispute Resolution Summary
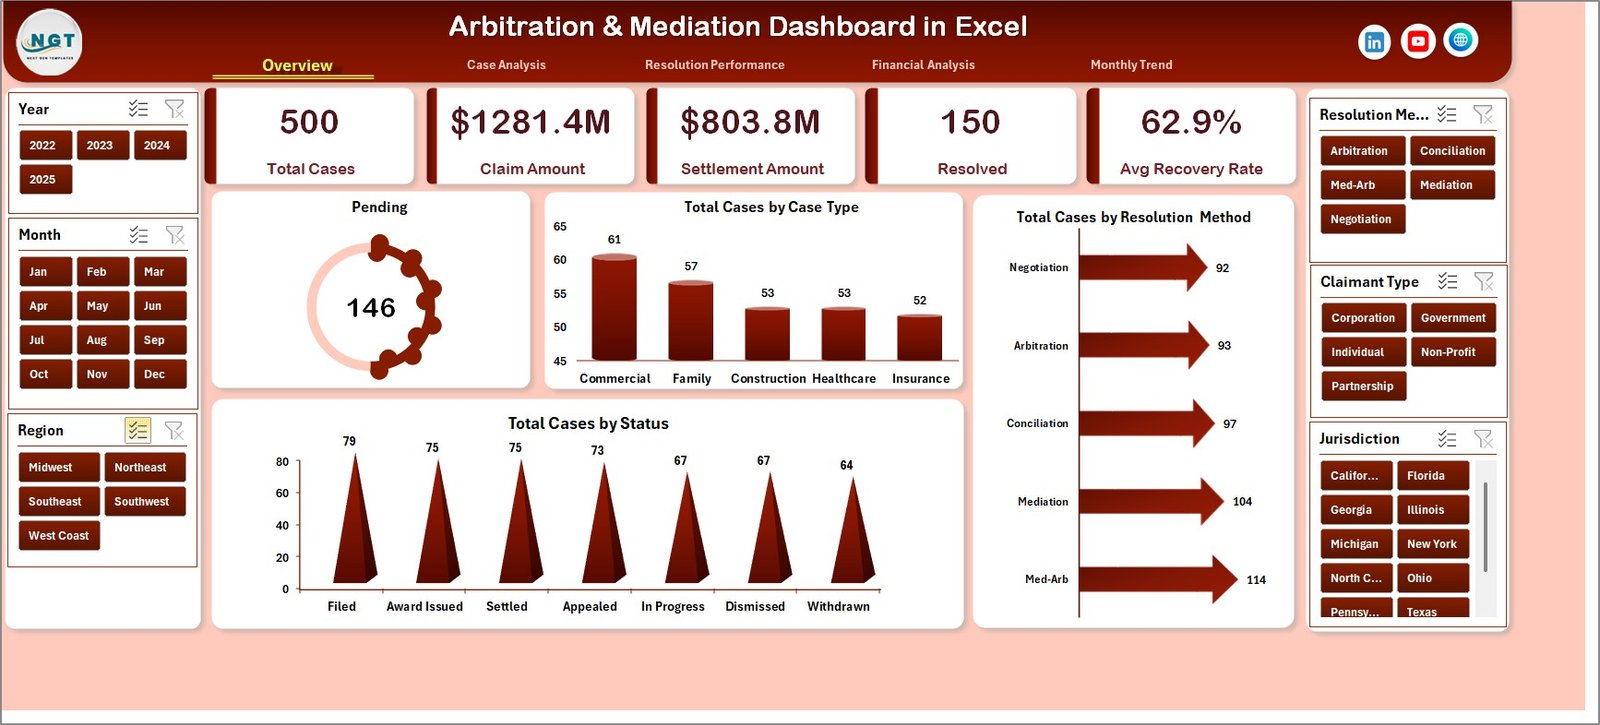
The Overview Page provides a quick snapshot of dispute resolution performance.
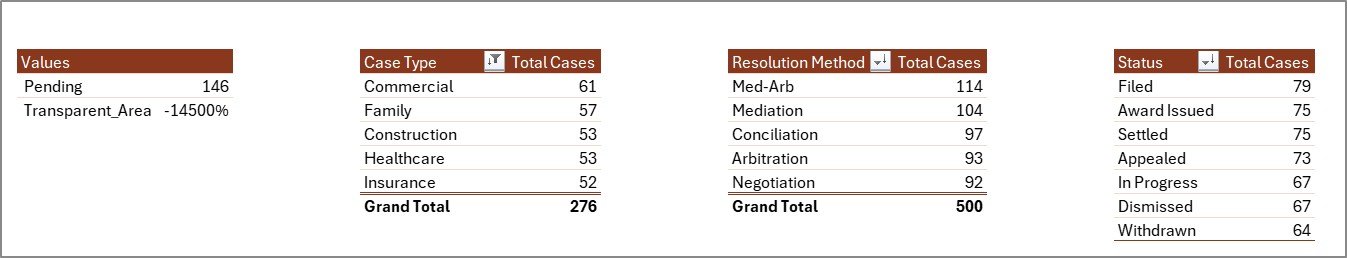
This page contains key KPI indicators such as:
• Pending Cases
• Total Cases by Case Type
• Total Cases by Resolution Method
• Total Cases by Status
In addition, the page includes charts that display:
• Pending Cases Overview
• Case Distribution by Type
• Arbitration vs Mediation Cases
• Case Status Distribution
These insights allow users to quickly understand dispute activity.
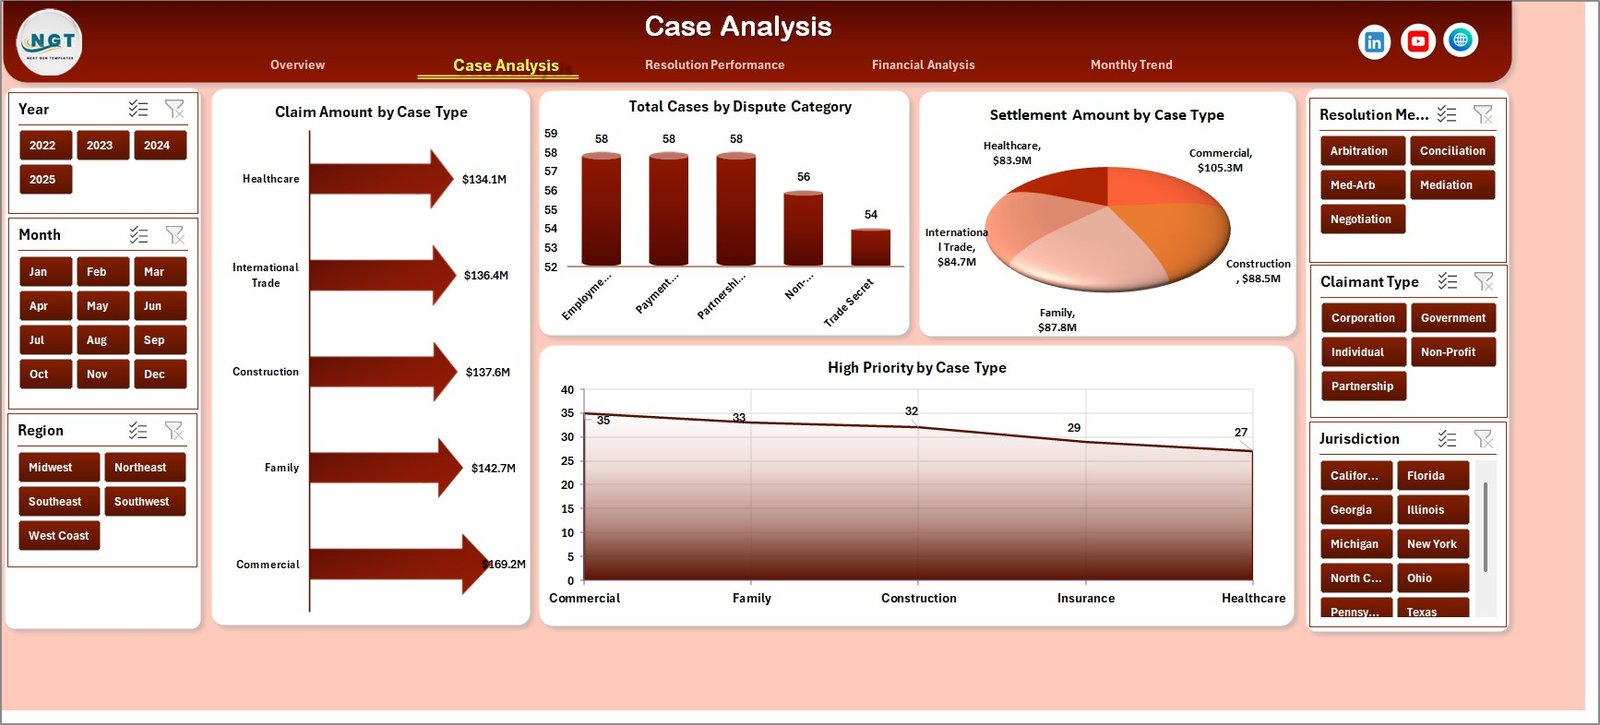
📂 Case Analysis Page
The Case Analysis Page focuses on dispute categories and claim amounts.
Charts included:
• Claim Amount by Case Type
• Settlement Amount by Case Type
• Total Cases by Dispute Category
• High Priority Cases by Case Type
This page helps organizations identify dispute types with higher financial risk.
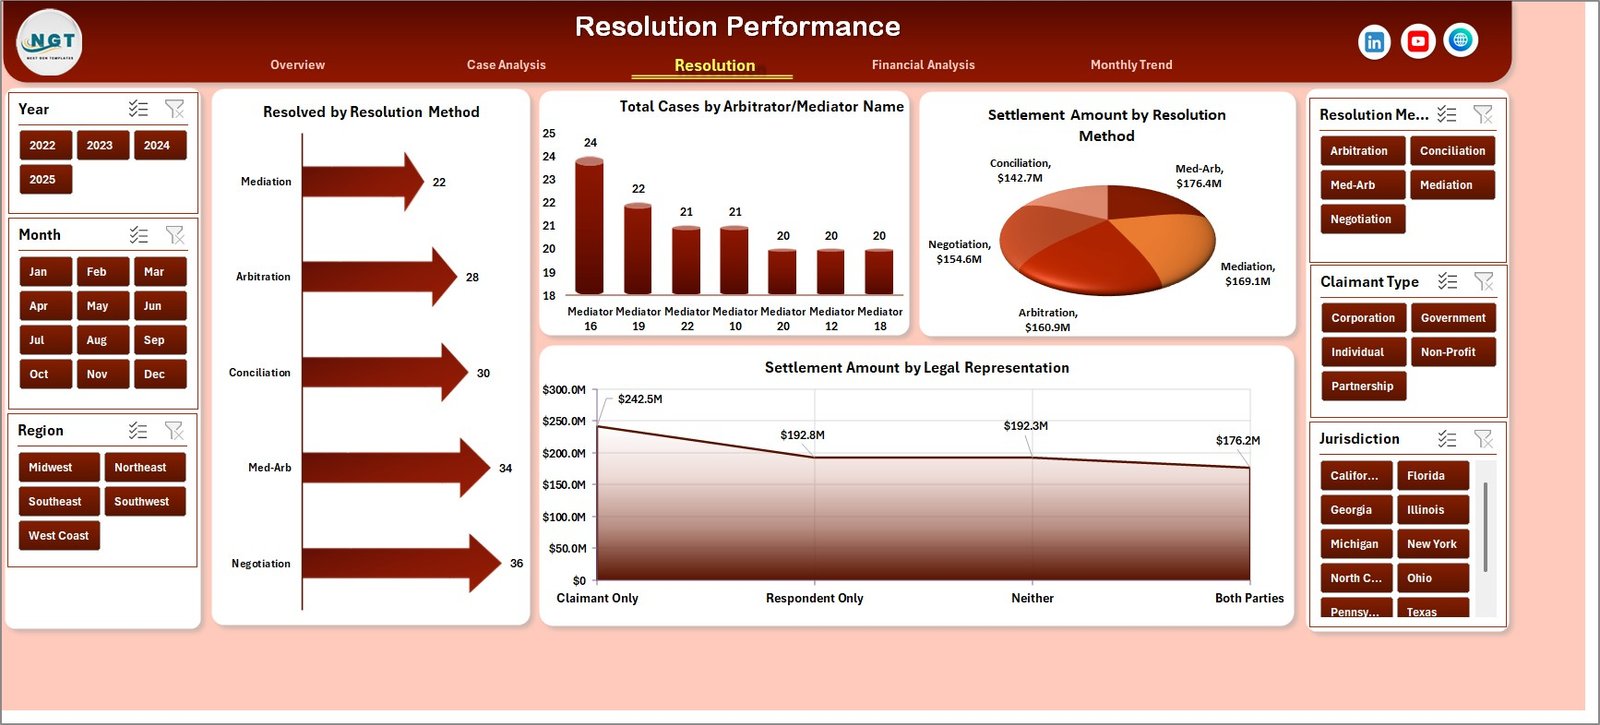
📈 Resolution Performance Page
The Resolution Performance Page evaluates dispute resolution outcomes.
Charts included:
• Resolved Cases by Resolution Method
• Total Cases by Arbitrator
• Settlement Amount by Resolution Method
• Settlement Amount by Legal Representation
This analysis helps legal teams evaluate arbitrator performance and resolution effectiveness.
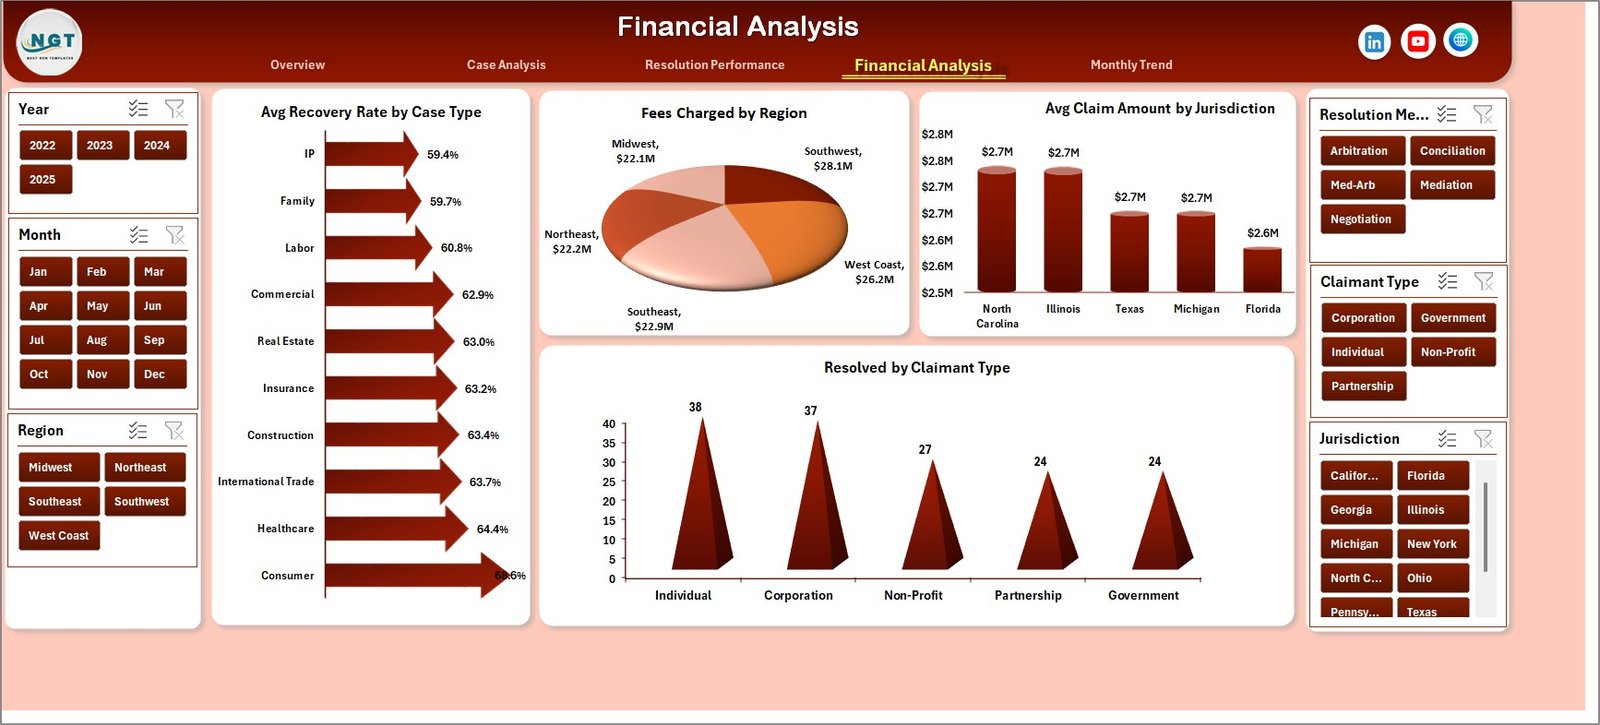
💰 Financial Analysis Page
Legal disputes often involve large financial claims. Therefore, the Financial Analysis Page focuses on monetary insights.
Charts included:
• Average Recovery Rate by Case Type
• Fees Charged by Region
• Average Claim Amount by Jurisdiction
• Resolved Cases by Claimant Type
These insights help organizations understand financial exposure and settlement outcomes.
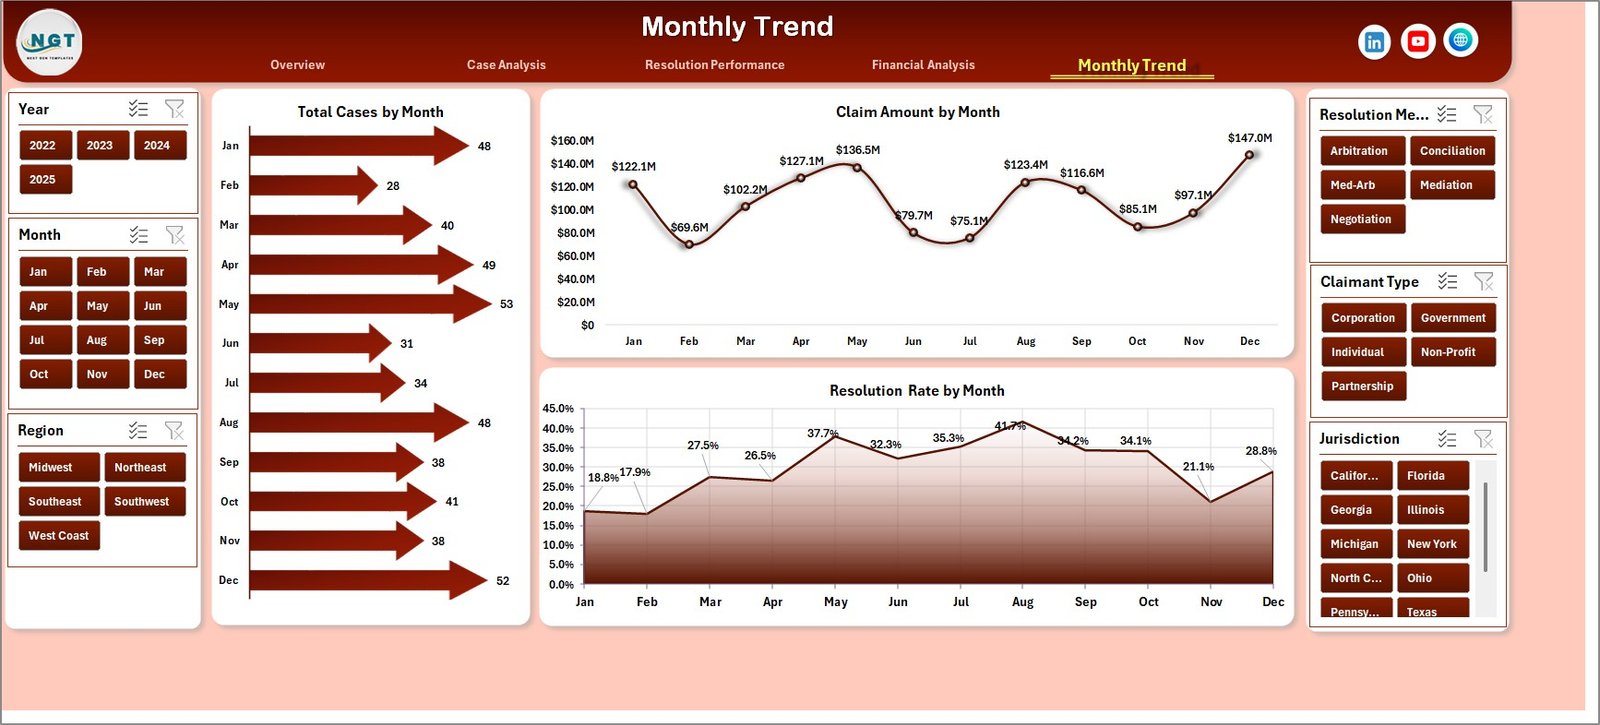
📅 Month Analysis Page
The Month Analysis Page analyzes dispute trends across time.
Charts included:
• Total Cases by Month
• Claim Amount by Month
• Resolution Rate by Month
These visuals help legal teams identify seasonal trends and case workload patterns.
⚙️ How to Use the Arbitration and Mediation Dashboard in Excel
Using this dashboard is simple and efficient.
1️⃣ Enter dispute case data in the Data Sheet.
2️⃣ Ensure fields such as case ID, claim amount, settlement value, case type, and resolution method are included.
3️⃣ Use slicers to filter insights dynamically.
4️⃣ Analyze charts across the different dashboard pages.
5️⃣ Update case data regularly to maintain accurate reporting.
Within seconds, the dashboard converts raw legal data into meaningful analytics.
👥 Who Can Benefit from This Dashboard
This dashboard is ideal for professionals involved in dispute resolution and legal analytics.
⚖️ Corporate Legal Departments
🏢 Law Firms
📑 Arbitration & Mediation Centers
📊 Compliance Teams
🏛 Government Legal Agencies
📈 Legal Data Analysts
Organizations using this dashboard gain better dispute visibility, faster legal decision-making, and improved case management efficiency.
### Click hare to read the Detailed blog post
Visit our YouTube channel to learn step-by-step video tutorials
https://youtube.com/@PKAnExcelExpert