In today’s Arbitration and Mediation Dashboard and corporate environment, organizations frequently deal with disputes related to contracts, financial claims, commercial agreements, regulatory compliance, and partnership obligations. These disputes often require structured resolution processes such as arbitration and mediation to avoid lengthy court proceedings and minimize business disruption.
However, managing dispute resolution processes can be challenging. Legal teams must track multiple cases, monitor hearing durations, evaluate settlement outcomes, analyze claim amounts, and assess financial exposure. When this information is stored across scattered spreadsheets, emails, and manual reports, it becomes difficult for legal professionals to monitor case progress and generate timely insights.
This is where the Arbitration and Mediation Dashboard in Power BI becomes an essential analytical solution.
The Arbitration and Mediation Dashboard in Power BI is a ready-to-use business intelligence dashboard designed to help legal departments, arbitration institutions, compliance teams, and law firms track dispute resolution cases through interactive visual reports. By leveraging the advanced data visualization capabilities of Microsoft Power BI, this dashboard transforms complex legal data into meaningful insights using KPI indicators, charts, and dynamic filters.
Instead of manually reviewing multiple case files and reports, legal professionals can analyze dispute resolution performance from one centralized dashboard. The system helps organizations monitor case progress, claim amounts, settlement values, hearing durations, resolution methods, and regional dispute trends.
The dashboard includes multiple analytical pages that provide insights into different aspects of dispute management such as case analysis, resolution performance, financial exposure, and monthly dispute trends.
With interactive slicers and drill-down capabilities, users can filter dispute data by case type, claim category, jurisdiction, region, or resolution method. This allows legal teams to quickly identify patterns in disputes, evaluate settlement strategies, and manage legal risks more effectively.
Whether you are managing disputes within a corporate legal department, law firm, arbitration center, or regulatory organization, this dashboard provides a comprehensive system to monitor dispute resolution performance.
By converting raw legal data into visual insights, the Arbitration and Mediation Dashboard in Power BI enables organizations to improve dispute management, enhance legal decision-making, and optimize resolution strategies.
🚀 Key Feature of Arbitration and Mediation Dashboard in Power BI
⚖️ Interactive Dispute Resolution Dashboard
Monitor arbitration and mediation cases using dynamic Power BI visualizations.
📊 Case Performance Monitoring
Track case status, priority levels, hearing durations, and resolution outcomes.
💰 Financial Dispute Analysis
Analyze claim amounts, settlement values, and fees charged across cases.
📈 Resolution Method Comparison
Compare arbitration and mediation outcomes to evaluate efficiency.
📂 Dispute Category Insights
Understand trends across different dispute categories and case types.
📅 Monthly Case Trend Analysis
Track dispute activity and settlement trends across different months.
🌍 Regional Dispute Monitoring
Analyze legal cases across jurisdictions and geographic regions.
🎛 Interactive Filters & Slicers
Filter data by case type, claimant type, resolution method, or region.
📊 Power BI Visual Analytics
Convert complex legal datasets into easy-to-interpret charts and dashboards.
⚙️ Flexible Data Integration
Connect the dashboard with Excel or case management systems for automated reporting.
📊 What’s Inside the Arbitration and Mediation Dashboard in Power BI
The dashboard contains five analytical pages, each designed to provide insights into dispute resolution activities.
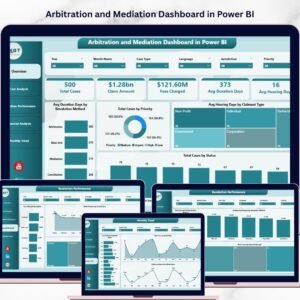
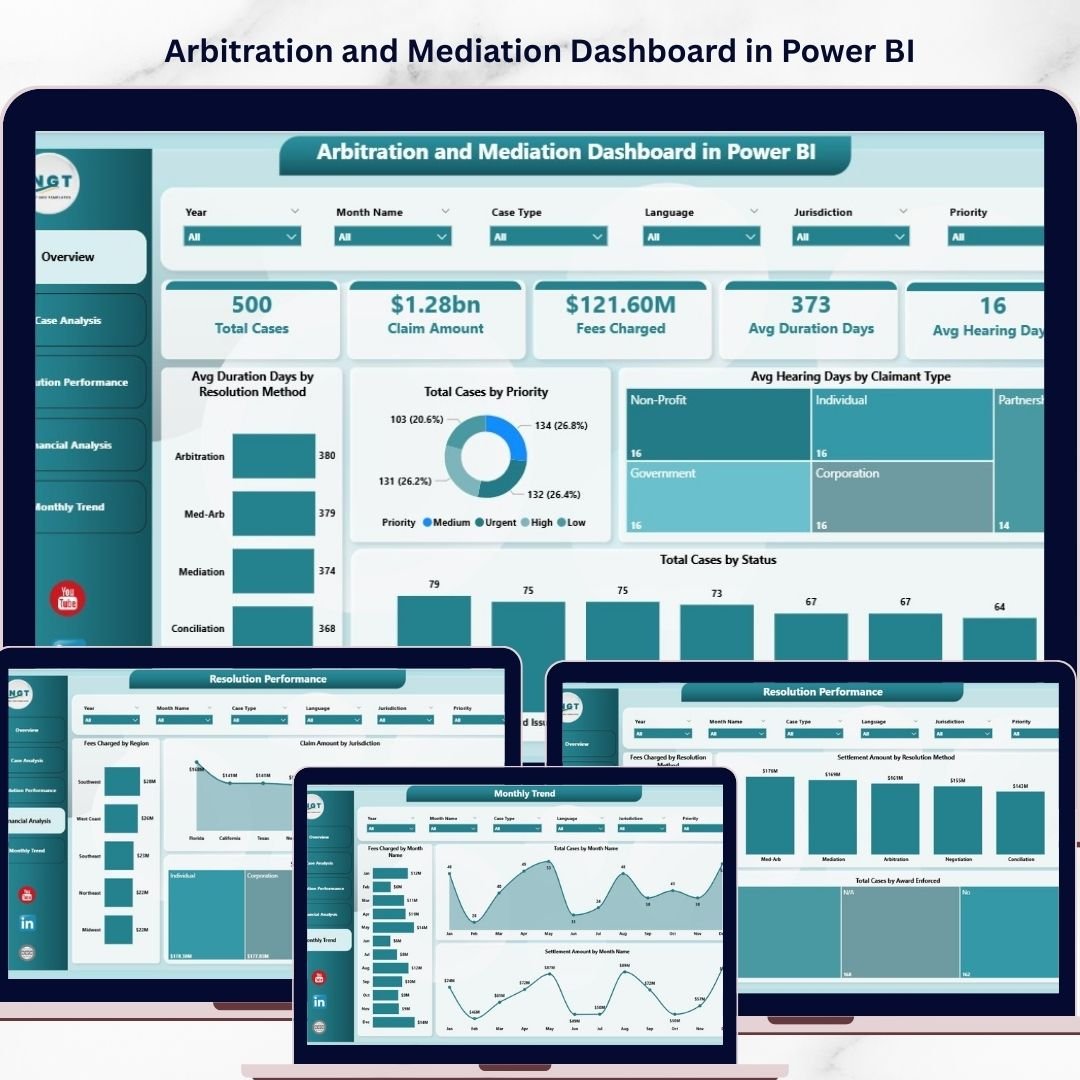
⚖️ Overview Page – Dispute Resolution Summary
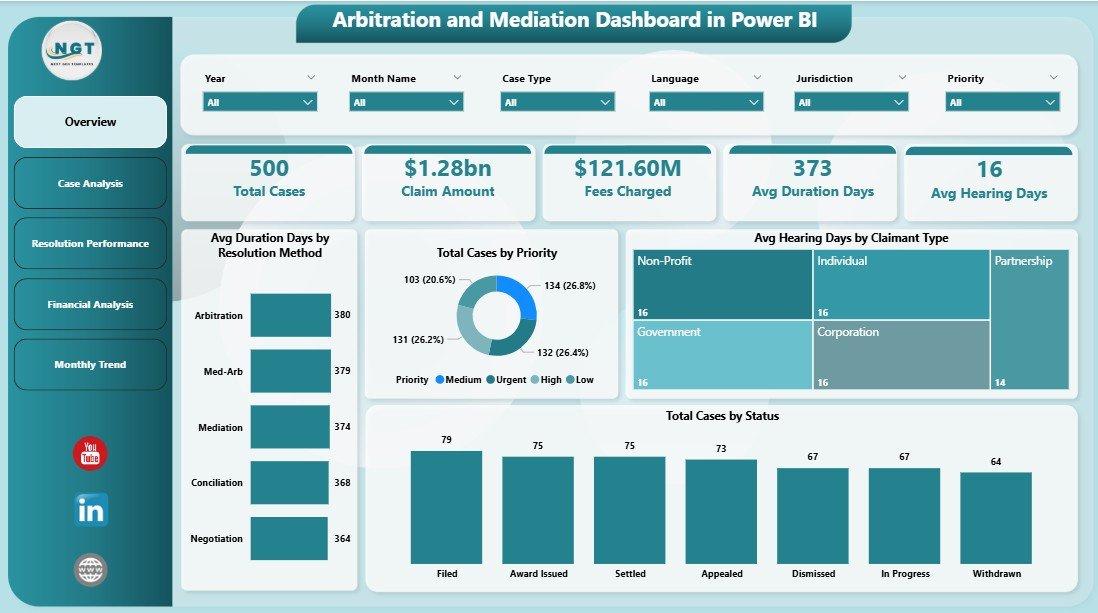
The Overview Page provides a high-level summary of dispute performance.
This page includes KPI indicators such as:
• Average Duration Days by Resolution Method
• Total Cases by Priority
• Average Hearing Days by Claim Type
• Total Cases by Status
These metrics help legal professionals quickly understand dispute resolution efficiency.
Users can apply slicers such as:
• Case Type
• Resolution Method
• Claim Type
• Region
• Month
This allows decision-makers to analyze dispute data from multiple perspectives.
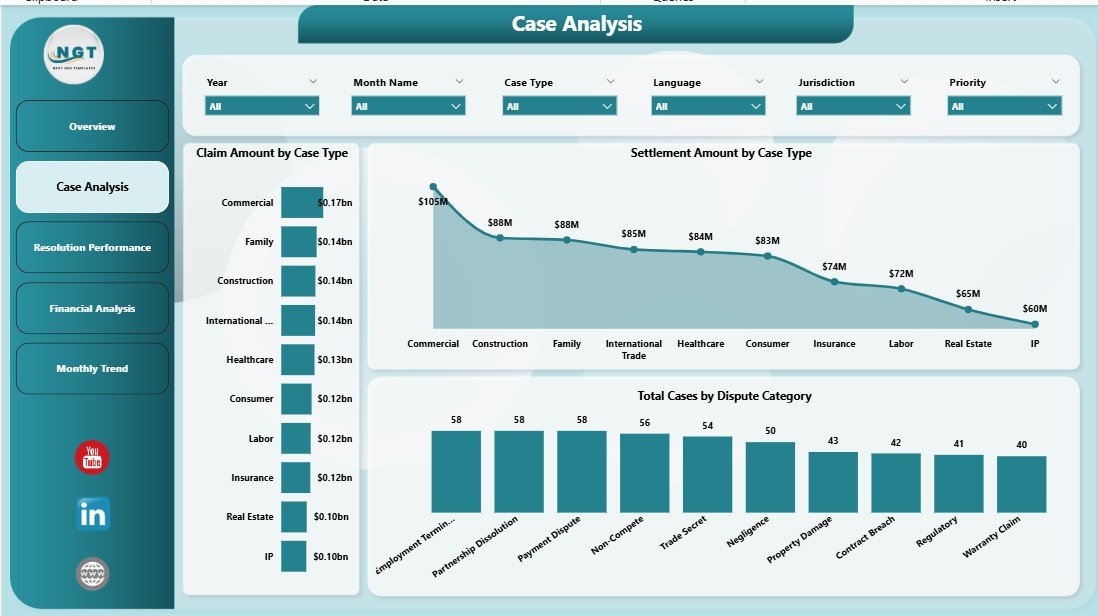
📂 Case Analysis Page
The Case Analysis Page focuses on evaluating dispute case structures and financial claims.
Charts included:
• Claim Amount by Case Type
• Settlement Amount by Case Type
• Total Cases by Dispute Category
These insights help organizations identify which types of disputes generate higher financial exposure.
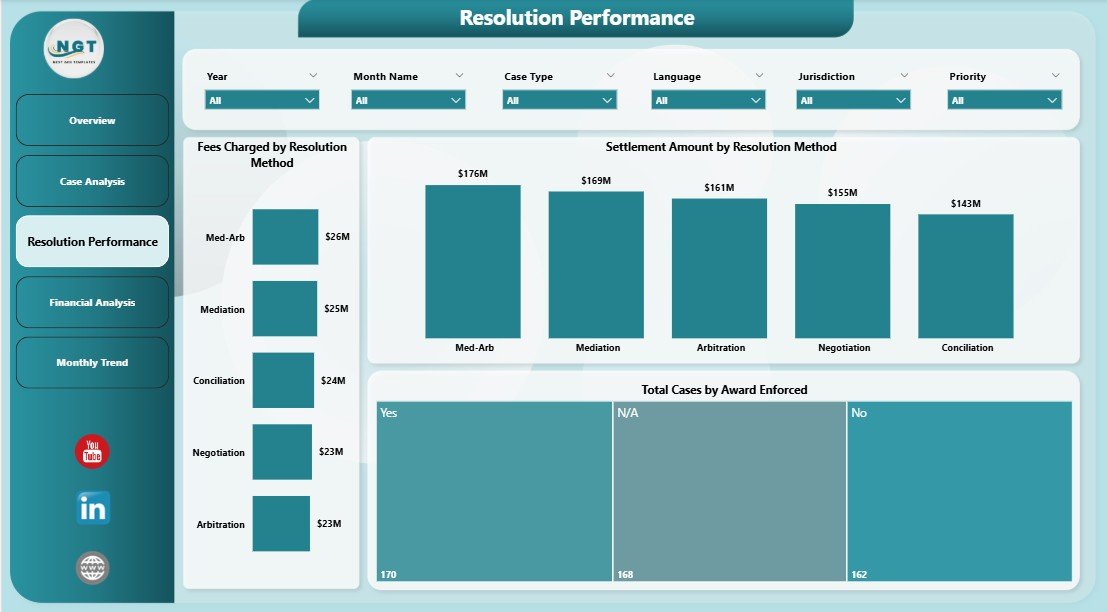
📈 Resolution Performance Page
This page analyzes how disputes are resolved through arbitration or mediation.
Charts included:
• Fees Charged by Resolution Method
• Settlement Amount by Resolution Method
• Total Cases by Award Enforced
This analysis helps organizations evaluate the effectiveness of different dispute resolution approaches.
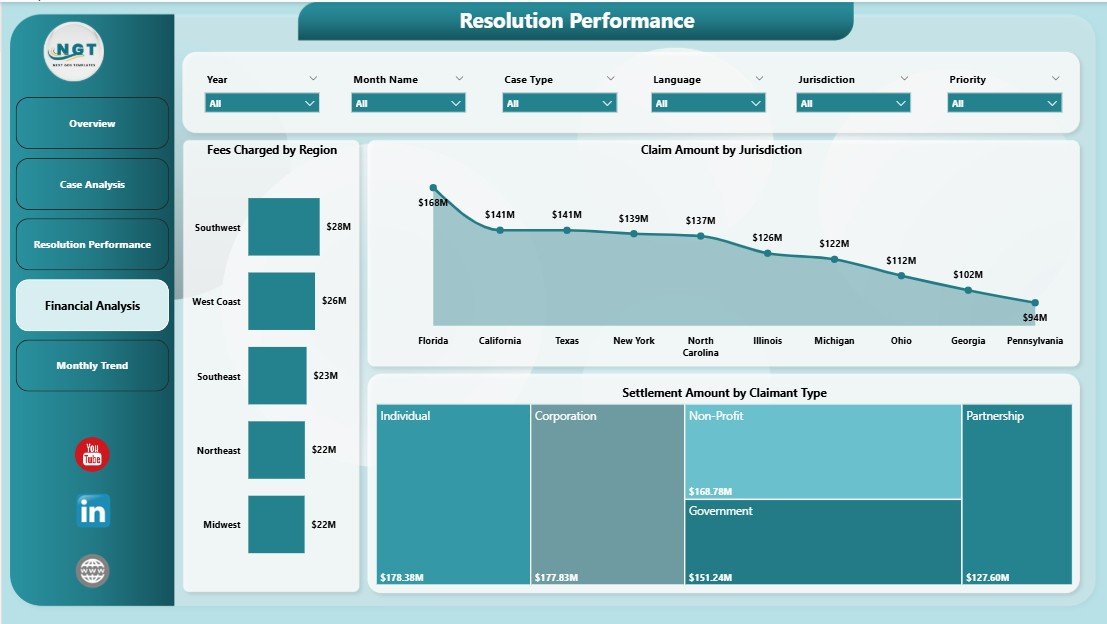
💰 Financial Analysis Page
Legal disputes often involve significant financial implications. Therefore, the Financial Analysis Page focuses on financial exposure.
Charts included:
• Fees Charged by Region
• Settlement Amount by Claimant Type
• Claim Amount by Jurisdiction
These insights help legal teams understand regional dispute trends and financial risks.
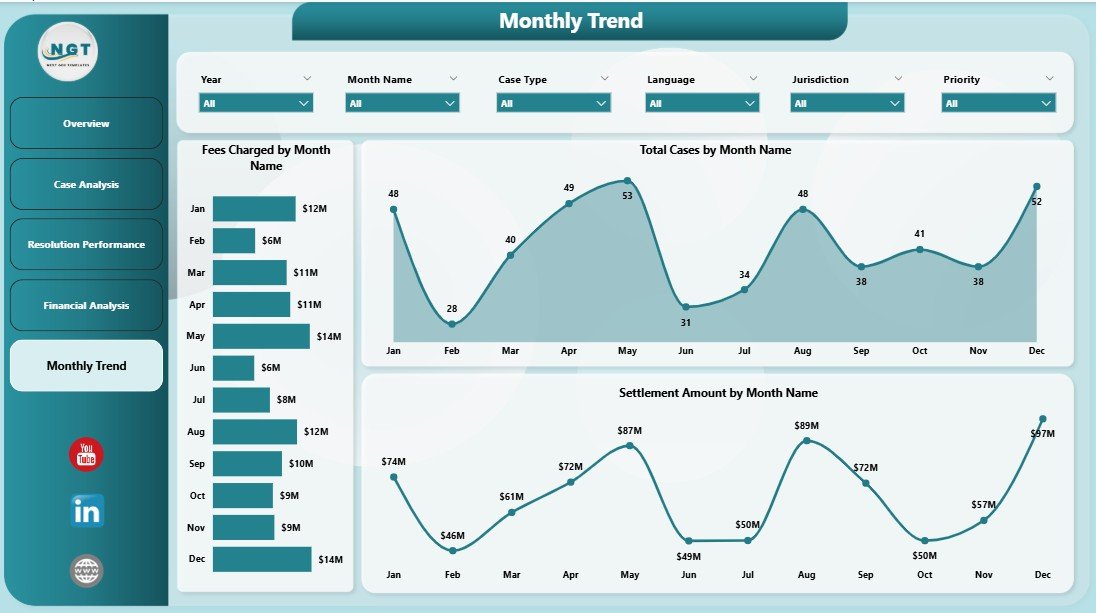
📅 Monthly Analysis Page
Dispute resolution activities often fluctuate over time. The Monthly Analysis Page tracks these trends.
Charts included:
• Fees Charged by Month
• Settlement Amount by Month
• Claim Amount by Month
This analysis helps organizations monitor dispute resolution workloads and financial trends over time.
⚙️ How to Use the Arbitration and Mediation Dashboard in Power BI
Using this dashboard is simple and efficient.
1️⃣ Import dispute resolution data into Power BI.
2️⃣ Ensure the dataset includes case ID, claim amount, settlement amount, case type, and resolution method.
3️⃣ Use slicers to filter dispute data dynamically.
4️⃣ Analyze case trends across different dashboard pages.
5️⃣ Refresh the dataset regularly to maintain accurate insights.
Within minutes, organizations can convert raw legal case data into meaningful analytics.
👥 Who Can Benefit from This Dashboard
This dashboard is useful for professionals involved in dispute resolution and legal analytics.
⚖️ Law Firms
🏢 Corporate Legal Departments
📑 Arbitration & Mediation Centers
📊 Compliance Teams
🏛 Government Legal Agencies
📈 Legal Data Analysts
Organizations using this dashboard gain better dispute visibility, improved legal decision-making, and enhanced risk management capabilities.
### Click hare to read the Detailed blog post
Visit our YouTube channel to learn step-by-step video tutorials
https://youtube.com/@PKAnExcelExpert