Artificial Intelligence research labs manage complex operations involving multiple projects, research teams, funding sources, departments, and global research locations. With so many variables influencing research outcomes, managers must constantly monitor project budgets, completion rates, research priorities, funding allocation, and performance targets.
However, when research institutions rely on scattered spreadsheets and manual reports, it becomes difficult to track research performance accurately. Decision-makers often struggle to analyze which projects are progressing well, which departments are performing effectively, and how research funds are being utilized.
This is where the AI Research Labs Dashboard in Excel becomes an extremely powerful solution.
The AI Research Labs Dashboard in Excel is a ready-to-use interactive Excel template designed to help research institutions monitor project performance, analyze funding distribution, evaluate departmental contributions, and track research productivity across regions.
Instead of reviewing multiple reports, this dashboard consolidates all research metrics into a single, easy-to-understand interface. With dynamic charts, KPI cards, pivot tables, and slicers, research leaders can instantly analyze research operations and make data-driven decisions.
Whether you manage an AI research institute, innovation lab, university research center, data science team, or technology organization, this dashboard provides the clarity needed to monitor research activities and optimize performance.
By transforming raw research data into meaningful visual insights, the dashboard helps organizations track progress, allocate resources effectively, and support strategic research planning.
🚀 Key Feature of AI Research Labs Dashboard in Excel
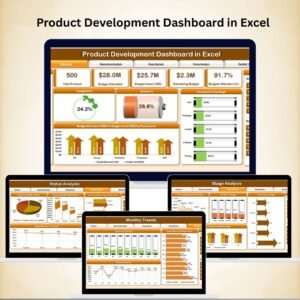
📊 Interactive Research Analytics Dashboard
Analyze research projects, budgets, and performance indicators through an intuitive Excel dashboard powered by pivot tables and charts.
📁 Multiple Analytical Pages
The dashboard contains several analytical pages that allow users to explore research performance from different perspectives.
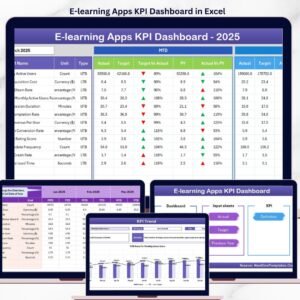
🎛 Dynamic Slicers for Data Filtering
Use slicers to filter research data by department, funding source, region, or project for deeper insights.
📈 Real-Time Research Performance Monitoring
Track project progress, completion rates, and research targets instantly as data updates.
💰 Research Budget Monitoring
Monitor project budgets and funding distribution across research projects and departments.
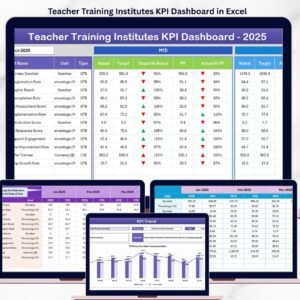
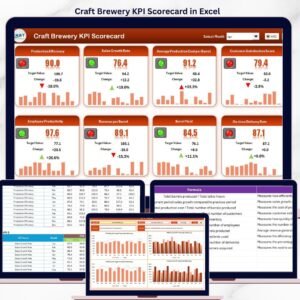
🎯 Target vs Actual Performance Tracking
Evaluate whether research projects are meeting expected targets and milestones.
⚡ High-Priority Project Identification
Quickly identify high-priority research projects that require special attention.
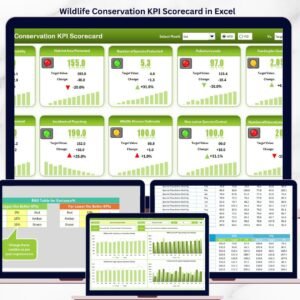
🌍 Regional Research Performance Analysis
Compare research productivity across different regions or research centers.
📊 Pivot Table Based Visual Charts
Powerful pivot charts automatically update when new research data is entered.
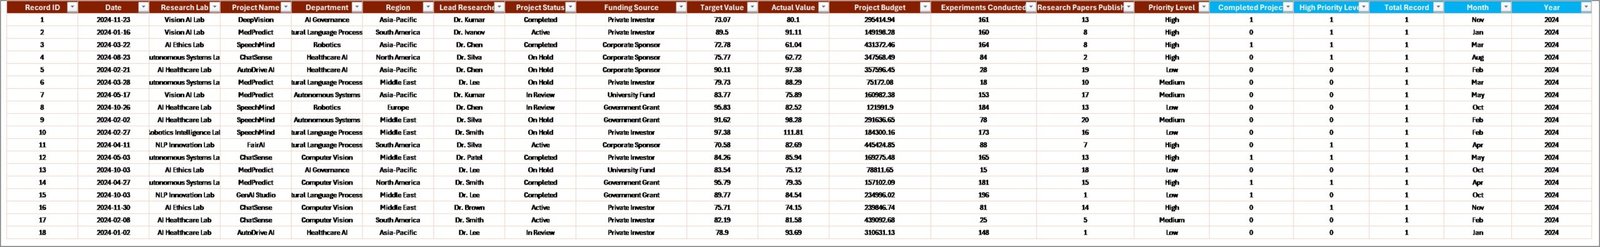
🧾 Simple Data Entry Structure
All research data can be entered easily in the main data sheet, ensuring smooth dashboard updates.
📊 What’s Inside the AI Research Labs Dashboard in Excel
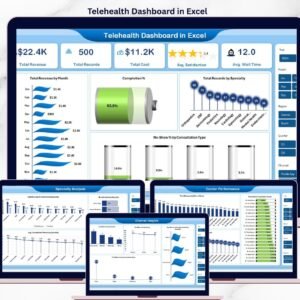
This Excel dashboard includes five interactive analytical pages that provide a complete overview of AI research performance.
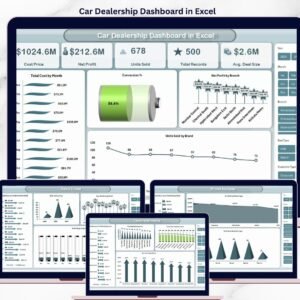
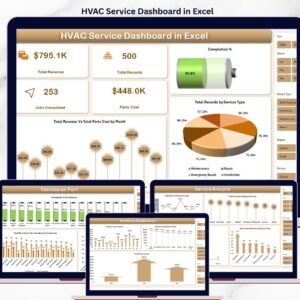
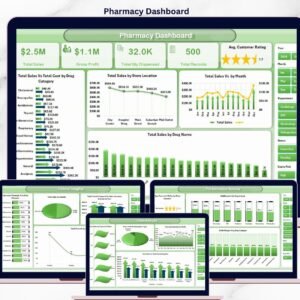
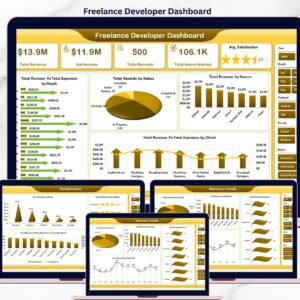
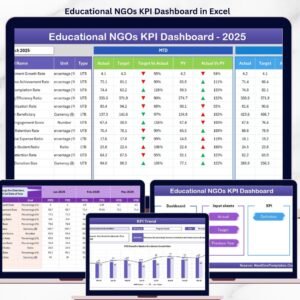
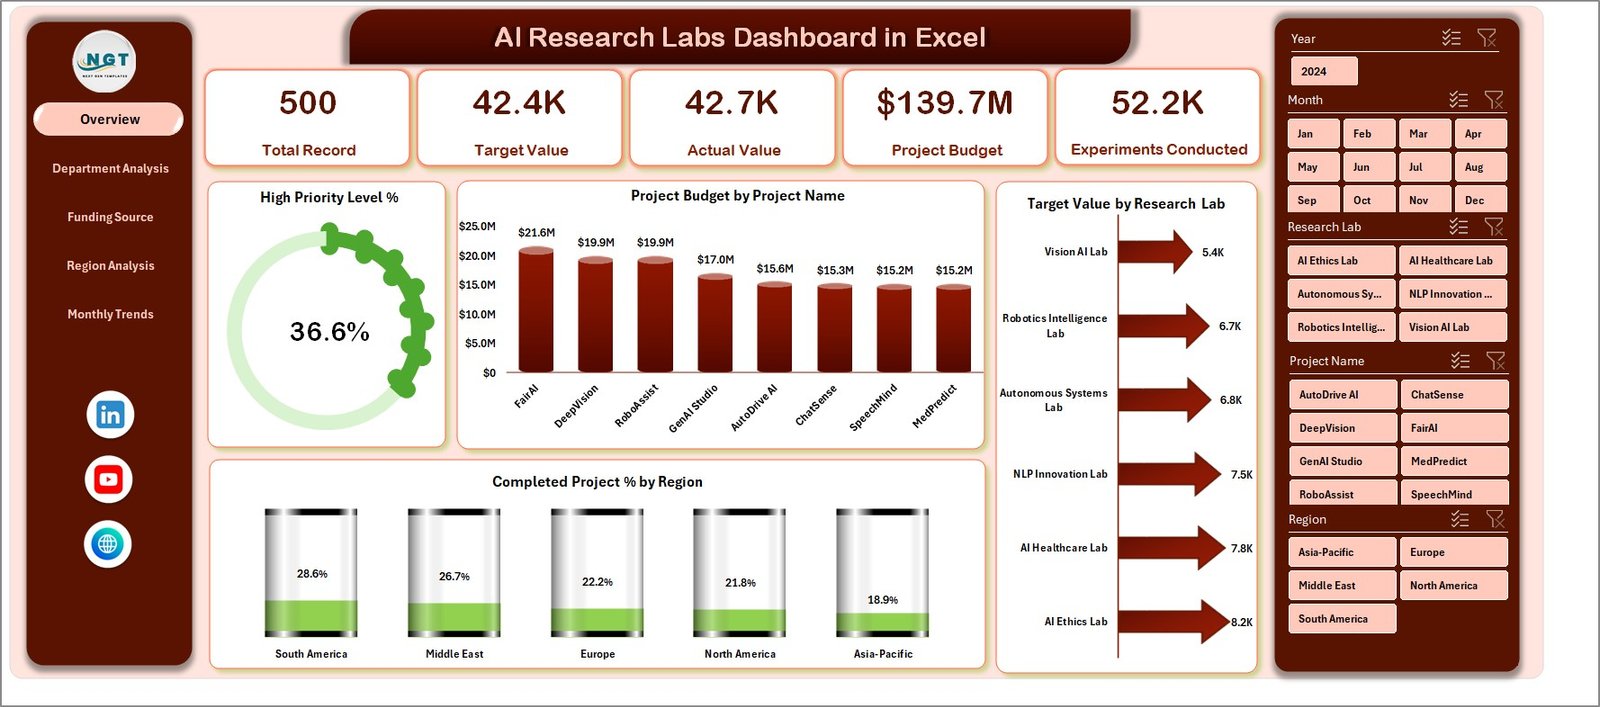
🏠 Overview Page – Research Performance Snapshot
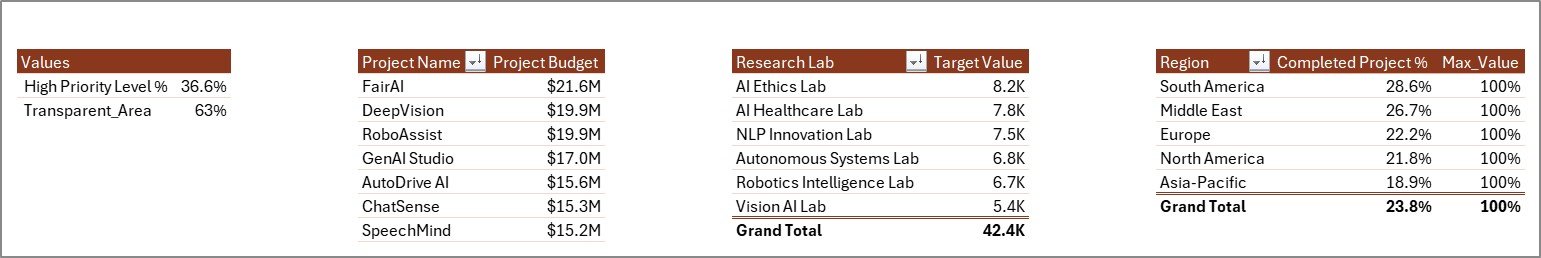
The Overview Page provides a high-level summary of research activities. It contains four KPI cards displaying key indicators such as:
• Project Budget
• Target Values
• High Priority Project %
• Completed Project %
In addition, four analytical charts provide insights such as project budgets by project name, target values by research lab, completed project percentage by region, and priority level distribution.
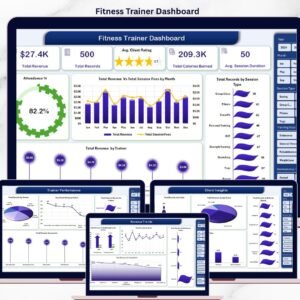
🏢 Department Analysis Page
This page analyzes research activities across departments such as Machine Learning, Robotics, Computer Vision, and Data Science. Charts on this page include:
• Project Budget by Department
• Target Value by Department
• Total Records by Department
• High Priority Level by Department
This analysis helps research leaders understand how departments contribute to overall research output.
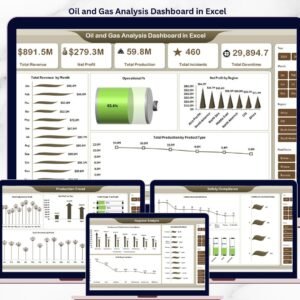
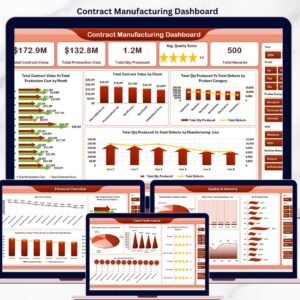
💰 Funding Source Analysis Page
Research projects often receive funding from multiple sources including government grants, private investors, corporate partnerships, and academic programs.
This page provides charts such as:
• Project Budget by Funding Source
• Target Value by Funding Source
• Total Records by Funding Source
• Completed Project % by Funding Source
This analysis helps organizations improve funding strategies and financial transparency.
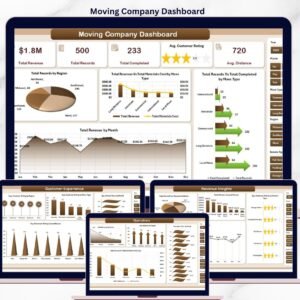
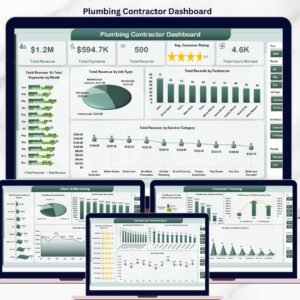
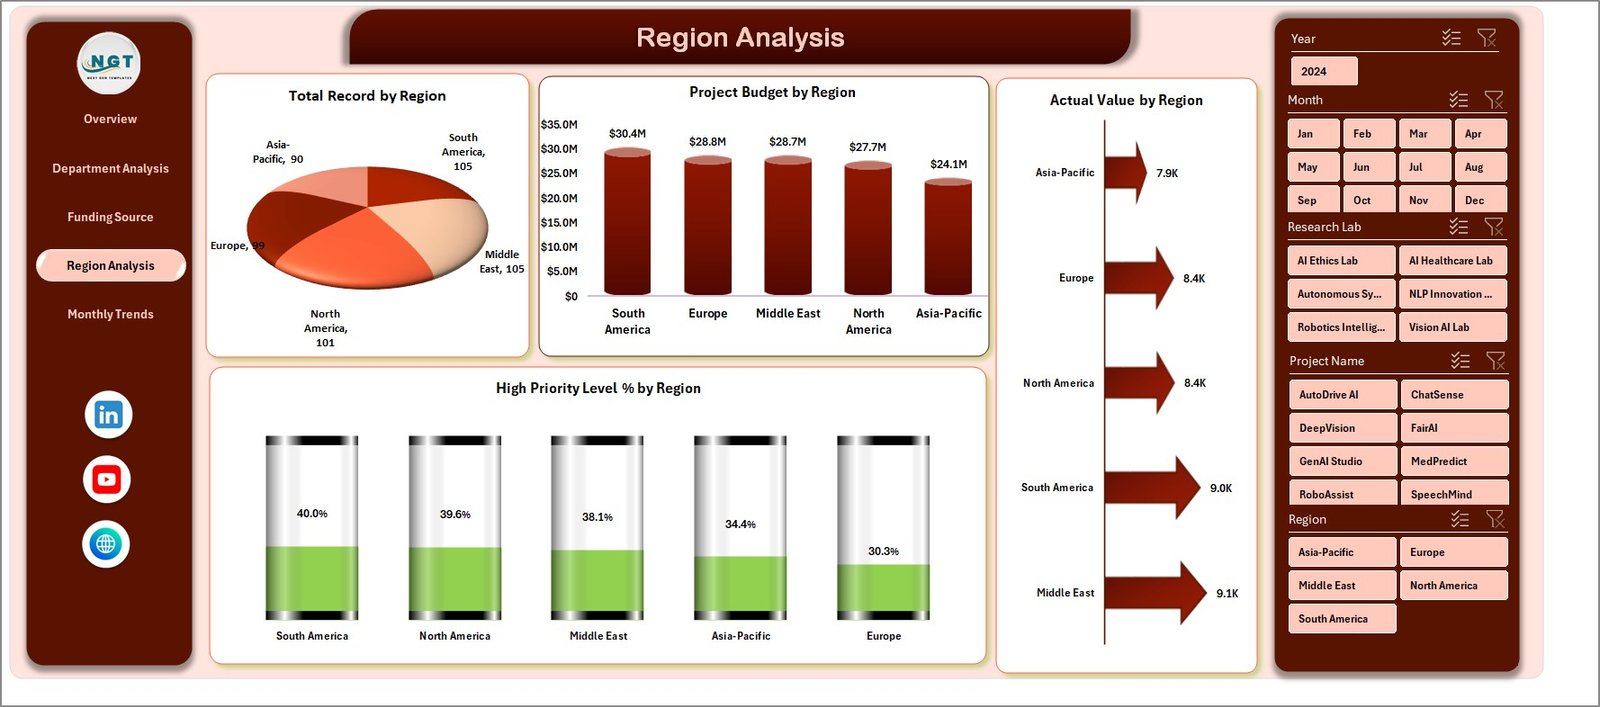
🌍 Region Analysis Page
Research organizations often operate across multiple regions or campuses. This page analyzes regional performance using charts such as:
• Project Budget by Region
• Total Records by Region
• Actual Value by Region
• High Priority Level % by Region
Managers can easily identify which regions produce the most successful research projects.
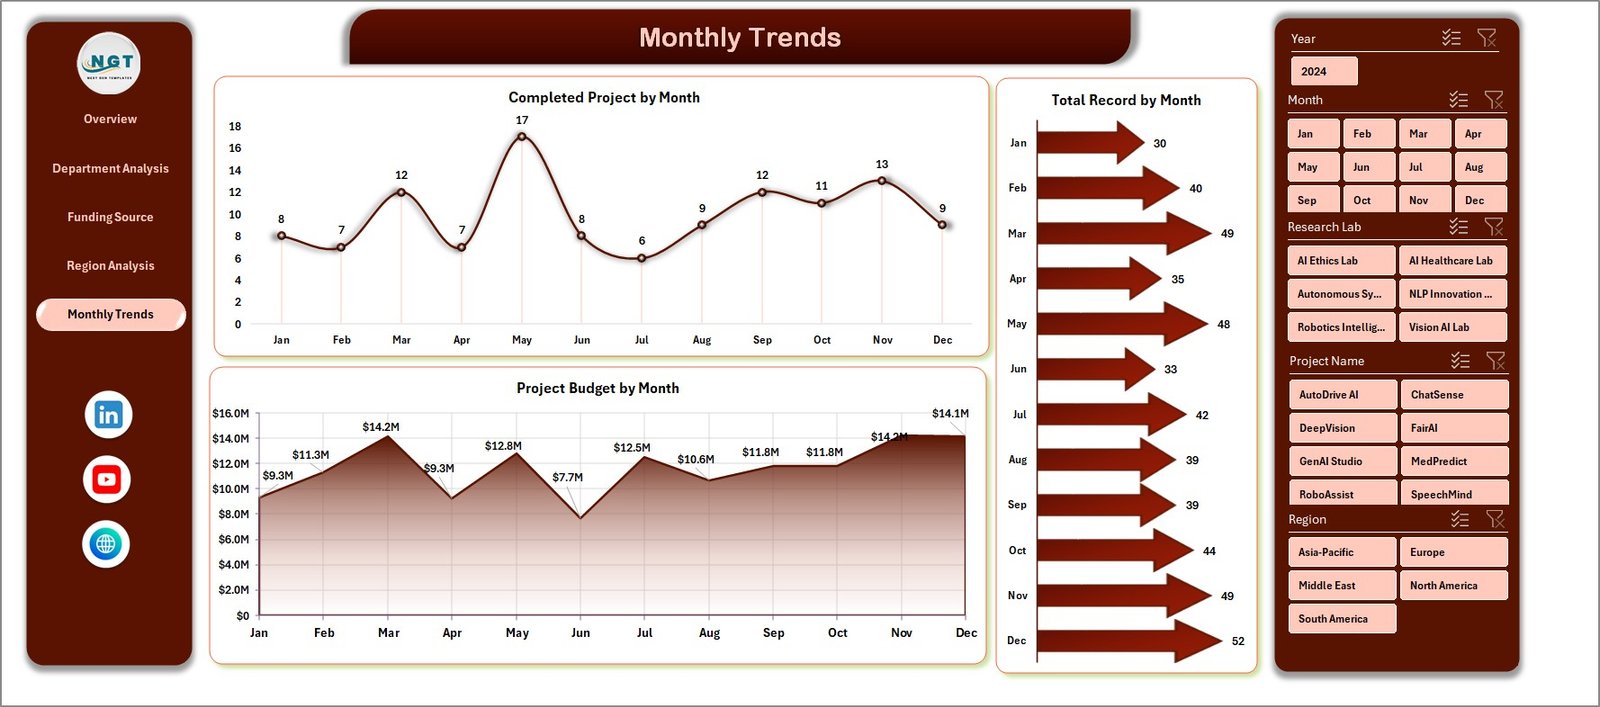
📅 Month Analysis Page
The Month Analysis page tracks research performance over time. Charts on this page include:
• Project Budget by Month
• Completed Projects by Month
• Total Records by Month
These insights help organizations identify seasonal trends in research productivity.
⚙️ How to Use the AI Research Labs Dashboard in Excel
Using this dashboard is simple and requires only basic Excel knowledge.
1️⃣ Enter research data in the Data Sheet including project name, department, region, funding source, and budget values.
2️⃣ Ensure the data is structured properly for pivot tables.
3️⃣ Refresh pivot tables to update charts and KPI indicators.
4️⃣ Use slicers to filter research data by department, region, or funding source.
5️⃣ Analyze charts across different dashboard pages to understand research performance.
With just a few steps, organizations can transform raw research data into powerful analytical insights.
👨💼 Who Can Benefit from This AI Research Labs Dashboard in Excel
This dashboard is ideal for organizations that manage research programs and innovation projects.
🏫 AI Research Institutes – Monitor multiple research projects and performance indicators.
🎓 Universities & Academic Research Centers – Track research funding and project progress.
🏢 Technology Companies – Evaluate innovation initiatives and R&D performance.
📊 Data Science Teams – Analyze research productivity across departments.
💼 Innovation Labs – Monitor project completion and research priorities.
📈 Research Managers & Analysts – Gain clear insights into research performance.
Organizations that implement this dashboard gain better research visibility, improved funding management, and stronger strategic decision-making capabilities.
Click hare to read the Detailed blog post
Visit our YouTube channel to learn step-by-step video tutorials
https://youtube.com/@PKAnExcelExpert