Tunnel construction projects demand accurate monitoring, strict safety control, and continuous performance tracking. Engineers and project managers must monitor dozens of operational metrics such as excavation progress, equipment utilization, safety indicators, and construction timelines. However, when teams rely on scattered spreadsheets and manual reporting, analyzing project performance becomes difficult and time-consuming.
That is why organizations increasingly rely on data-driven dashboards to monitor engineering performance. The Tunnel Engineering KPI Dashboard in Power BI provides a powerful solution for monitoring and analyzing key project indicators in a centralized and interactive environment.
This ready-to-use dashboard allows infrastructure authorities, construction companies, and engineering consultants to track tunnel engineering KPIs efficiently. Instead of reviewing multiple reports, decision-makers can analyze targets vs actual performance, KPI trends, and operational performance metrics in a single interactive dashboard.
With the help of Power BI’s dynamic visualizations and automated analytics capabilities, teams can quickly identify performance gaps, improve decision-making, and maintain better control over tunnel construction operations.
🚧 Key Features of Tunnel Engineering KPI Dashboard in Power BI
📊 Interactive KPI Monitoring Dashboard
Track all important tunnel engineering KPIs in a centralized Power BI dashboard designed for fast and intuitive performance analysis.
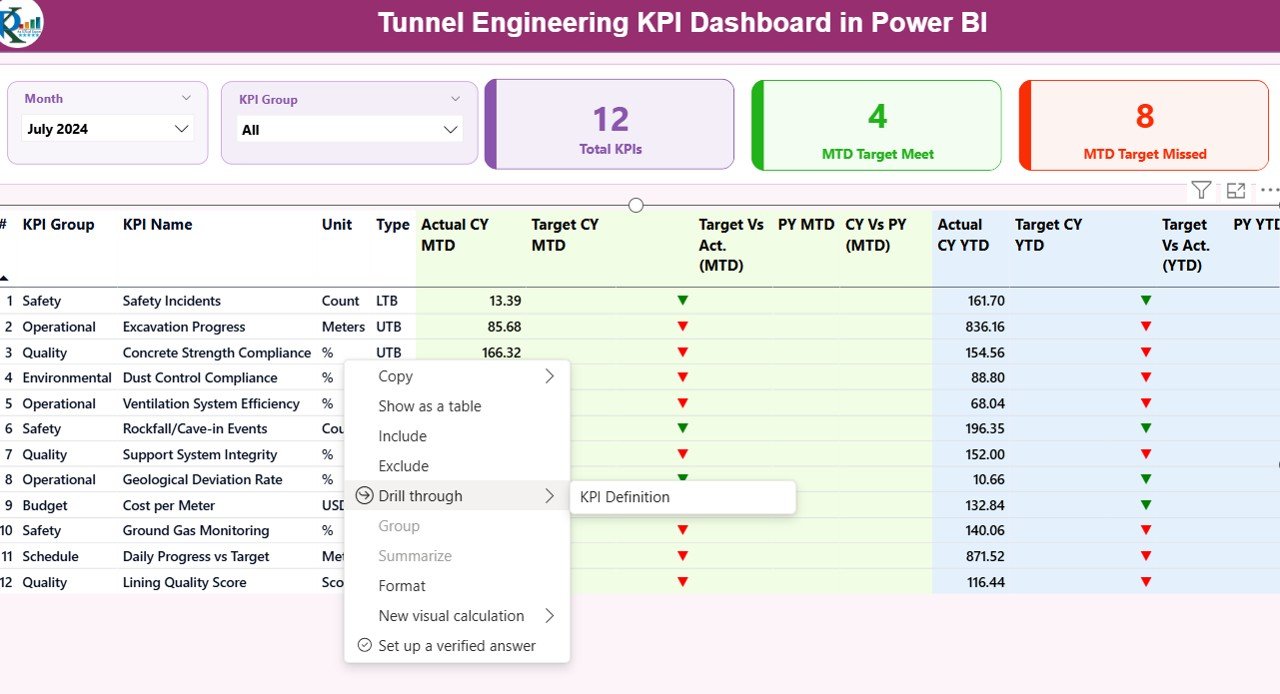
📅 Month & KPI Group Filters
Use interactive slicers to analyze KPI performance by specific months or KPI categories such as safety, productivity, or financial metrics.
📈 MTD & YTD Performance Tracking
Monitor both Month-To-Date and Year-To-Date KPI performance to understand short-term progress and long-term operational trends.
📉 Target vs Actual Performance Analysis
Quickly compare KPI targets with actual performance using visual indicators and percentage comparisons.
📌 KPI Status Indicators
Visual icons help managers identify whether KPIs are performing well or falling below target levels.
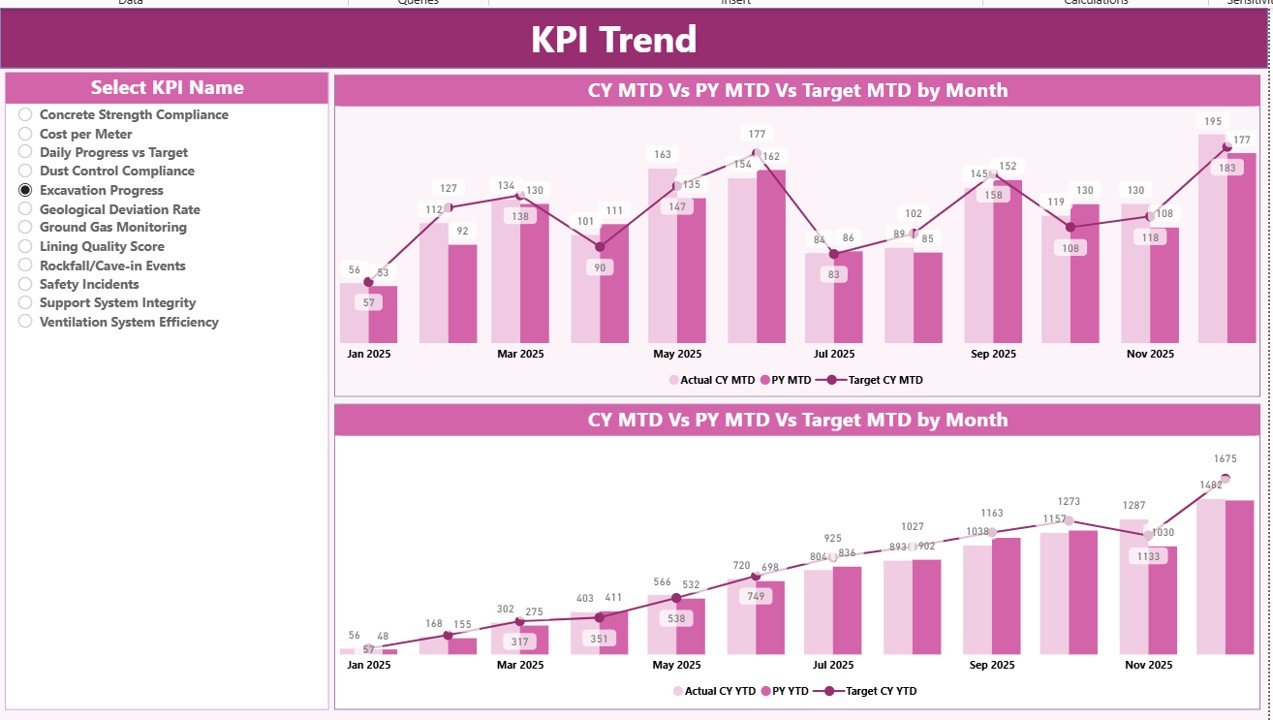
📊 KPI Trend Analysis Page
Analyze historical performance trends using dynamic combo charts that compare current year values, previous year performance, and targets.
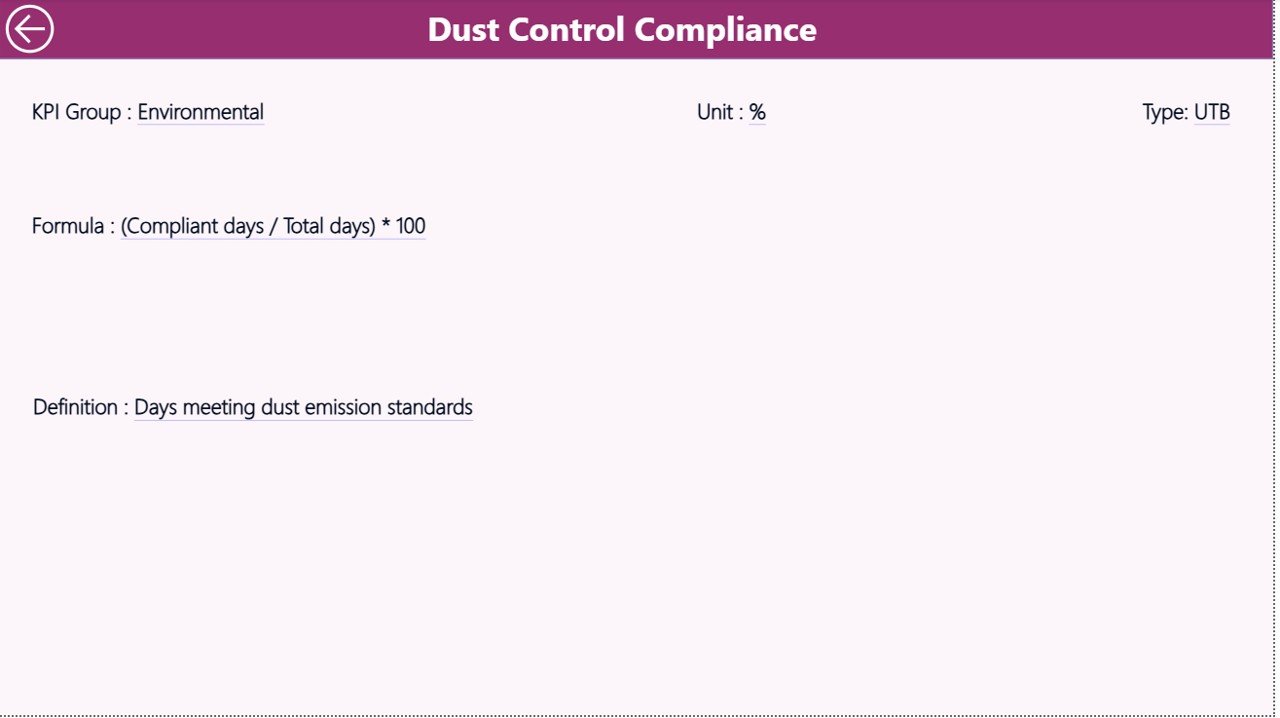
🔎 Drill-Through KPI Definition Page
Access detailed KPI information including formula, definition, unit, KPI type, and category through a drill-through feature.
⚡ Excel Integrated Data Source
The dashboard connects to an Excel data file that stores Actual Data, Target Data, and KPI Definitions, ensuring simple data management and easy updates.
📦 What’s Inside the Tunnel Engineering KPI Dashboard in Power BI
This digital product includes a fully designed and ready-to-use Power BI dashboard file along with an Excel data source for KPI management.
The dashboard contains three main analytical pages.
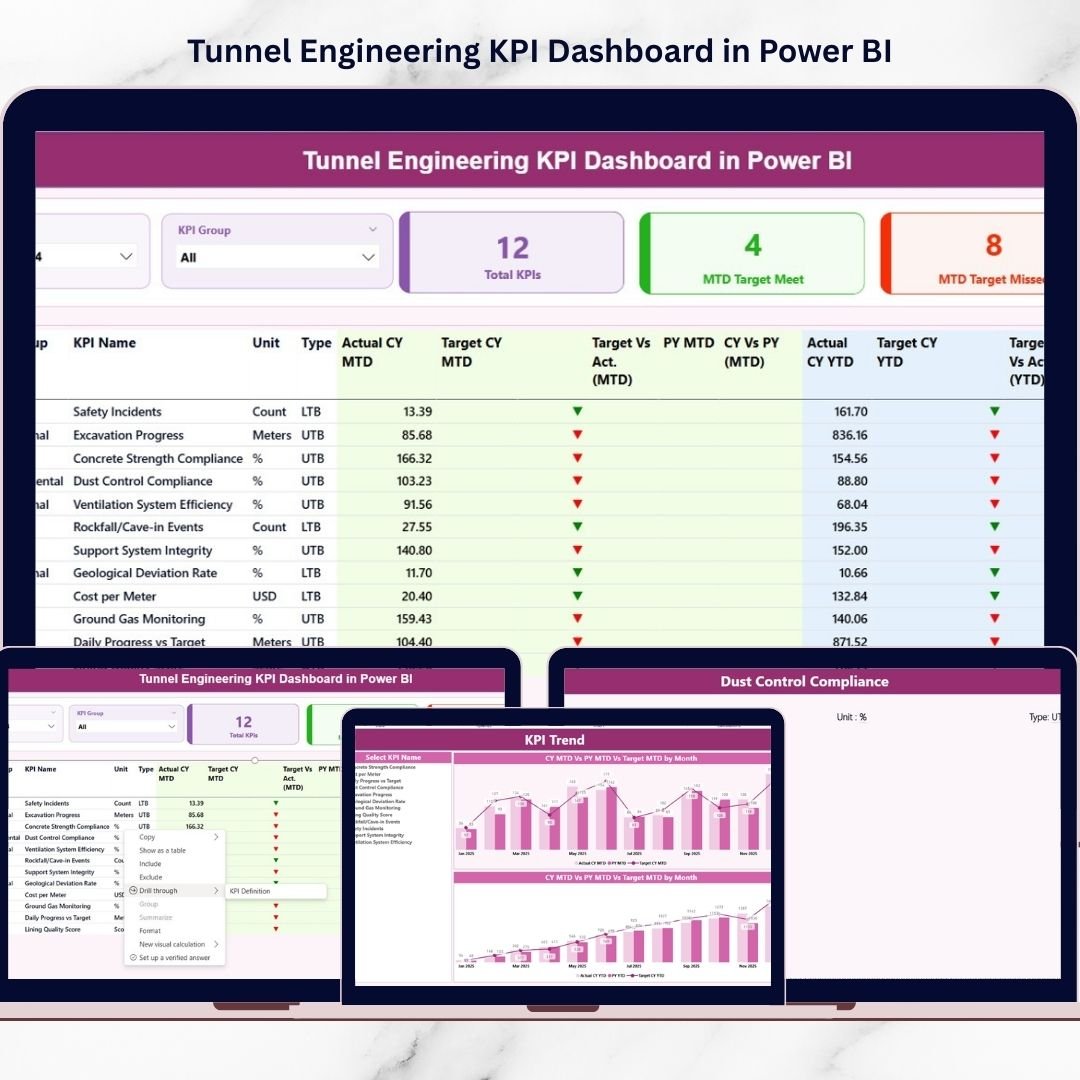
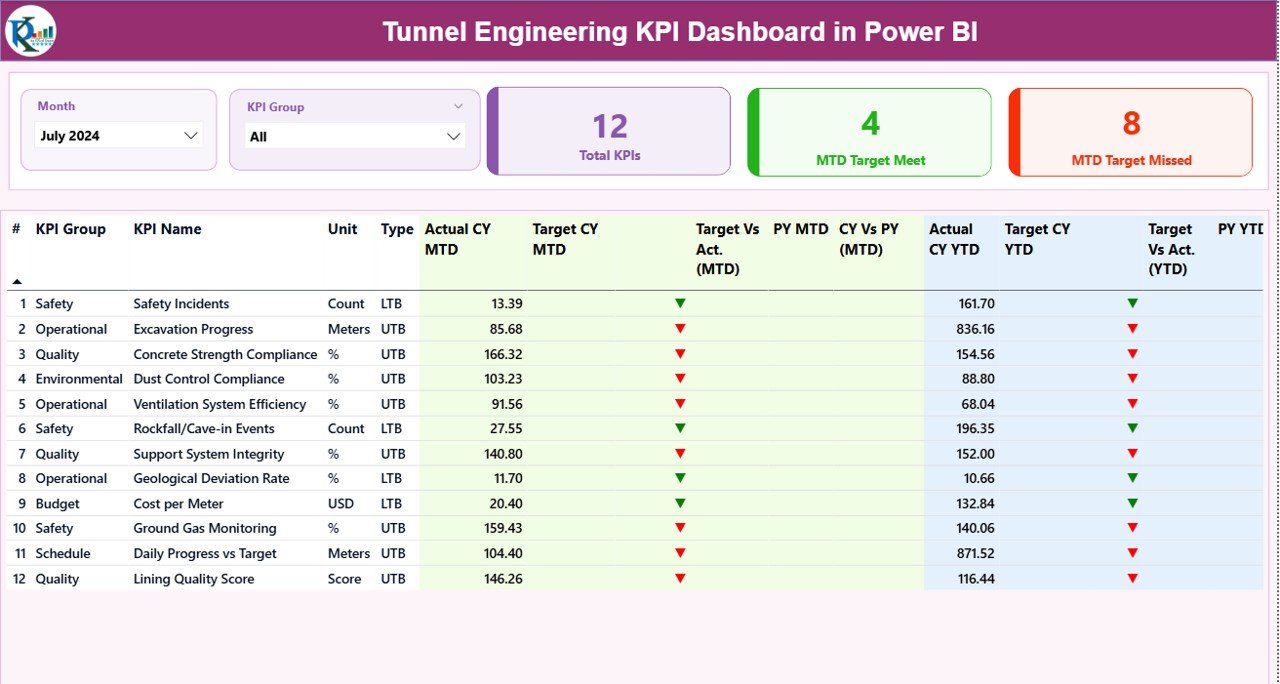
1️⃣ Summary Dashboard Page
The main dashboard provides a complete overview of tunnel engineering KPI performance. It includes KPI cards displaying the Total KPI Count, MTD Target Meet Count, and MTD Target Missed Count. A detailed KPI table shows performance metrics such as Actual vs Target values, Previous Year comparisons, and KPI status indicators.
2️⃣ KPI Trend Analysis Page
This page allows users to analyze KPI performance trends using dynamic combo charts. Users can select any KPI and visualize its MTD and YTD performance trends compared with targets and previous year results.
3️⃣ KPI Definition Page
This page contains detailed KPI documentation including formula, definition, measurement unit, and KPI type (LTB or UTB). It helps teams understand the calculation logic behind each KPI.
Additionally, the Excel data source contains three structured worksheets:
-
Input_Actual Sheet – Stores actual KPI performance values
-
Input_Target Sheet – Stores KPI target values
-
KPI Definition Sheet – Stores KPI master data and definitions
⚙️ How to Use the Tunnel Engineering KPI Dashboard in Power BI
Using this dashboard is simple and does not require advanced technical knowledge.
First, update the Excel input sheets with your organization’s KPI data. Enter the actual KPI performance values and target values for each month.
Next, open the Power BI dashboard file and connect it to the Excel data source.
Once the data is refreshed, the dashboard will automatically update all visualizations.
Users can then analyze performance using Month slicers, KPI filters, trend charts, and KPI comparison tables. The drill-through feature allows deeper exploration of KPI definitions when required.
By updating the Excel data regularly, organizations can maintain real-time performance monitoring for tunnel construction projects.
👷 Who Can Benefit from This Tunnel Engineering KPI Dashboard
This dashboard is designed for professionals involved in tunnel engineering and infrastructure development.
🏗 Infrastructure Authorities – Monitor large tunnel construction projects and ensure performance compliance.
🏢 Construction Companies – Track excavation progress, workforce productivity, equipment efficiency, and project timelines.
🧑💼 Project Managers – Monitor operational performance and identify potential delays before they impact project delivery.
📊 Engineering Consultants – Analyze construction performance and provide strategic recommendations.
⚠️ Safety Management Teams – Track safety KPIs and identify risk indicators to maintain safe working environments.
By using this dashboard, organizations can improve operational visibility, reduce reporting complexity, and make data-driven decisions faster.
Click here to read the Detailed blog post
Watch the step-by-step video tutorial: