Thrift Stores Dashboard—and for good reason. Customers love sustainable shopping, affordable pricing, recycled fashion, and treasure-hunt deals. But behind the scenes, thrift store operations are complex: donations come from different sources, item conditions vary, pricing changes daily, discounts impact profitability, and store performance differs by location and region.
Now here’s the honest problem: many thrift stores still run analytics with manual spreadsheets and disconnected reports. That means owners and managers waste time, miss trends, overstock slow-moving items, and react late to performance issues.
That’s why we created the Thrift Stores Dashboard in Excel 🛍️♻️📊
It’s a ready-to-use, interactive analytics tool that converts raw thrift store data into clean visuals and KPIs—so you can track revenue, quantity sold, product categories, item condition, discounts, customer ratings, donation sources, store locations, regions, and monthly trends from one centralized dashboard.
Instead of guessing what’s working, you’ll finally know:
-
Which sales channel brings the most revenue?
-
Which item conditions sell best (new vs gently used vs refurbished)?
-
Which donation sources drive higher customer ratings?
-
Which store location is winning—and which needs improvement?
-
Which regions respond well to discounts?
-
Which categories deserve more shelf space?
-
What’s happening month-by-month, and what should you plan next?
Excel makes it even better—because your team can start using it immediately without expensive BI software.
Key Feature of Thrift Stores Dashboard in Excel
🚀 Ready-to-use Excel dashboard built for thrift store performance tracking
🧭 Page Navigator on the left for smooth navigation across pages
🎛️ Right-side slicers to filter insights instantly (location, region, category, month, etc.)
📌 4 KPI summary cards for quick performance snapshot
💰 Revenue tracking by channel, location, region, and month
📦 Product category analytics to identify top-selling and slow-moving categories
🧺 Item condition analysis to optimize pricing and refurbishment decisions
🏷️ Discount analysis to measure promotion impact and protect profit
⭐ Customer rating insights by donation source, region, category, and condition
📅 Month trend tracking to understand seasonality and plan inventory proactively
📂 Data + Support sheets for structured input and automated visuals
What’s Inside the Thrift Stores Dashboard in Excel
This dashboard includes 5 analytical pages (plus support & data sheets), designed to cover every important thrift store performance angle:
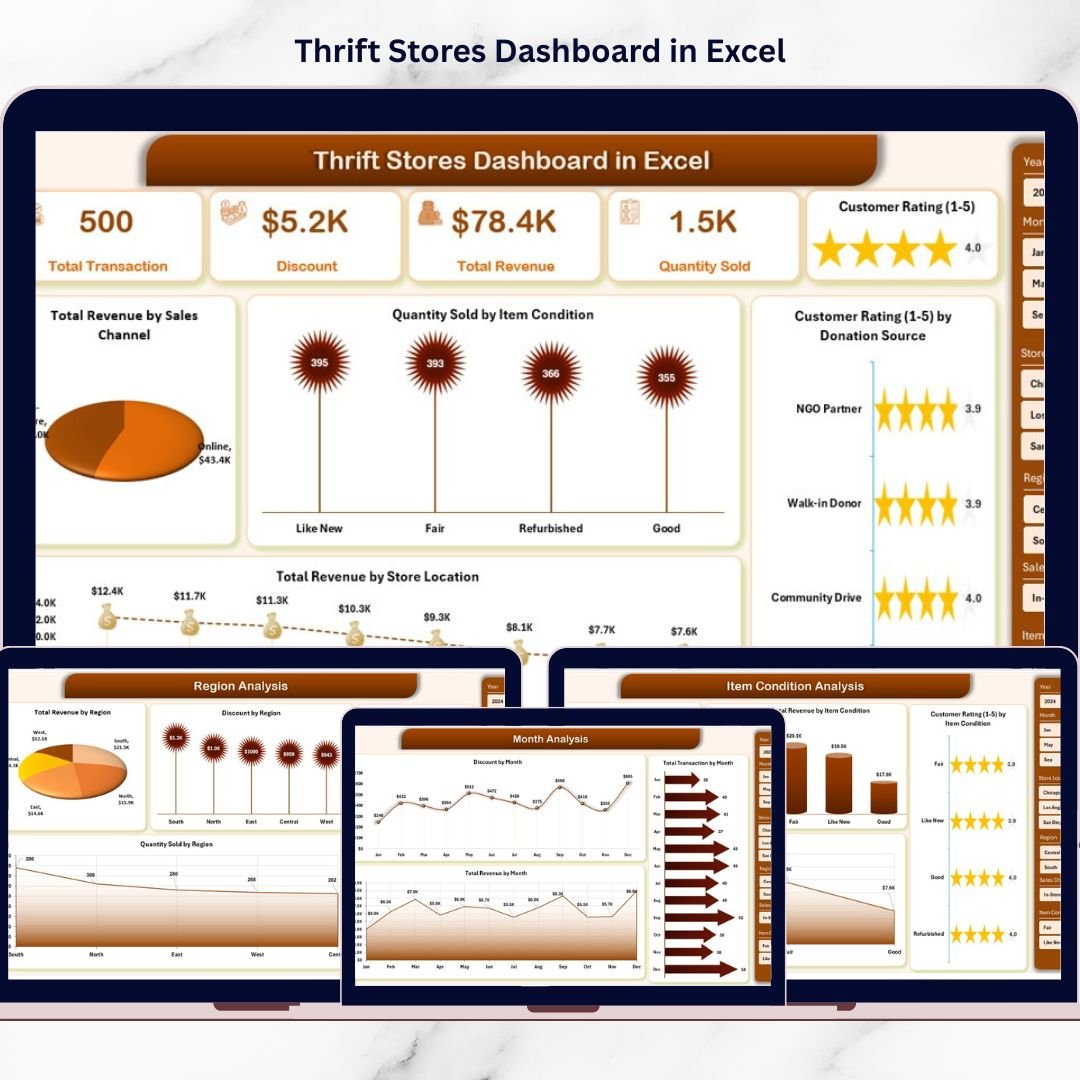
📌 1) Overview Page (Command Center)
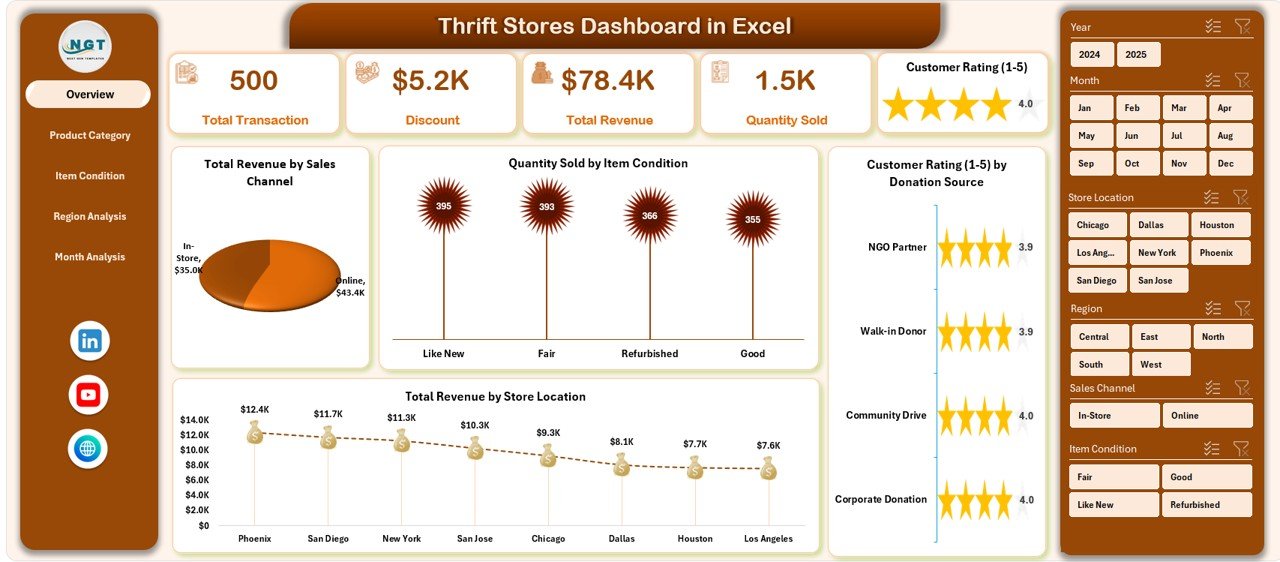
A quick snapshot of performance with slicers, KPI cards, and key charts:
-
Total Revenue by Sales Channel (online vs in-store vs others)
-
Quantity Sold by Item Condition (new, gently used, refurbished)
-
Customer Rating by Donation Source (donation quality insights)
-
Total Revenue by Store Location (branch comparison)
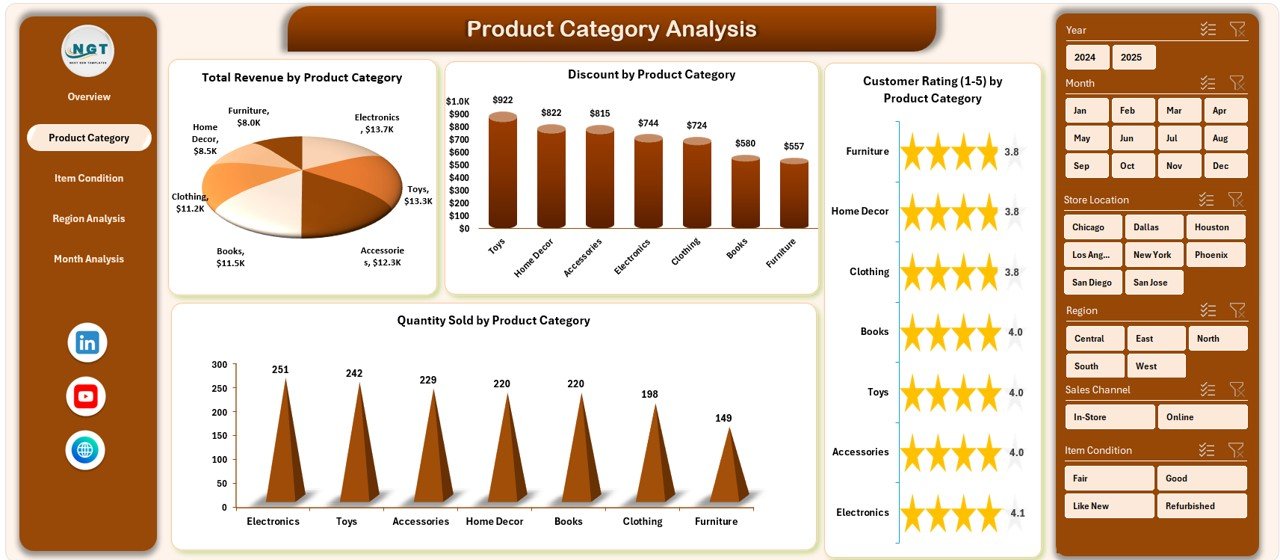
📦 2) Product Category Analysis
Track what sells and what stays on the shelf:
-
Total Revenue by Product Category
-
Quantity Sold by Product Category
-
Customer Rating by Donation Product Category
This page supports smarter donation acceptance and shelf space planning.
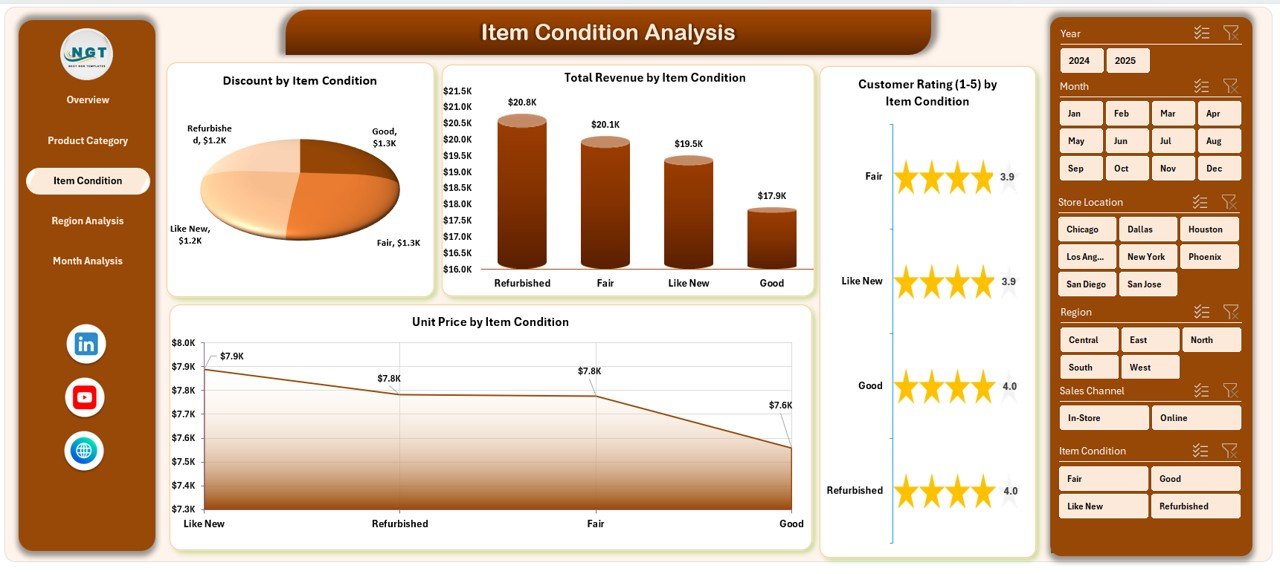
🧺 3) Item Condition Analysis
Because condition impacts price and satisfaction, this page reveals:
-
Total Revenue by Item Condition
-
Unit Price by Item Condition
-
Customer Rating by Donation Item Condition
Use it to decide whether refurbishment is worth it and how to price better.
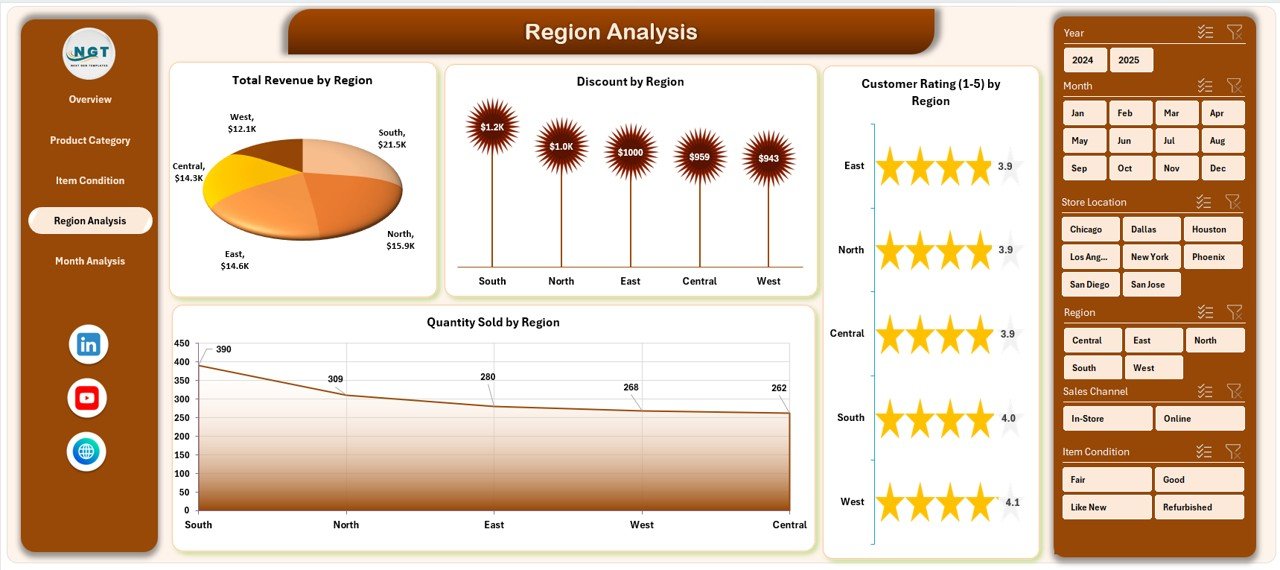
🌍 4) Region Analysis
Understand demand and promotion behavior by region:
-
Total Revenue by Region
-
Discount by Region
-
Customer Rating by Donation Region
This helps you allocate inventory strategically and avoid overstocking low-performing areas.
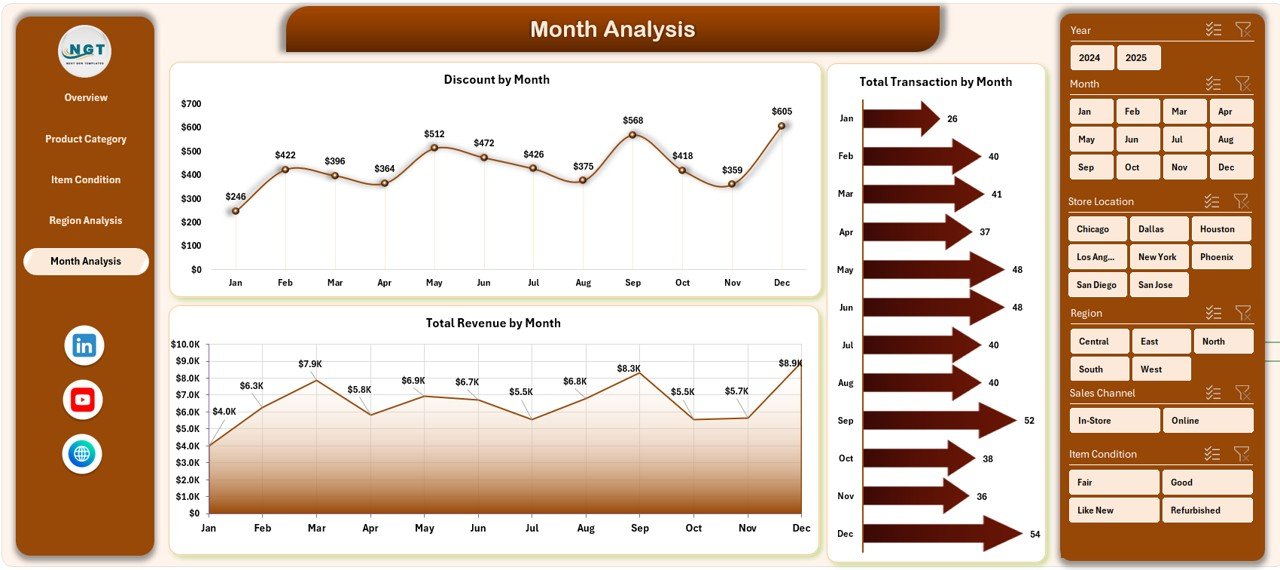
📅 5) Month Analysis
Track seasonality and plan ahead:
-
Total Revenue by Month
-
Discount by Month
-
Monthly revenue trends
Perfect for forecasting, staffing decisions, and promotional planning.
📂 Support + Data Sheets
-
Data Sheet: where you enter store transactions (location, category, condition, sales, discounts, ratings, donation source, etc.)
-
Support Sheet: backend calculations and helper structures to keep visuals automatic and smooth
How to Use the Thrift Stores Dashboard in Excel
Using the dashboard is simple:
1️⃣ Enter/update transactions in the Data Sheet
2️⃣ Refresh pivot tables (if required)
3️⃣ Use slicers to filter by location, region, category, condition, channel, and month
4️⃣ Navigate pages using the Page Navigator
5️⃣ Review KPIs and visuals to identify opportunities and fix issues fast
Who Can Benefit from This Thrift Stores Dashboard in Excel
This dashboard is ideal for:
🛍️ Thrift Store Owners
🏪 Store Managers & Supervisors
📦 Inventory & Operations Teams
📣 Marketing Teams (discount and campaign planning)
💰 Finance & Profitability Analysts
🌍 Regional Managers (multi-location stores)
📊 Retail Consultants
If you want faster decisions, better inventory control, and stronger profitability—this dashboard is built for you.
Click hare to read the Detailed blog post
Visit our YouTube channel to learn step-by-step video tutorials
Youtube.com/@PKAnExcelExpert


