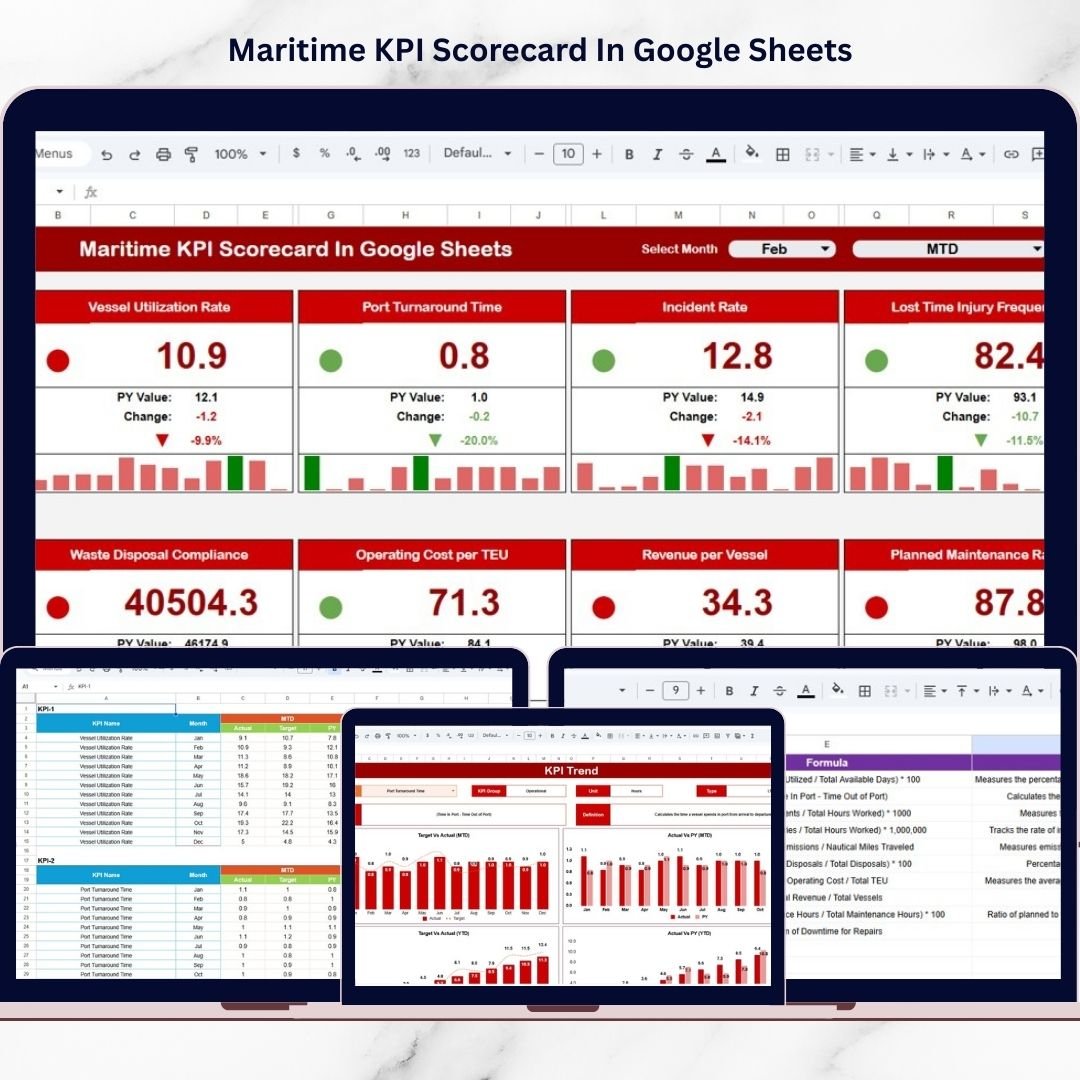
Managing maritime operations requires precision, efficiency, and constant performance monitoring. Shipping companies, port authorities, and maritime logistics providers handle complex activities daily — from vessel operations and fuel consumption to turnaround time, safety compliance, and operational costs. However, many organizations still depend on manual spreadsheets and fragmented reports, making performance evaluation slow and inefficient.
The Maritime KPI Scorecard in Google Sheets is designed to solve this challenge by providing a structured, automated, and easy-to-use performance monitoring system. Instead of spending hours compiling reports, organizations can instantly track operational performance using dynamic KPI analytics.
This ready-to-use scorecard transforms complex maritime data into clear visual insights using automated calculations, traffic light indicators, and interactive reporting. With Monthly-To-Date (MTD) and Year-To-Date (YTD) analysis, decision-makers gain complete visibility into both short-term performance and long-term operational trends.
Built on Google Sheets, the template allows real-time collaboration, cloud accessibility, and easy customization — making it ideal for modern maritime organizations seeking smarter performance management.
🚢 Key Feature of Maritime KPI Scorecard in Google Sheets
📊 Centralized KPI Monitoring
Track multiple maritime performance indicators within one structured dashboard.
📅 Dynamic Month Selection
Choose any reporting month from a dropdown, and all KPIs update automatically.
📈 MTD & YTD Performance Views
Analyze both monthly progress and yearly cumulative performance instantly.
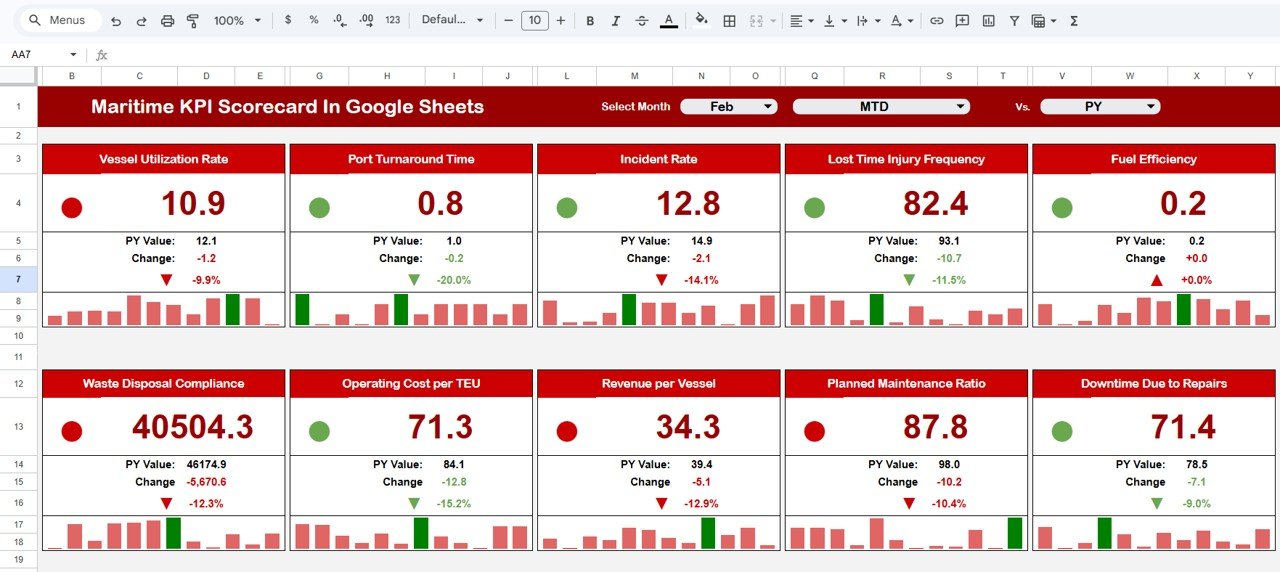
🚦 Traffic Light Performance Indicators
Green, Yellow, and Red signals clearly highlight KPI performance status.
🔁 Automatic Percentage Change Indicators
Up and down arrows show performance improvement or decline instantly.
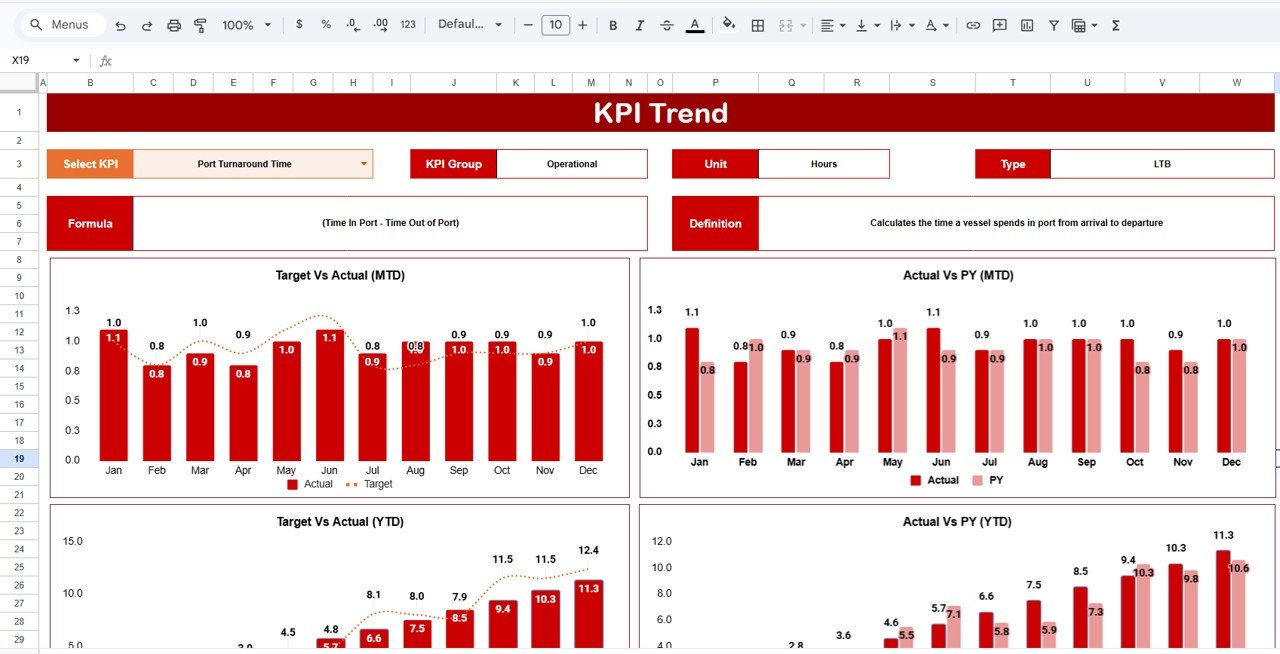
📉 Interactive KPI Trend Analysis
Dive deeper into individual KPI performance with detailed trend insights.
☁️ Cloud-Based Collaboration
Multiple users can access and update data simultaneously using Google Sheets.
⚙️ Customizable Performance Settings
Adjust KPI thresholds and visual indicators based on operational needs.
📦 What’s Inside the Maritime KPI Scorecard in Google Sheets
This professional template includes multiple structured worksheets designed for organized maritime performance tracking:
✅ Dashboard Sheet – Central KPI overview with traffic lights, comparisons, and performance indicators.
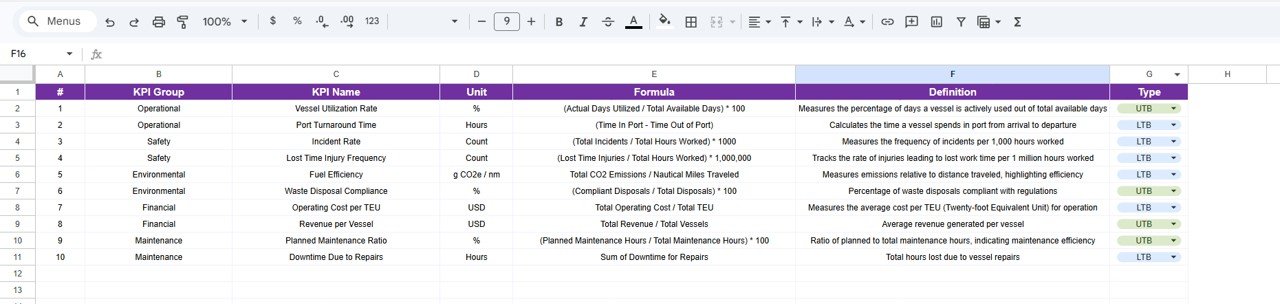
✅ Trend Sheet – Detailed KPI analysis including KPI group, unit, formula, and performance direction.
✅ KPI Definition Sheet – Documentation center for KPI structure and definitions.
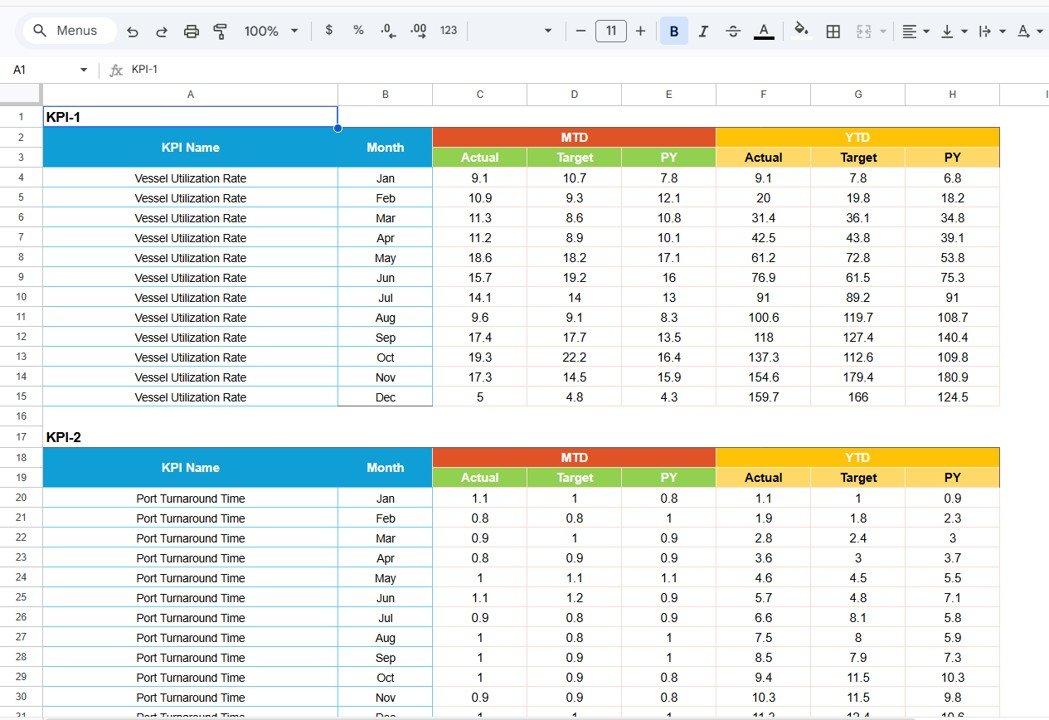
✅ Data Input Sheet – Simple interface for entering operational performance data.
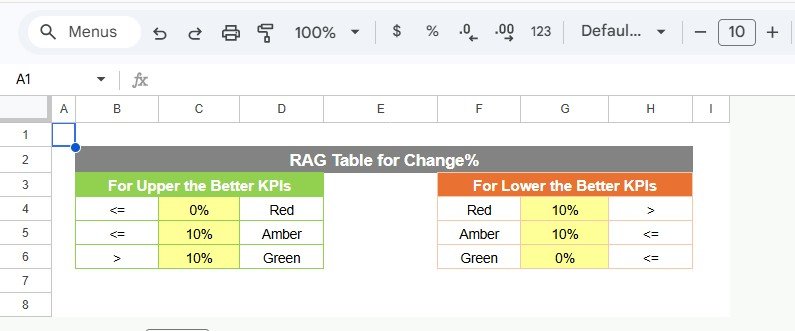
✅ Colour Settings Sheet – Configure traffic light rules and visual performance thresholds.
Each worksheet connects dynamically, ensuring automatic updates and seamless reporting.
🛠️ How to Use the Maritime KPI Scorecard in Google Sheets
Using this scorecard requires minimal setup:
1️⃣ Enter KPI definitions and performance targets.
2️⃣ Input monthly maritime operational data.
3️⃣ Select a reporting month from the dropdown.
4️⃣ Switch between MTD and YTD views for analysis.
5️⃣ Review automated indicators and performance insights instantly.
Because formulas and calculations are prebuilt, users only update data while the dashboard handles analysis automatically.
🎯 Who Can Benefit from This Maritime KPI Scorecard in Google Sheets
⚓ Shipping Companies – Monitor vessel performance and operational efficiency.
🏗️ Port Authorities – Track turnaround time and logistics performance.
🚚 Maritime Logistics Operators – Improve scheduling and cost management.
📊 Operations Managers – Identify inefficiencies and optimize workflows.
👨💼 Executives & Decision-Makers – Gain quick visibility into operational health.
📈 Performance Analysts – Analyze KPI trends for strategic planning.
Whether managing fleets, ports, or logistics networks, this scorecard helps organizations move from reactive reporting to proactive performance management.
Modern maritime operations demand fast insights and accurate monitoring. This KPI scorecard replaces manual reporting with automated analytics, helping teams identify bottlenecks, reduce costs, improve efficiency, and strengthen operational control.
Stop managing performance blindly — start tracking maritime success with a structured KPI system designed for real operational impact.
### Click here to read the Detailed blog post
Watch the step-by-step video tutorial:


