
Video marketing has become one of the most effective ways to attract audiences, build brand awareness, and drive conversions. Businesses publish videos across platforms such as YouTube, social media, and websites every day. However, creating content alone does not ensure success — performance must be measured consistently.
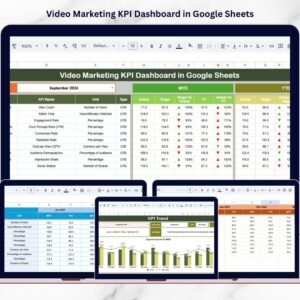
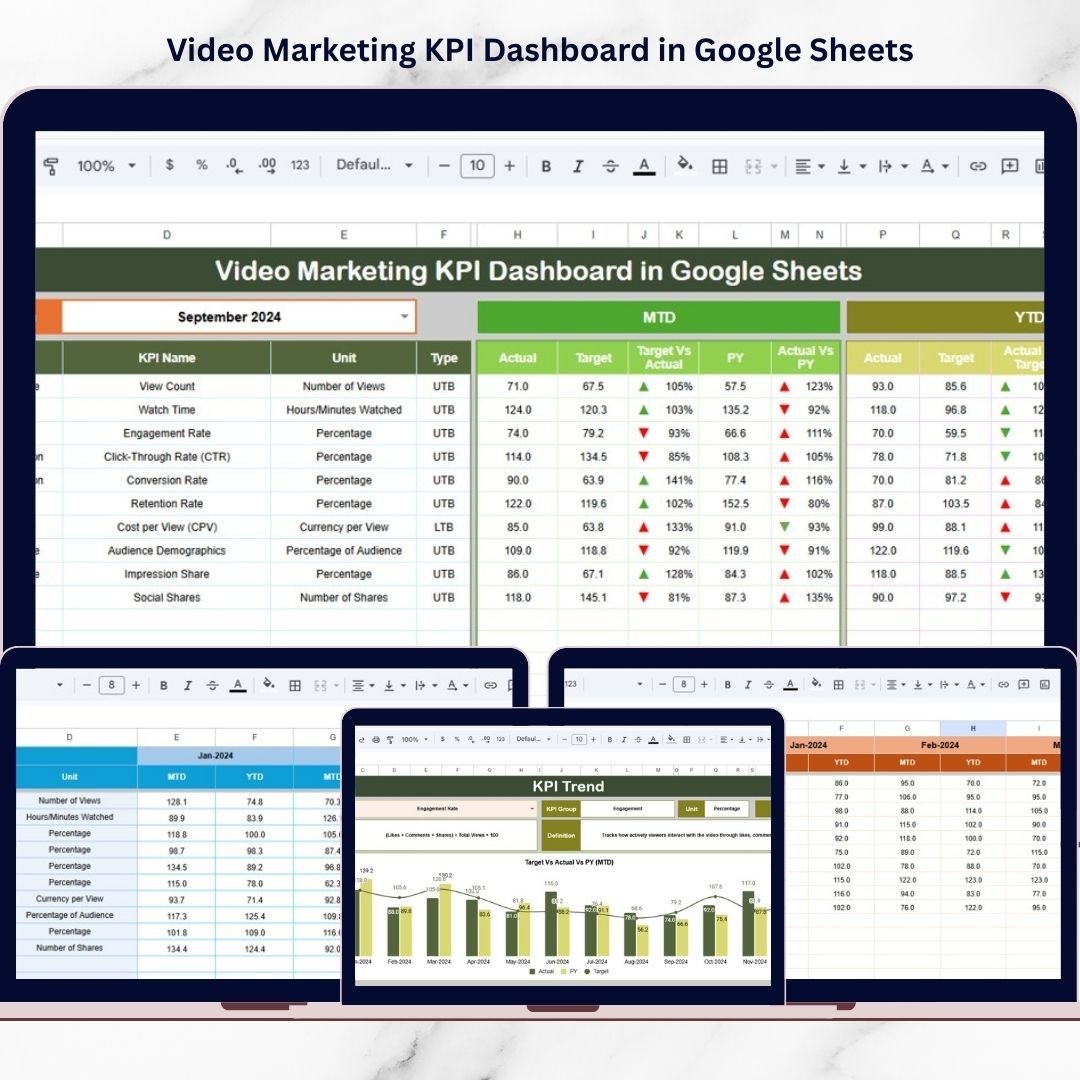
The Video Marketing KPI Dashboard in Google Sheets provides a structured and data-driven way to track video performance using clear KPIs, automated calculations, and visual analytics. Instead of managing scattered reports, marketing teams can monitor campaign performance from one centralized dashboard.
This ready-to-use solution helps marketers understand what works, optimize strategies, and improve ROI through measurable insights.
⭐ Key Features of Video Marketing KPI Dashboard in Google Sheets
📊 Centralized KPI Monitoring
Track all video marketing metrics in one organized dashboard.
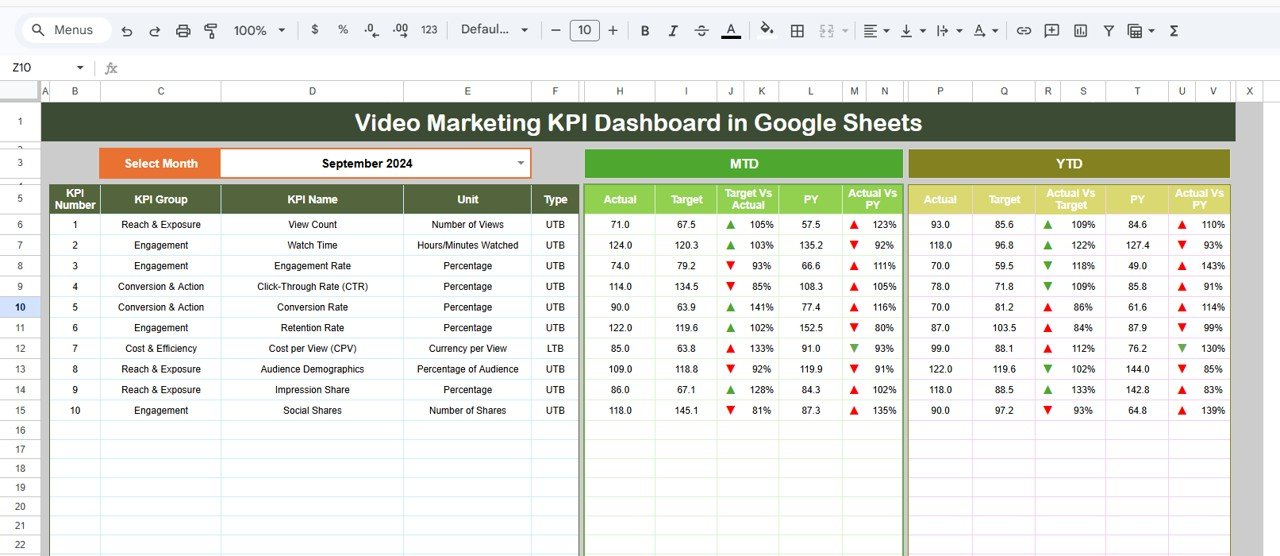
📅 Dynamic Month Selection
Select reporting month (Cell D3) and update the entire dashboard instantly.
📈 MTD & YTD Performance Analysis
Monitor short-term and long-term campaign performance.
🎯 Target vs Actual Comparison
Evaluate whether campaigns meet marketing goals.
🔄 Previous Year Comparison
Analyze year-over-year growth and seasonal performance.
📉 Visual Performance Indicators
Conditional formatting arrows instantly highlight improvement or decline.
🧩 Structured KPI Documentation
Clear KPI formulas and definitions for consistent reporting.
🤝 Real-Time Collaboration
Google Sheets enables team access from anywhere.
📂 Dashboard Structure (Worksheets Included)
The dashboard contains six structured sheets, each designed for a specific analytical purpose.
1️⃣ Dashboard Sheet – Main Performance Overview
The central control panel displaying:
MTD Actual vs Target vs Previous Year
YTD performance comparisons
KPI performance indicators
Automatic updates based on selected month
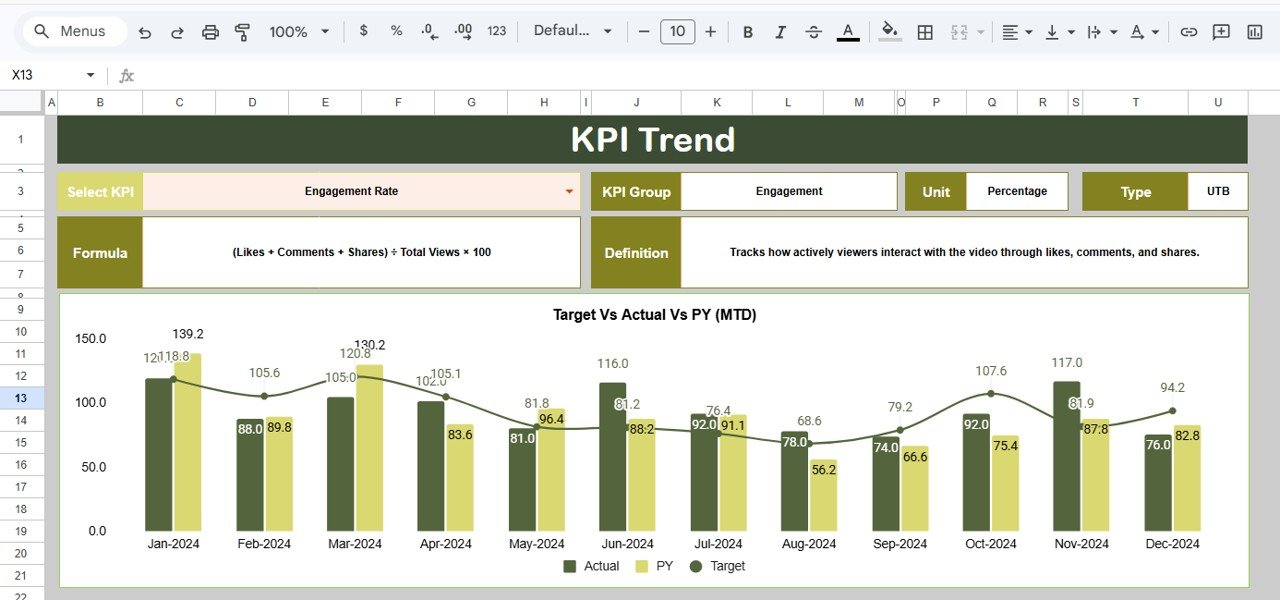
2️⃣ KPI Trend Sheet – Deep KPI Analysis
Select any KPI (Cell C3) to view:
KPI Group & Unit
KPI Type (LTB / UTB)
KPI Formula & Definition
Performance trends and comparisons
This ensures KPI transparency and measurement consistency.
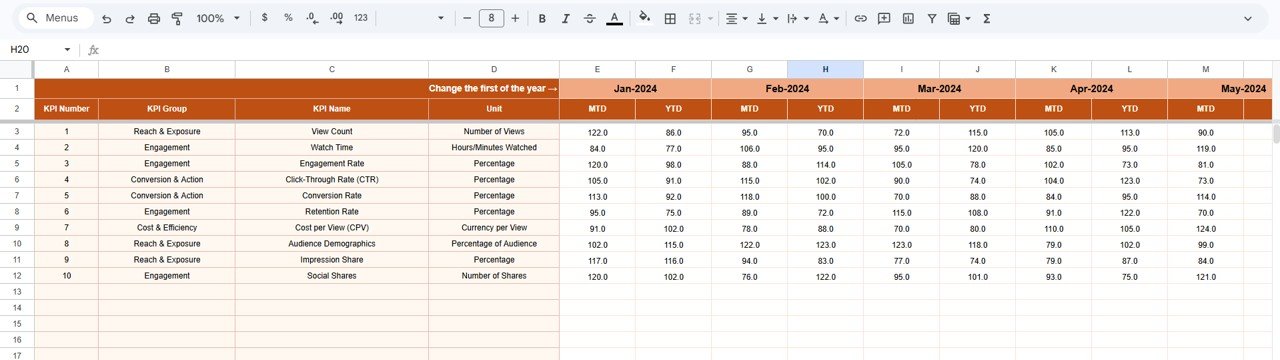
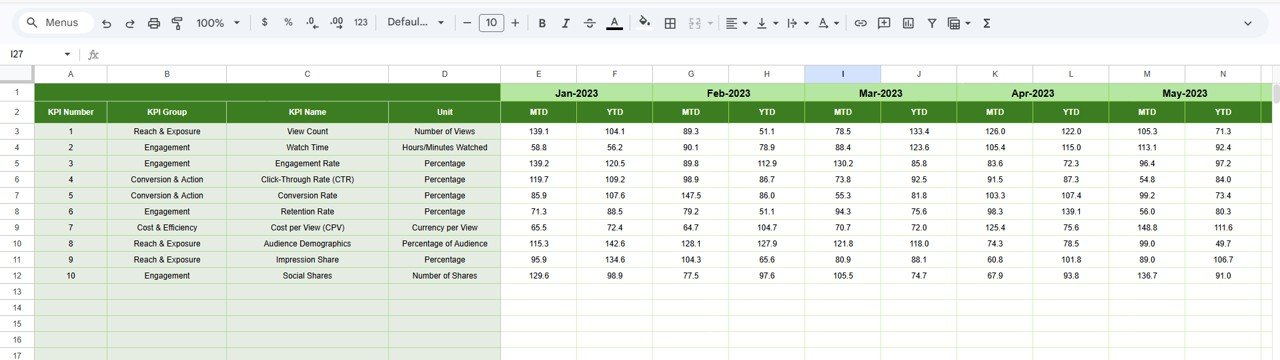
3️⃣ Actual Number Sheet – Data Entry Area
Users enter real campaign performance data:
MTD values
YTD values
Monthly performance inputs
Starting month selection (Cell E1)
Dashboard calculations refresh automatically.
4️⃣ Target Sheet – Marketing Goal Planning
Define performance expectations:
Monthly targets
MTD targets
YTD targets
Helps evaluate campaign success against objectives.
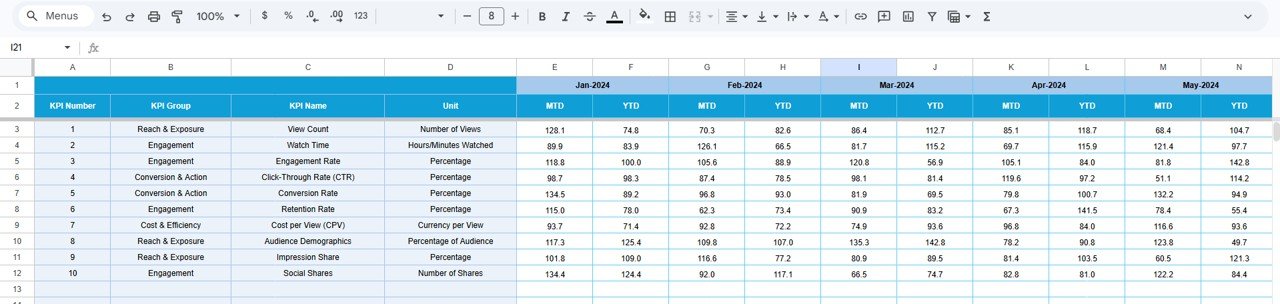
5️⃣ Previous Year Number Sheet – Historical Analysis
Stores past performance data to enable:
Year-over-year comparison
Growth measurement
Seasonal trend analysis
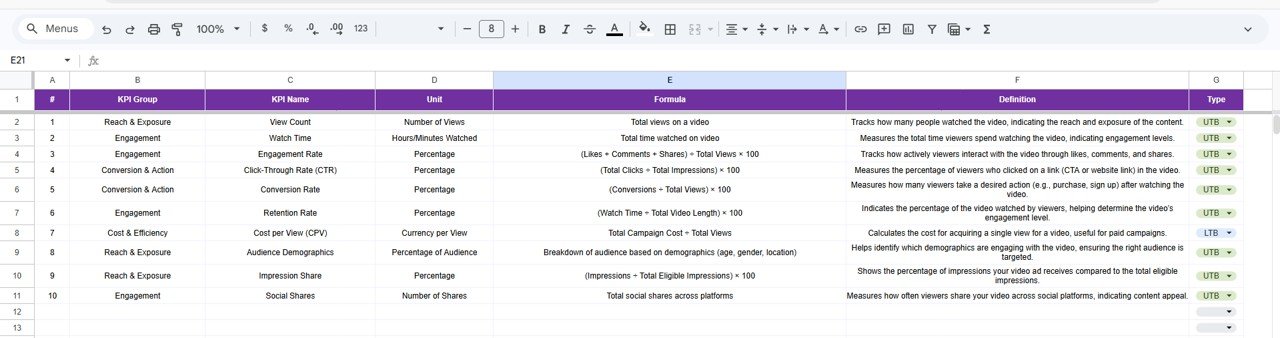
6️⃣ KPI Definition Sheet – KPI Knowledge Base
Central reference containing:
KPI Name
KPI Group
Unit
Formula
Definition
Ensures all team members interpret KPIs consistently.
📊 KPIs You Can Track
Typical video marketing KPIs include:
Video Views
Watch Time
Engagement Rate
Click-Through Rate (CTR)
Conversion Rate
Audience Retention
Subscriber Growth
Cost per View
Average Watch Duration
Social Shares
These metrics provide a complete performance picture.
🚀 How This Dashboard Improves Marketing Performance
✔ Faster campaign evaluation
✔ Better content strategy planning
✔ Improved ROI tracking
✔ Data-driven decision-making
✔ Performance transparency across teams
Because insights appear visually, marketers quickly identify winning strategies and optimization opportunities.
✅ Advantages of Using Google Sheets for KPI Tracking
Cloud-based access anywhere
Real-time collaboration
Automatic saving
Easy sharing with teams
Flexible customization
No expensive software required
Therefore, businesses of all sizes can implement advanced analytics easily.
👥 Who Should Use This Dashboard?
This dashboard is ideal for:
✅ Digital Marketing Teams
✅ YouTube Creators
✅ Social Media Managers
✅ Marketing Agencies
✅ Content Strategists
✅ Brand Managers
Any organization using video marketing can benefit from structured KPI tracking.
💡 Best Practices for Maximum Results
Update KPI data regularly
Track only goal-aligned metrics
Maintain consistent KPI definitions
Review trends monthly
Compare performance against targets
Keep data clean and standardized
Use insights to guide strategy decisions
🧩 Common Marketing Challenges Solved
❌ Fragmented analytics across platforms
❌ Manual reporting delays
❌ Lack of KPI clarity
❌ Weak campaign comparison
❌ Limited historical insights
✅ Solved through centralized analytics and automation.
🏁 Conclusion
The Video Marketing KPI Dashboard in Google Sheets transforms how businesses measure video performance. Instead of analyzing disconnected reports, teams gain a unified system that tracks KPIs, targets, trends, and historical performance in one place.
Because Google Sheets enables automation and collaboration, organizations can monitor campaigns efficiently, optimize content strategies, and achieve stronger engagement and ROI.
Ultimately, businesses that measure video marketing performance consistently grow faster and make smarter marketing decisions.
Click here to Read detailled blog post
📺 Visit our YouTube channel for step-by-step tutorials:
👉 https://Youtube.com/@NeotechNavigators