When you manage shelter support, food distribution, healthcare access, education enrollment, and livelihood programs — every number matters. Donors expect transparency. Leadership expects clarity. Refugees deserve measurable impact.
But if your team is still using scattered spreadsheets and manual reports, visibility disappears.
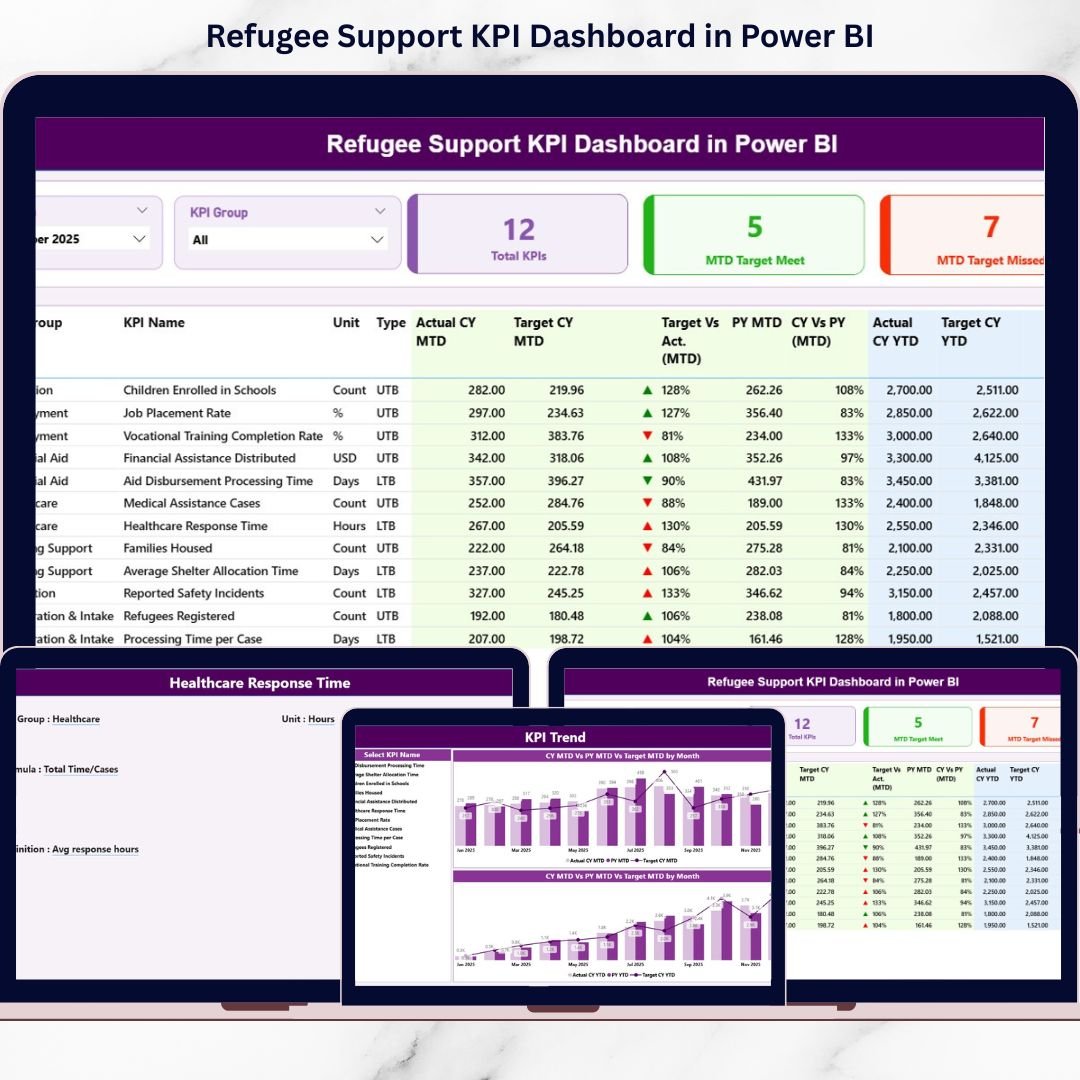
That’s why you need the Refugee Support KPI Dashboard in Power BI — a ready-to-use, interactive performance tracking system that transforms Excel data into powerful visuals.
Track MTD.
Monitor YTD.
Compare Target vs Actual.
Measure Year-over-Year growth.
All in one structured dashboard. 🌍📊
This is not just reporting.
This is impact intelligence.
🚀 Key Feature of Refugee Support KPI Dashboard in Power BI
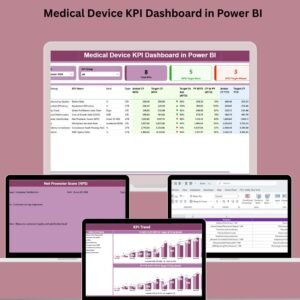
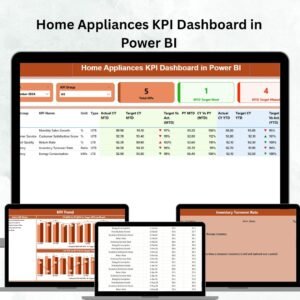
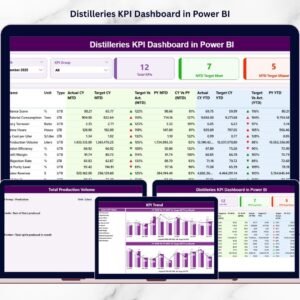
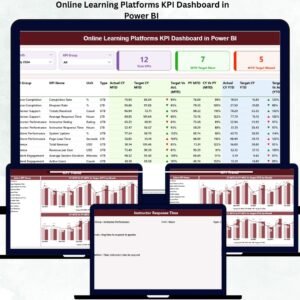
📊 Interactive Summary Page
View complete KPI performance snapshot in seconds.
🎯 Target vs Actual Comparison (MTD & YTD)
Instantly identify underperforming programs using visual indicators.
📈 Year-over-Year Analysis (CY vs PY)
Measure growth and long-term impact improvement.
🟢🔴 Performance Icons (UTB / LTB Logic)
Automatic green ▲ and red ▼ indicators remove confusion.
🧭 Dynamic Month & KPI Group Slicers
Filter by month or program category instantly.
📉 KPI Trend Analysis Page
Visualize MTD and YTD trends using combo charts.
📘 Drill-Through KPI Definition Page
Access formula, definition, and measurement logic instantly.
📂 Excel-Based Data Input
Simple Excel sheets connect directly to Power BI.
⚡ Scalable KPI Structure
Add more KPIs without redesigning the entire dashboard.
📦 What’s Inside the Refugee Support KPI Dashboard in Power BI
This solution includes 3 powerful Power BI pages:
1️⃣ Summary Page – The Command Center
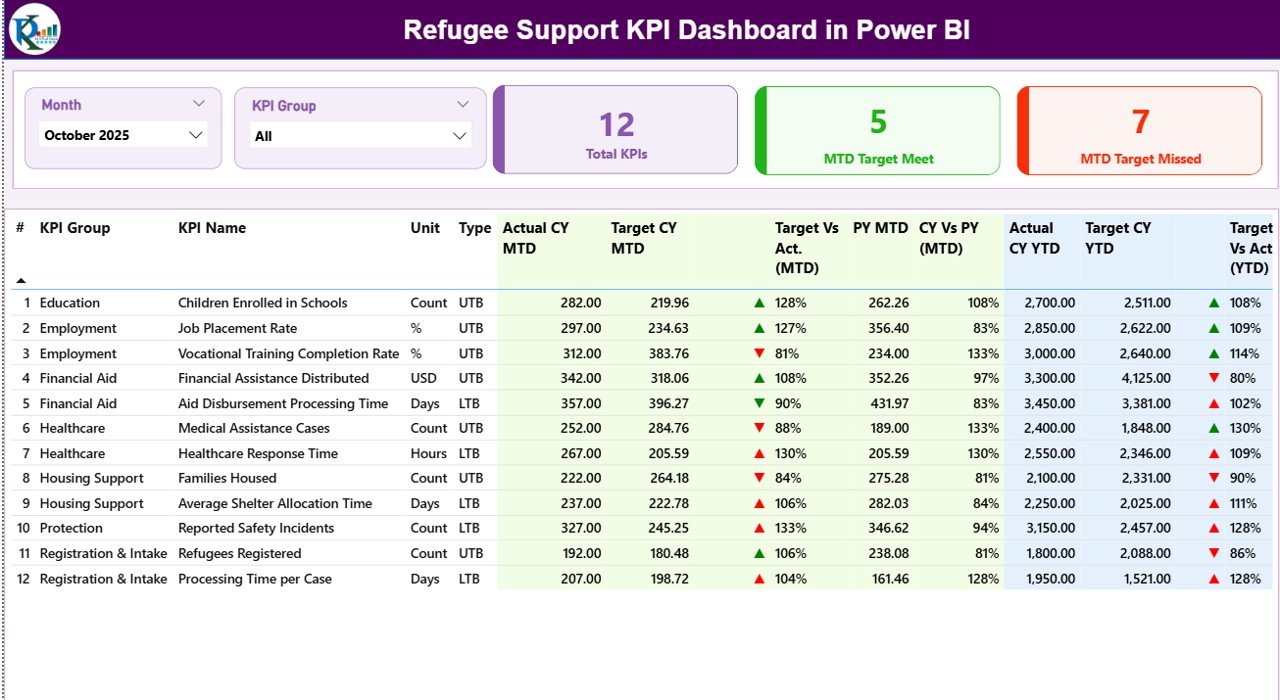
✔ Month slicer
✔ KPI Group slicer
✔ KPI Cards:
-
Total KPIs Count
-
MTD Target Meet Count
-
MTD Target Missed Count
✔ Detailed KPI Table including:
-
KPI Number
-
KPI Group
-
KPI Name
-
Unit
-
Type (UTB / LTB)
-
Actual CY MTD
-
Target CY MTD
-
PY MTD
-
Target vs Actual %
-
CY vs PY %
-
YTD comparisons
This page provides immediate performance visibility.
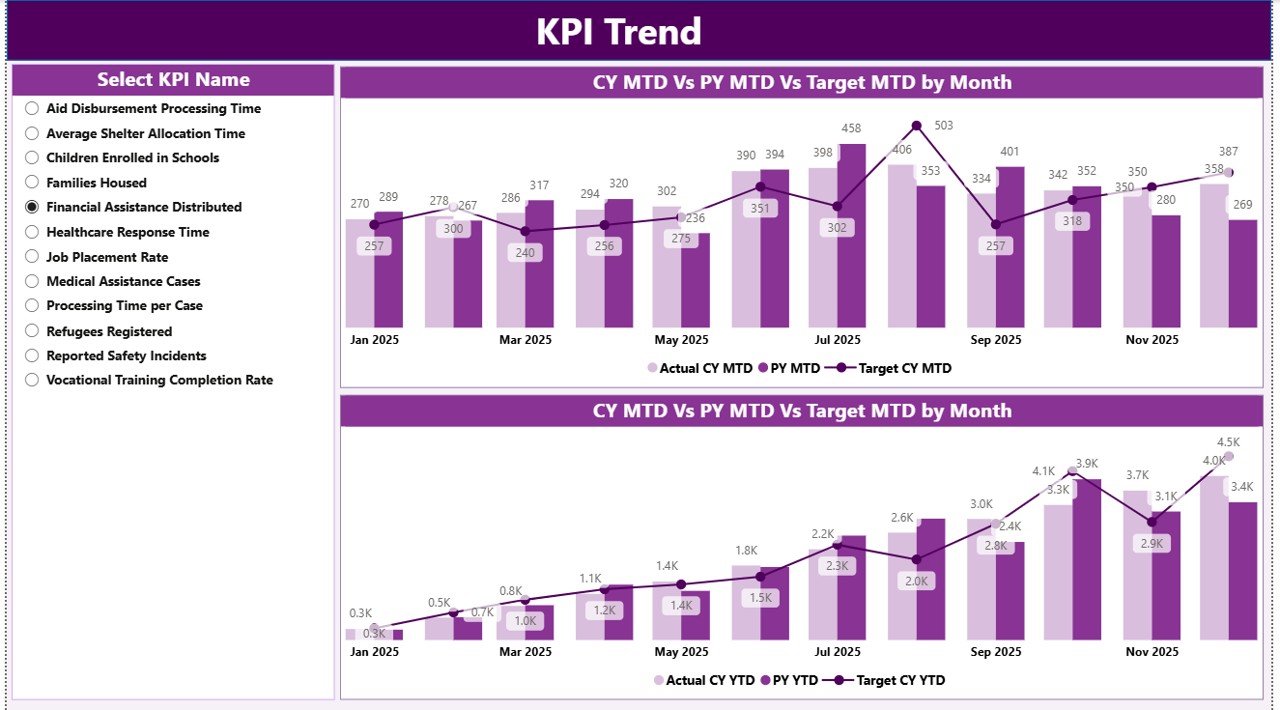
2️⃣ KPI Trend Page – Performance Over Time
✔ KPI Name slicer
✔ MTD Trend Chart (Actual vs Target vs PY)
✔ YTD Trend Chart (Actual vs Target vs PY)
This page helps managers detect:
-
Seasonal patterns
-
Declining trends
-
Improvement progress
-
Long-term performance movement
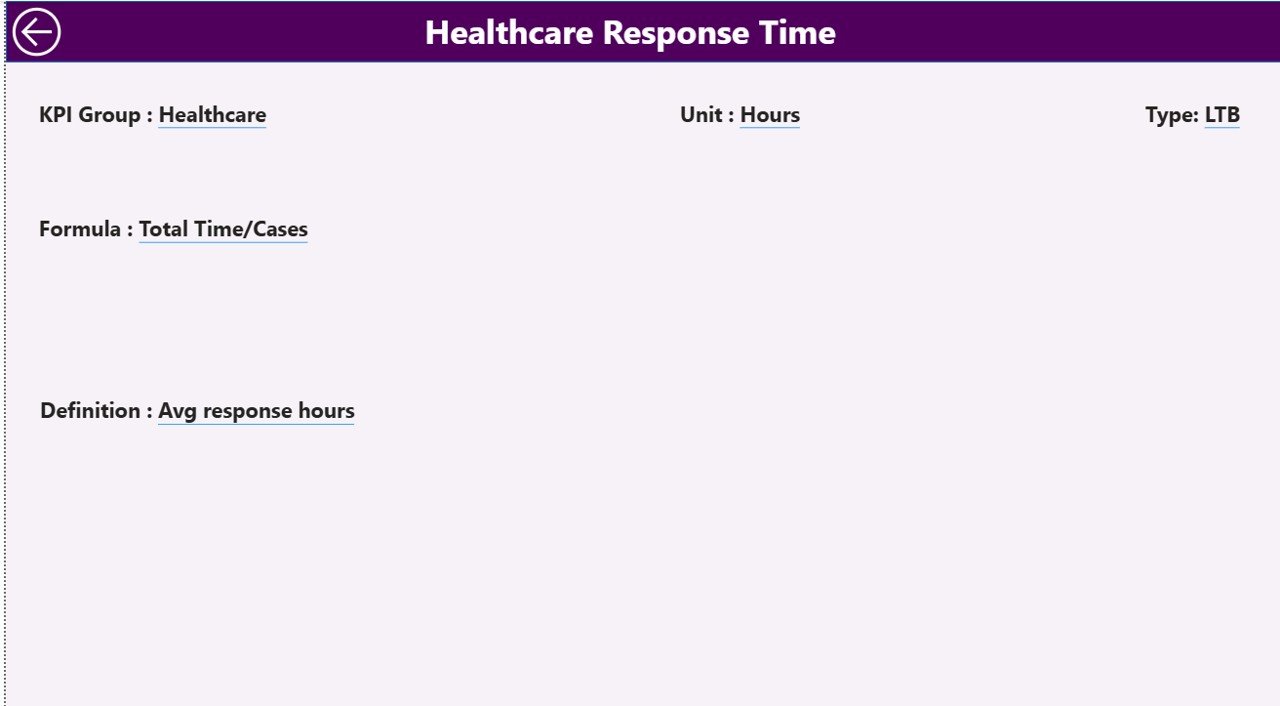
3️⃣ KPI Definition Page – Transparency & Clarity
✔ KPI Formula
✔ KPI Definition
✔ KPI Group
✔ Unit
✔ KPI Type (UTB / LTB)
Ensures all stakeholders understand KPI calculation logic.
🛠 How to Use the Refugee Support KPI Dashboard in Power BI
Getting started is simple:
1️⃣ Update Input_Actual sheet (MTD & YTD numbers)
2️⃣ Update Input_Target sheet (Target values)
3️⃣ Maintain KPI Definition sheet
4️⃣ Refresh Power BI dataset
5️⃣ Use slicers to analyze performance
6️⃣ Drill into trend and definition pages
7️⃣ Take action based on insights
No advanced Power BI skills required — just clean Excel data.
👥 Who Can Benefit from This Refugee Support KPI Dashboard in Power BI
This dashboard is ideal for:
🌍 Humanitarian Organizations
🤝 NGOs & Relief Agencies
🏥 Healthcare Support Programs
🏠 Shelter & Housing Initiatives
📚 Education & Skill Development Projects
🍲 Food Security Programs
💼 Livelihood & Employment Teams
📊 Donor Reporting & Monitoring Units
If your organization tracks structured humanitarian programs, this dashboard becomes essential.
Why This Dashboard Improves Humanitarian Impact
When you track KPIs like:
👥 Beneficiaries Served
🍲 Meals Distributed
🏠 Shelters Provided
🏥 Medical Consultations
📚 School Enrollments
💼 Job Placements
📊 Coverage Rate %
You gain:
✔ Faster decision-making
✔ Early warning detection
✔ Better fund allocation
✔ Stronger donor reporting
✔ Improved accountability
✔ Clear year-over-year impact evidence
This dashboard doesn’t just measure performance — it strengthens program outcomes.
How It Strengthens Transparency
With clear visual indicators and structured comparisons:
-
Target achievement becomes visible
-
Missed KPIs are highlighted immediately
-
Growth trends are measurable
-
Reporting becomes standardized
Transparency builds donor confidence. Confidence builds funding stability.
Click here to read the Detailed blog post
Visit our YouTube channel to learn step-by-step video tutorials
YouTube Channel