Customer loyalty drives sustainable business growth. Yet many organizations still collect customer surveys without clearly understanding what the data actually means. Feedback remains scattered, response delays go unnoticed, and improvement opportunities get missed.
The NPS Dashboard in Google Sheets is a ready-to-use, interactive solution that transforms raw customer feedback into clear Net Promoter Score (NPS) insights, service performance metrics, and actionable trends—all in one centralized dashboard.
Built entirely in Google Sheets, this dashboard helps teams track promoters, passives, and detractors, monitor response and resolution times, and improve customer experience using real-time, data-driven visibility—without expensive BI tools.
🚀 Key Features of NPS Dashboard in Google Sheets
⭐ Centralized NPS Reporting
Track Net Promoter Score, feedback, and service metrics in one place.
📊 Promoter, Passive & Detractor Analysis
Instantly identify customer sentiment distribution.
⏱️ Response Time & Case Resolution Tracking
Monitor service speed and efficiency clearly.
🌍 Multi-Dimensional Analysis
Analyze NPS by region, product, channel, agent, and month.
📈 Trend & Performance Monitoring
Track NPS and service consistency over time.
🔍 Interactive Filters (Slicers)
Filter insights by year, month, region, product, channel, or agent.
☁️ Real-Time Google Sheets Collaboration
Multiple users can view and update data simultaneously.
🔧 Fully Customizable Structure
Easily extend metrics, charts, or pages as your needs grow.
📦 What’s Inside the NPS Dashboard in Google Sheets
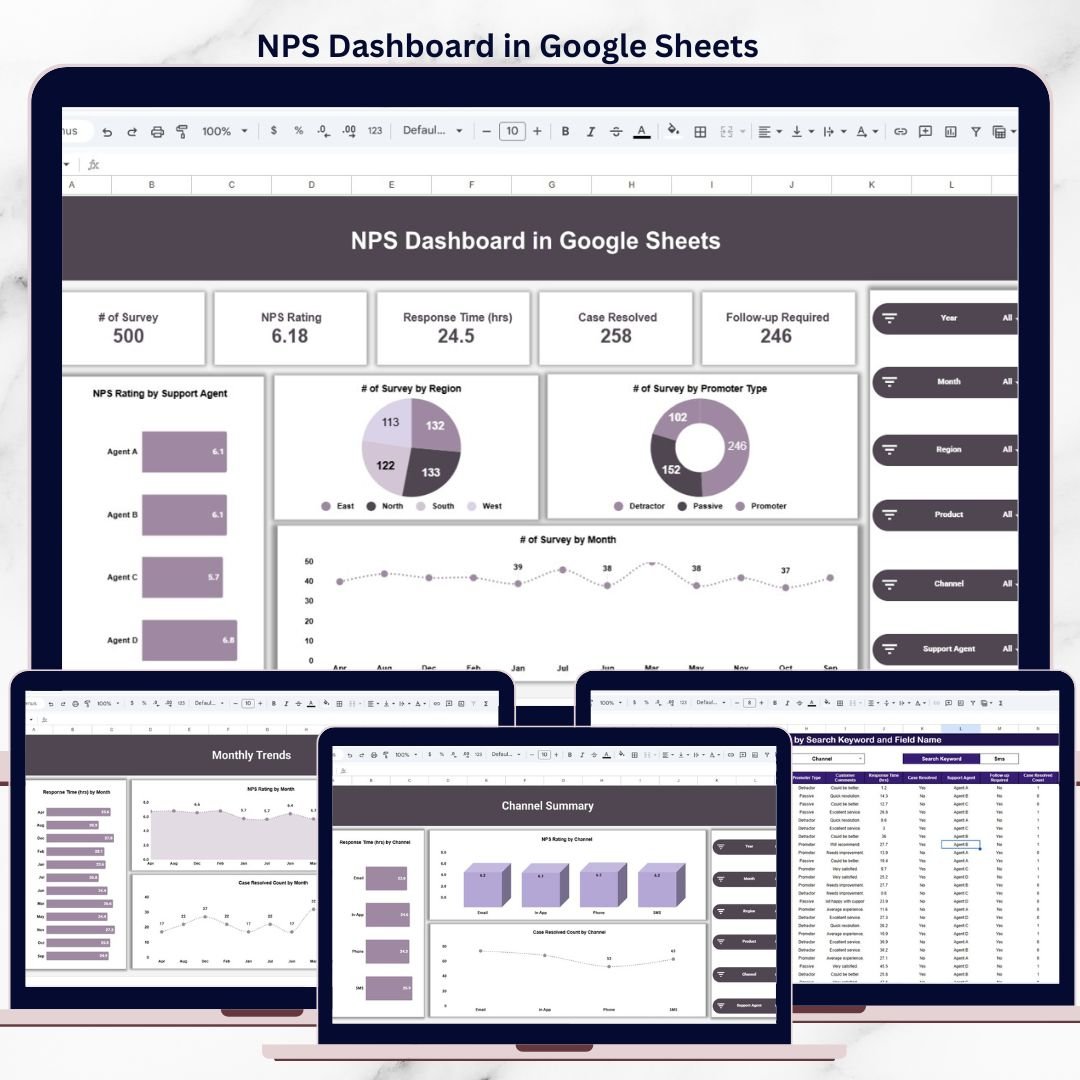
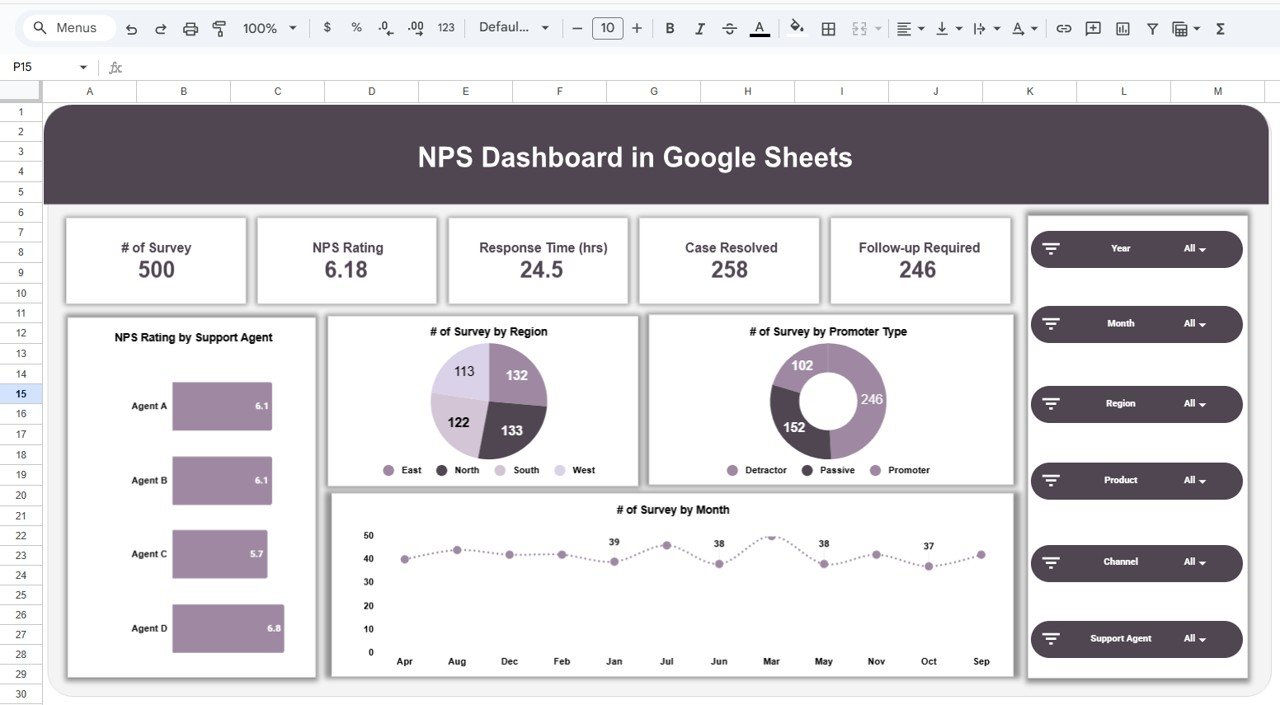
📁 NPS Overview Page
A complete snapshot of customer satisfaction, including:
-
Total Surveys Count
-
Overall NPS Rating
-
Average Response Time
-
Cases Resolved
-
Follow-ups Required
Charts included:
-
NPS Rating by Support Agent
-
Survey Count by Region
-
Survey Count by Promoter Type
-
NPS Trend by Month
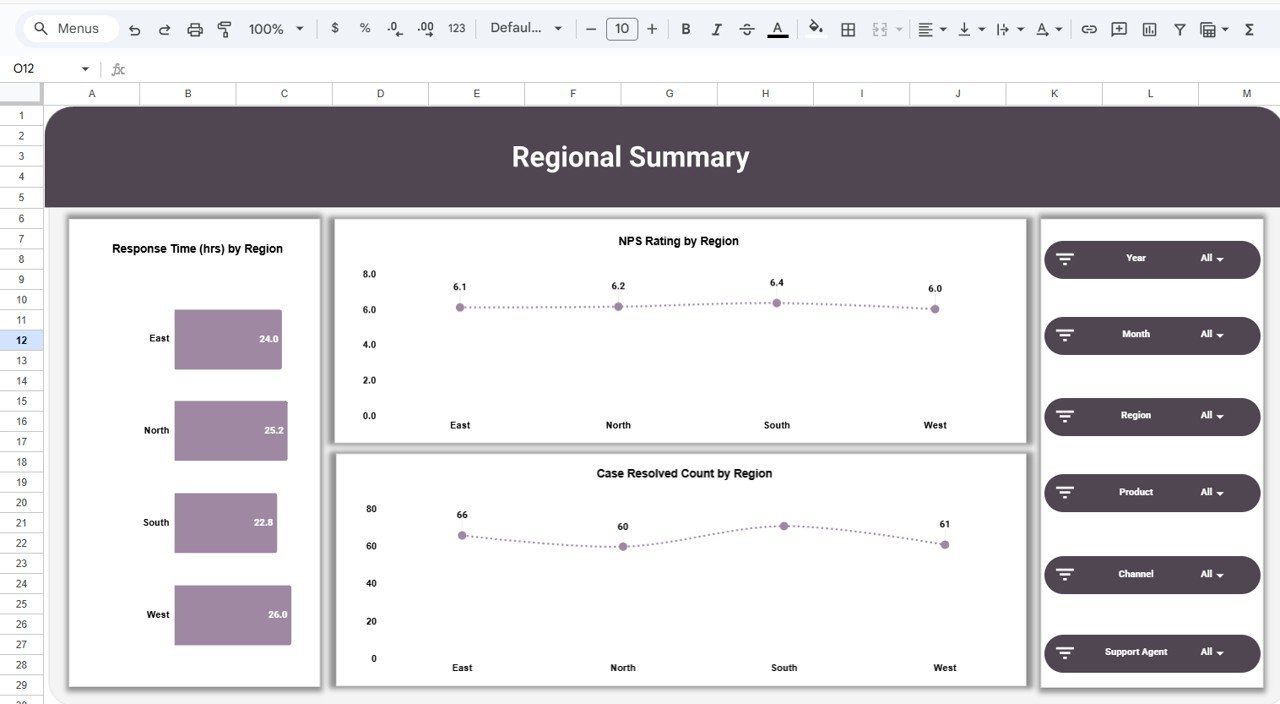
📁 Regional Summary Page
Location-based customer experience insights:
-
Response Time by Region
-
NPS Rating by Region
-
Case Resolved Count by Region
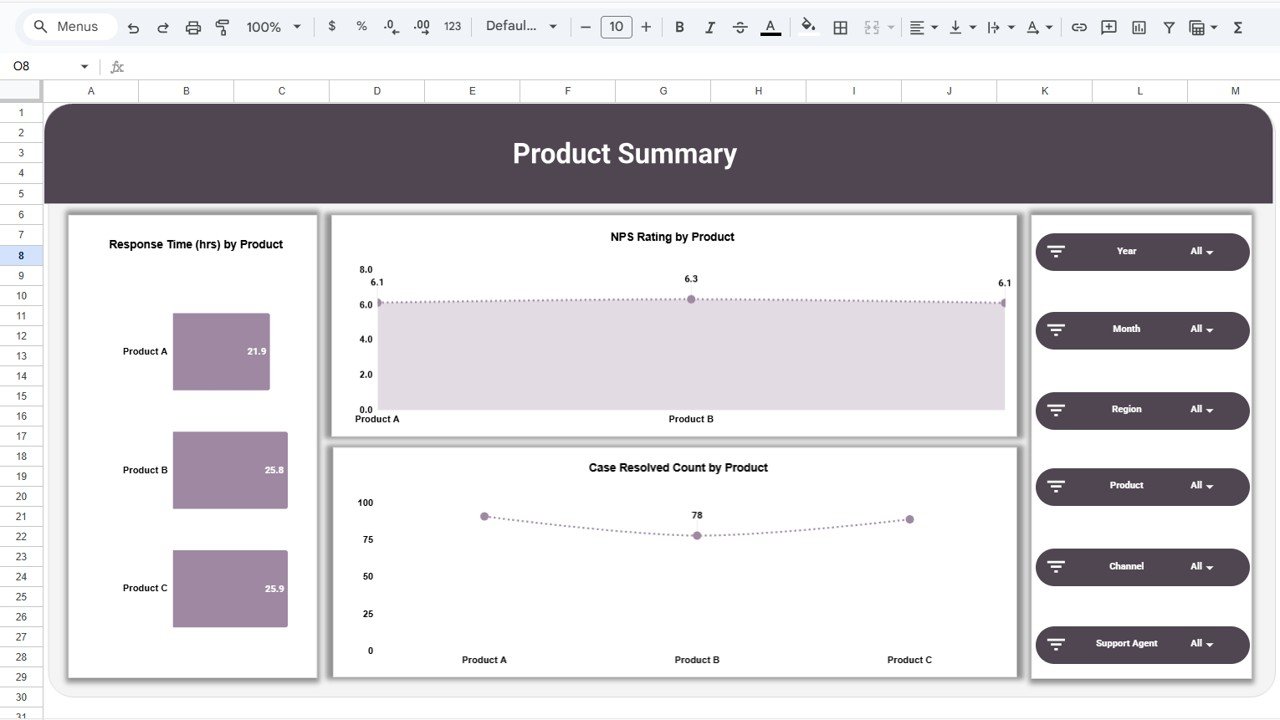
📁 Product Summary Page
Product-level satisfaction analysis:
-
Response Time by Product
-
NPS Rating by Product
-
Case Resolved Count by Product
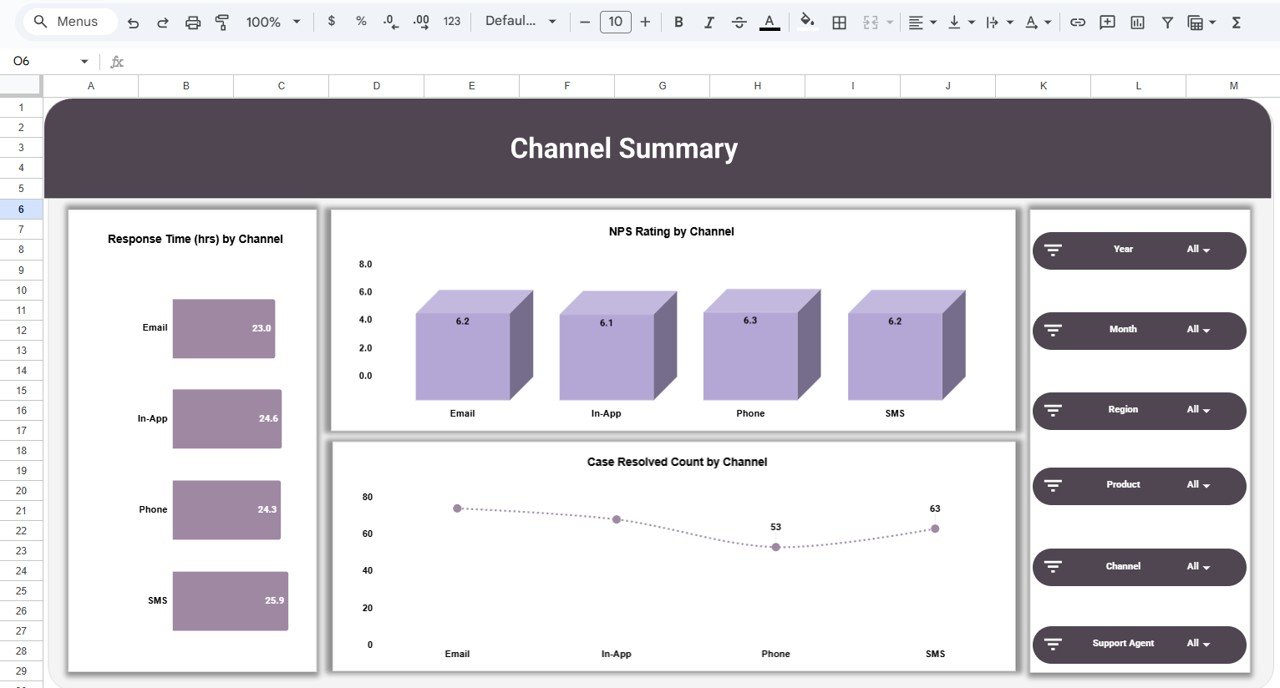
📁 Channel Summary Page
Support channel performance evaluation:
-
Response Time by Channel
-
NPS Rating by Channel
-
Case Resolved Count by Channel
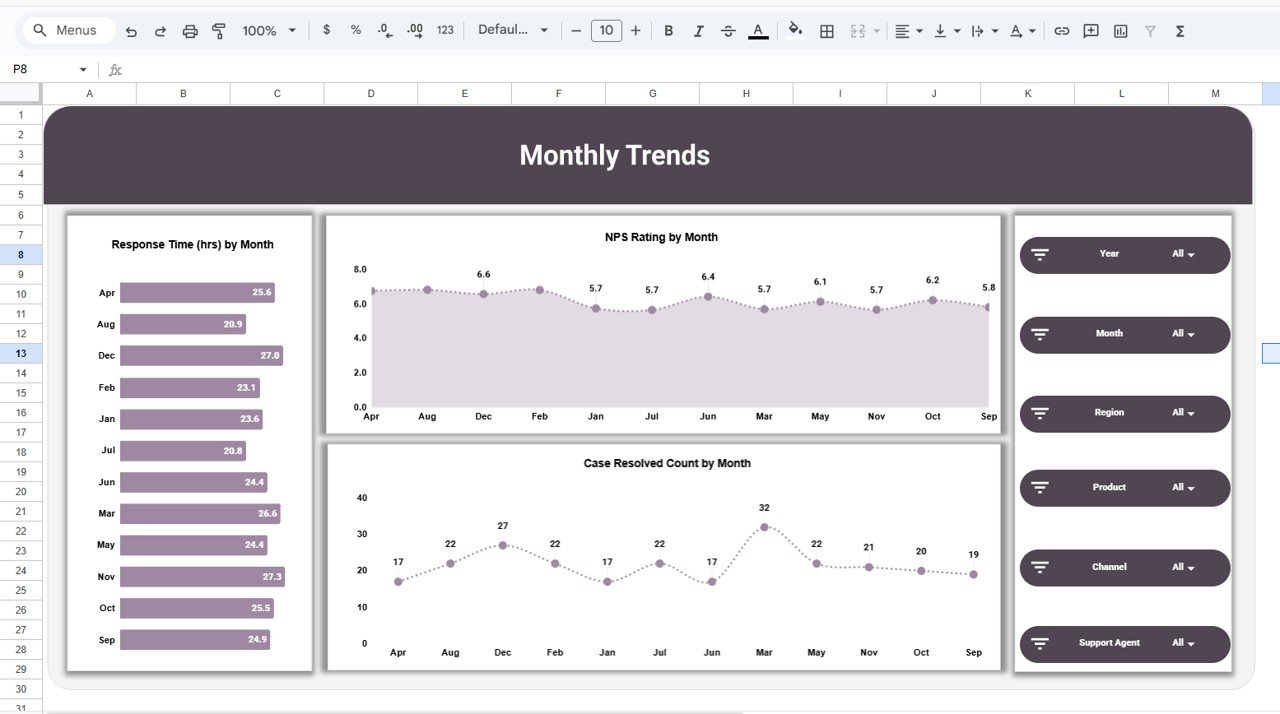
📁 Monthly Trends Page
Time-based performance tracking:
-
Response Time by Month
-
NPS Rating by Month
-
Case Resolved Count by Month
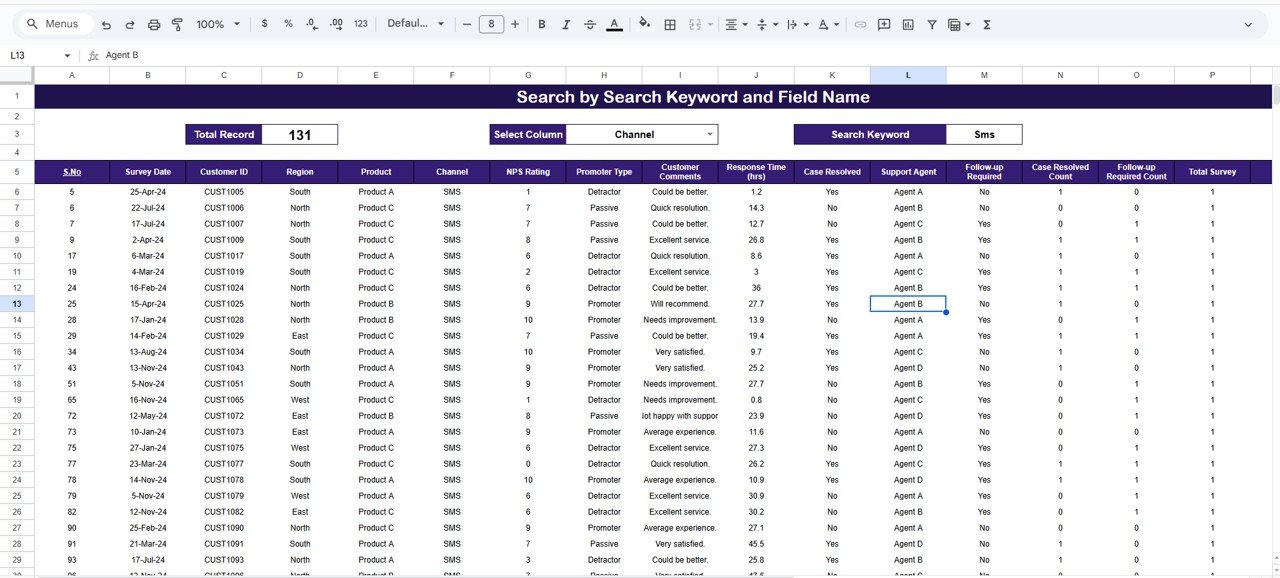
📁 Detailed Data & Search Sheet
Operational-level visibility with:
-
Keyword search across survey records
-
Customer comments & agent details
-
Follow-up and resolution status tracking
🛠️ How to Use the NPS Dashboard
1️⃣ Enter or update survey data in the Data Sheet
2️⃣ Select filters like region, product, channel, or agent
3️⃣ Review NPS score and customer sentiment instantly
4️⃣ Identify detractors and slow response areas
5️⃣ Track follow-ups and unresolved cases
6️⃣ Take faster, data-driven customer experience actions
No formulas. No complex setup. Just update data and analyze.
👥 Who Can Benefit from This NPS Dashboard
🎧 Customer Experience Teams – Track satisfaction drivers clearly
📞 Support Managers – Improve response and resolution speed
📊 Operations Leaders – Monitor service performance at scale
🛍️ Product Managers – Understand product-level feedback
🚀 Startups & SMBs – Professional CX analytics without high cost
🏢 Growing Organizations – Standardize NPS reporting
If customer feedback matters to your business, this dashboard is built for you.
📘 Click here to read the Detailed blog post
Watch the step-by-step video tutorial:


Reviews
There are no reviews yet.