Running a call center is a daily balancing act. Managers handle call volumes, agent performance, service quality, and operational costs, while leadership teams expect quick and accurate performance reports. However, when call data sits across raw Excel sheets, insights remain hidden and reporting becomes slow and manual.
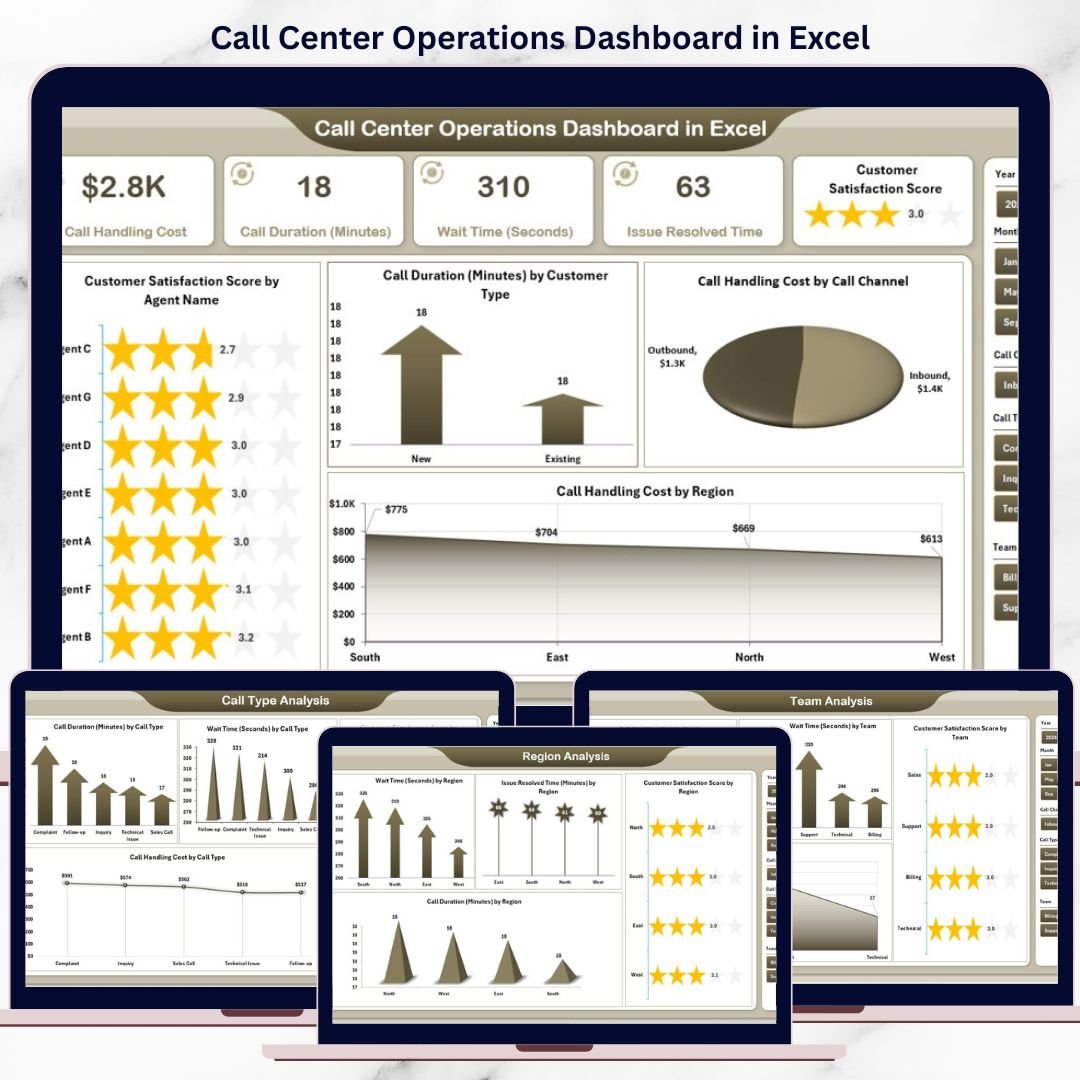
That is exactly why the Call Center Operations Dashboard in Excel becomes an essential performance management tool 🚀. This ready-to-use Excel dashboard converts daily call center data into clear KPIs, interactive charts, and actionable insights. Instead of spending hours preparing reports, managers instantly understand what is working, what is not, and where action is needed.
Designed specifically for call center operations, customer support teams, and service managers, this dashboard helps organizations improve customer satisfaction, control costs, and boost agent productivity—all from a single Excel file.
🔑 Key Features of Call Center Operations Dashboard in Excel
📊 5 Dedicated Analytical Pages for complete call center insights
🧭 Left-Side Page Navigator for smooth and fast navigation
🎯 Right-Side Interactive Slicers for instant filtering
😊 Customer Satisfaction Tracking at agent, team, and region level
💰 Call Handling Cost Analysis for better cost control
⏱️ Call Duration & Wait Time Monitoring for service efficiency
👥 Agent & Team Performance Visibility for targeted coaching
🧩 100% Excel-Based Solution – no macros, no add-ins required
This dashboard delivers clarity, speed, and control to call center operations.
📂 What’s Inside the Call Center Operations Dashboard
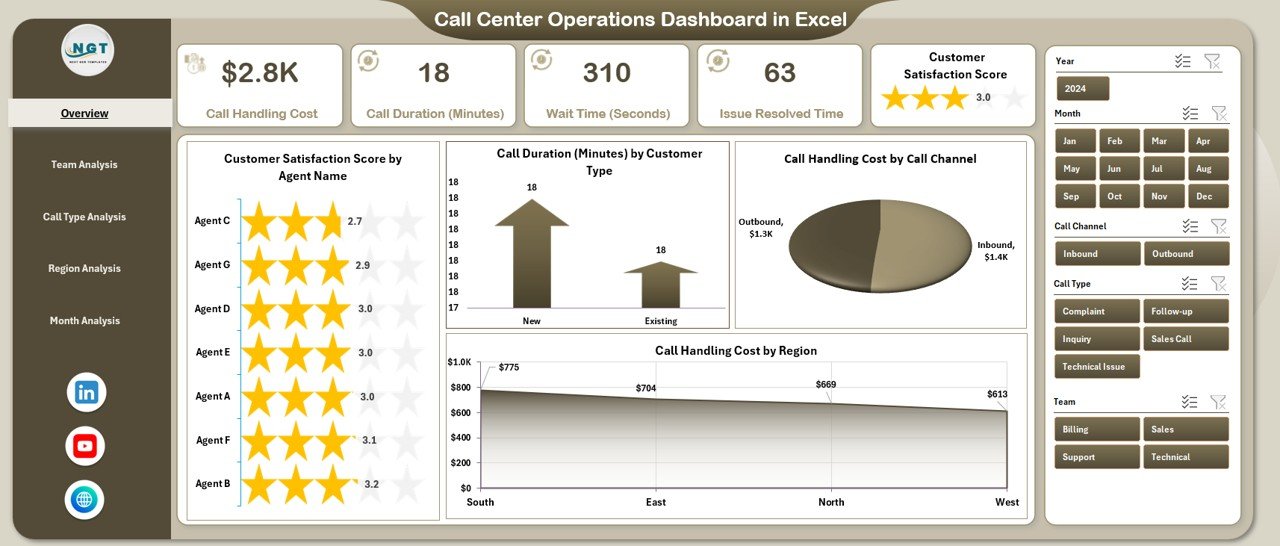
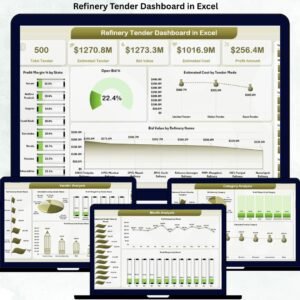
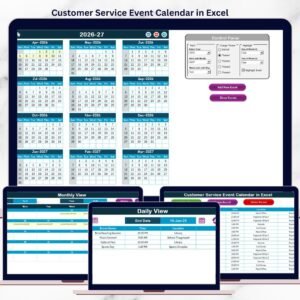
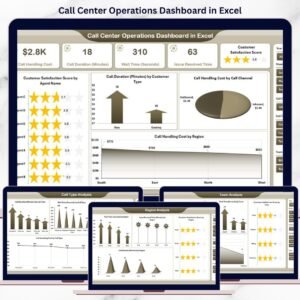
📊 Overview Page
The executive summary of call center performance. It provides a high-level snapshot using:
-
Customer Satisfaction Score by Agent Name
-
Call Duration by Customer Type
-
Call Handling Cost by Call Channel
-
Call Handling Cost by Region
This page helps managers identify performance gaps instantly.
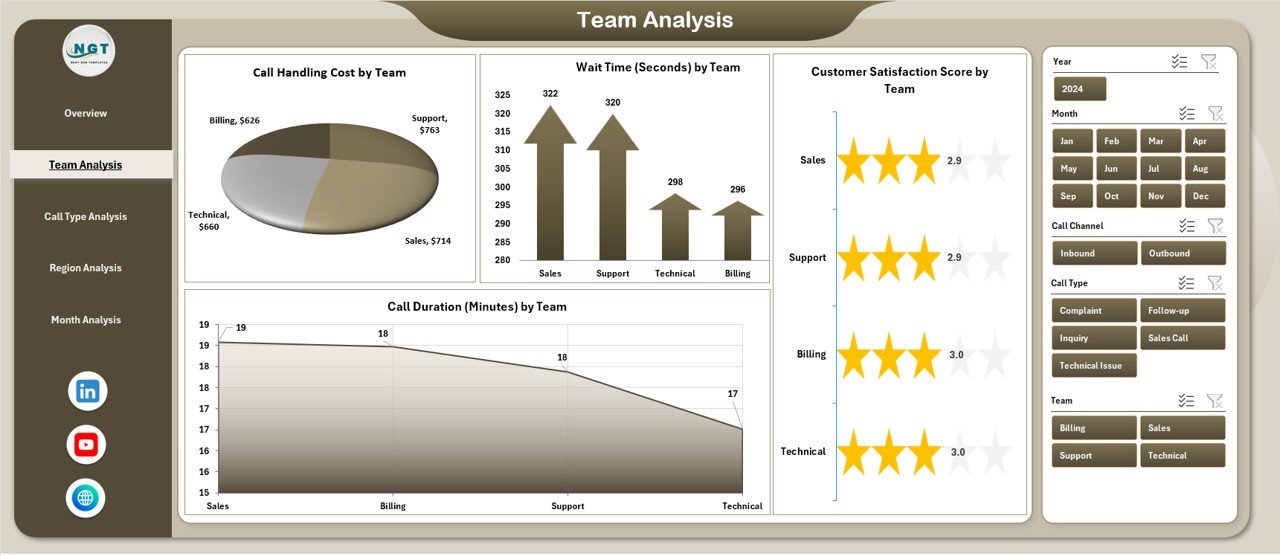
👥 Team Analysis Page
Focuses on team-level performance and efficiency:
-
Customer Satisfaction Score by Team
-
Call Duration by Team
-
Call Handling Cost by Team
Supervisors use this page to compare teams and improve service quality.
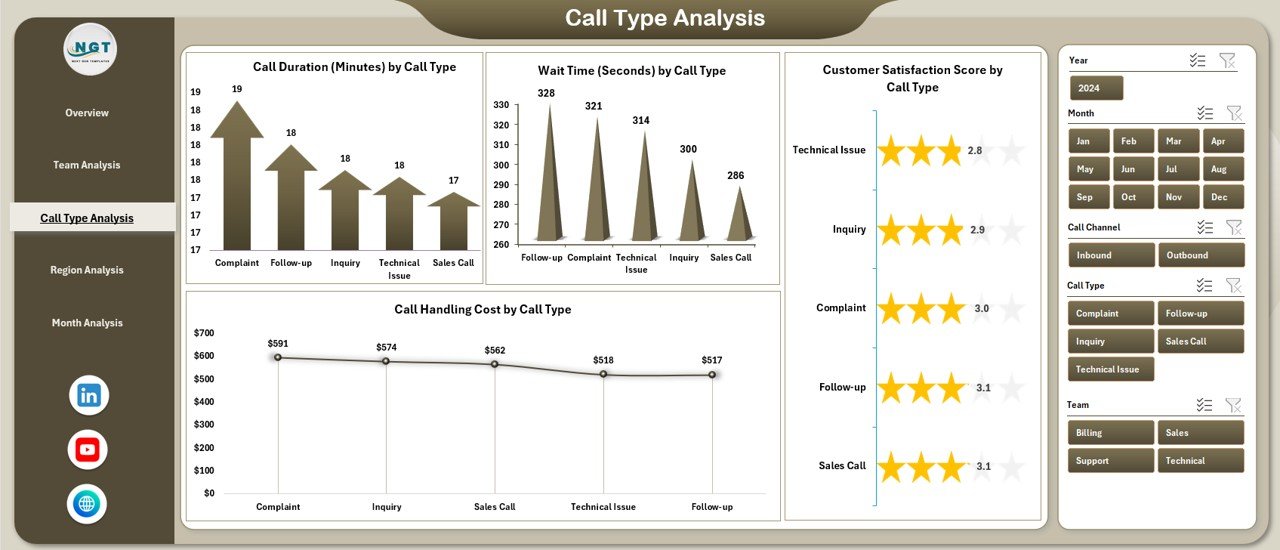
📞 Call Type Analysis Page
Highlights how different call categories impact operations:
-
Customer Satisfaction Score by Call Type
-
Call Duration by Call Type
-
Call Handling Cost by Call Type
-
Wait Time by Call Type
This page helps improve scripts, workflows, and queue management.
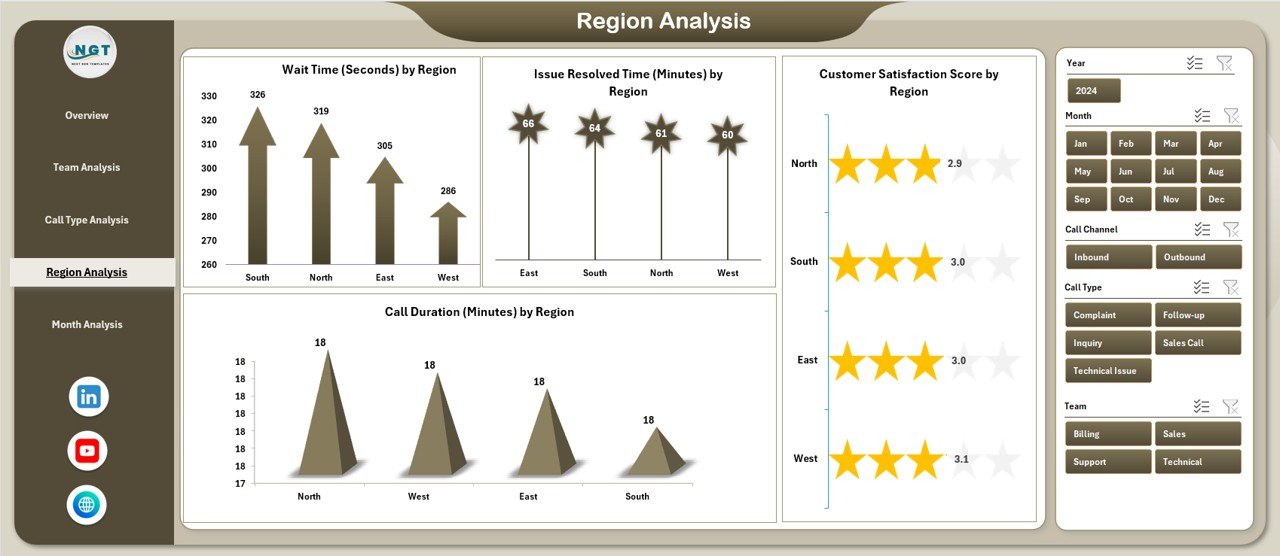
🌍 Region Analysis Page
Provides a geographic view of call center performance:
-
Customer Satisfaction Score by Region
-
Call Duration by Region
-
Call Handling Cost by Region
-
Issue Resolved Time by Region
Leadership teams make region-specific decisions using these insights.
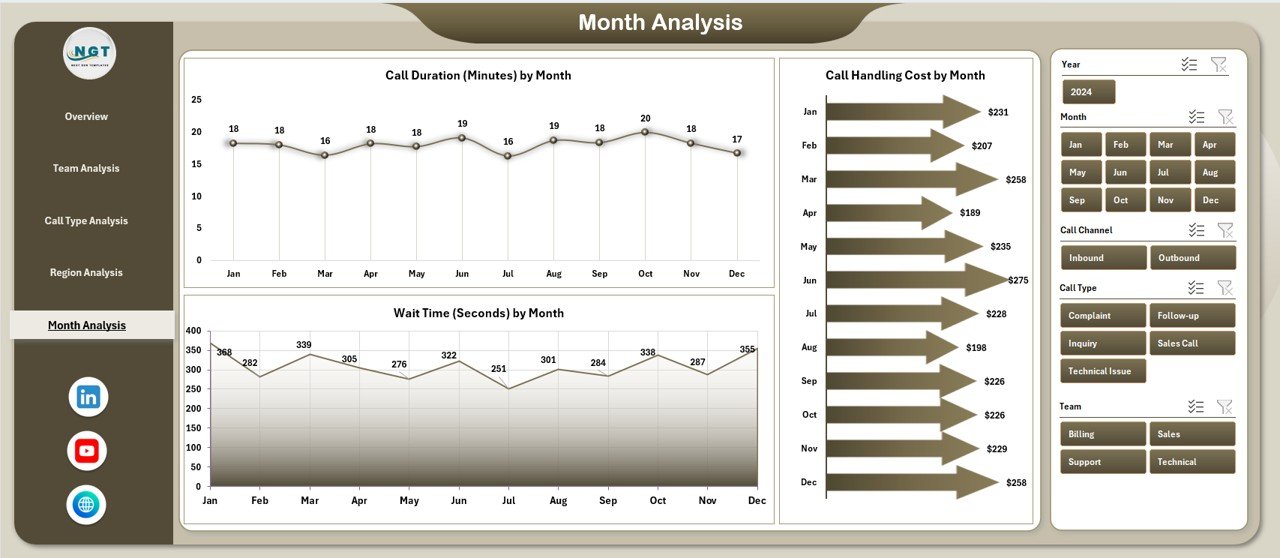
📆 Month Analysis Page
Tracks performance trends and seasonality over time:
-
Call Duration by Month
-
Call Handling Cost by Month
-
Wait Time by Month
This page supports staffing plans and budget forecasting.
🛠️ How to Use the Call Center Operations Dashboard in Excel
✅ Update call data in the Data Sheet
✅ Refresh pivot tables with one click
✅ Use slicers to filter by agent, team, call type, region, or month
✅ Navigate pages using the page navigator
✅ Analyze trends and take action
No advanced Excel skills are required. The dashboard is simple, intuitive, and business-ready.
👥 Who Can Benefit from This Call Center Operations Dashboard?
📞 Call Center Managers
👥 Team Leaders & Supervisors
📊 Operations Heads
💼 Business Analysts
🎧 Quality Assurance Teams
😊 Customer Experience Managers
Whether managing small support teams or large call centers, this dashboard adapts easily.
👉 Click here to read the Detailed blog post
▶️ Visit our YouTube channel to learn step-by-step video tutorials
https://youtube.com/@PKAnExcelExpert


Reviews
There are no reviews yet.