Resource allocation directly impacts project delivery, operational efficiency, and employee well-being. When teams are overutilized, burnout increases. When resources remain idle, costs rise. However, many organizations still rely on scattered spreadsheets, delayed reports, or manual calculations to manage resource allocation. As a result, leaders struggle to balance workloads, control costs, and plan effectively.
That is exactly why a Resource Allocation KPI Dashboard in Google Sheets becomes an essential performance management tool.
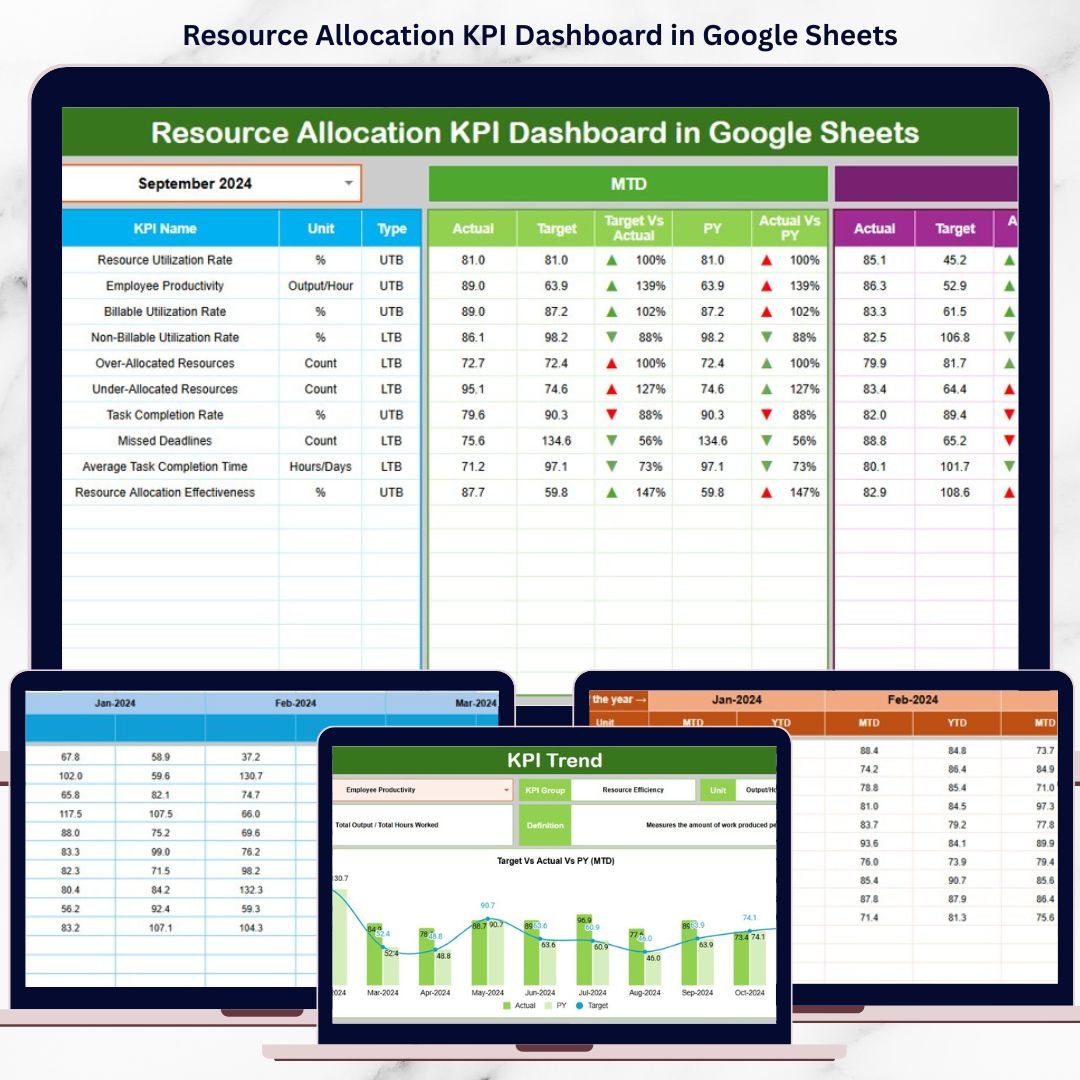
This ready-to-use dashboard provides a structured and centralized system to track how effectively resources are allocated across projects, departments, and time periods. Instead of guessing utilization levels, organizations gain real-time visibility into MTD and YTD performance, target achievement, historical trends, and improvement areas—all presented through clear KPIs and visual indicators.
Because the dashboard is built in Google Sheets, it remains easy to use, collaborative, and accessible from anywhere without the need for expensive BI tools.
🚀 Key Features of the Resource Allocation KPI Dashboard
📌 Centralized Resource Performance Tracking
Monitor all resource allocation KPIs from a single dashboard.
⚖️ Balanced Workload Visibility
Identify overutilized and underutilized resources quickly.
🎯 Target vs Actual Comparison
Measure allocation efficiency against planned targets.
📅 MTD & YTD Performance Insights
Track short-term execution and long-term allocation trends.
📊 Visual Performance Indicators
Instantly spot improvement or decline using conditional arrows.
🔍 KPI Trend Analysis
Understand how resource utilization changes over time.
📦 What’s Inside the Resource Allocation KPI Dashboard
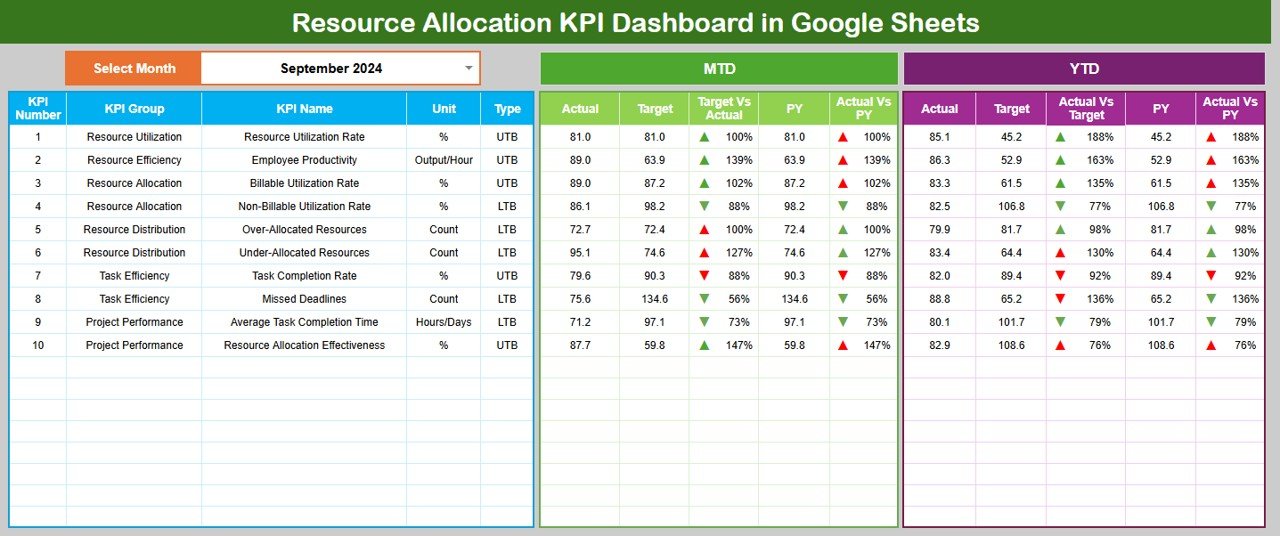
🗂️ Dashboard Sheet Tab – Main KPI View
The Dashboard Sheet acts as the executive summary for resource allocation performance.
🔄 Month Selection
Select the desired month from Cell D3, and the entire dashboard updates automatically.
📅 MTD KPIs Displayed
For each KPI, the dashboard shows:
-
MTD Actual
-
MTD Target
-
MTD Previous Year
-
Target vs Actual (%)
-
Previous Year vs Actual (%)
Directional arrows clearly highlight whether performance is improving or declining.
📈 YTD KPIs Displayed
The dashboard also tracks:
-
YTD Actual
-
YTD Target
-
YTD Previous Year
-
Target vs Actual (%)
-
Previous Year vs Actual (%)
This helps leadership plan capacity and staffing strategically.
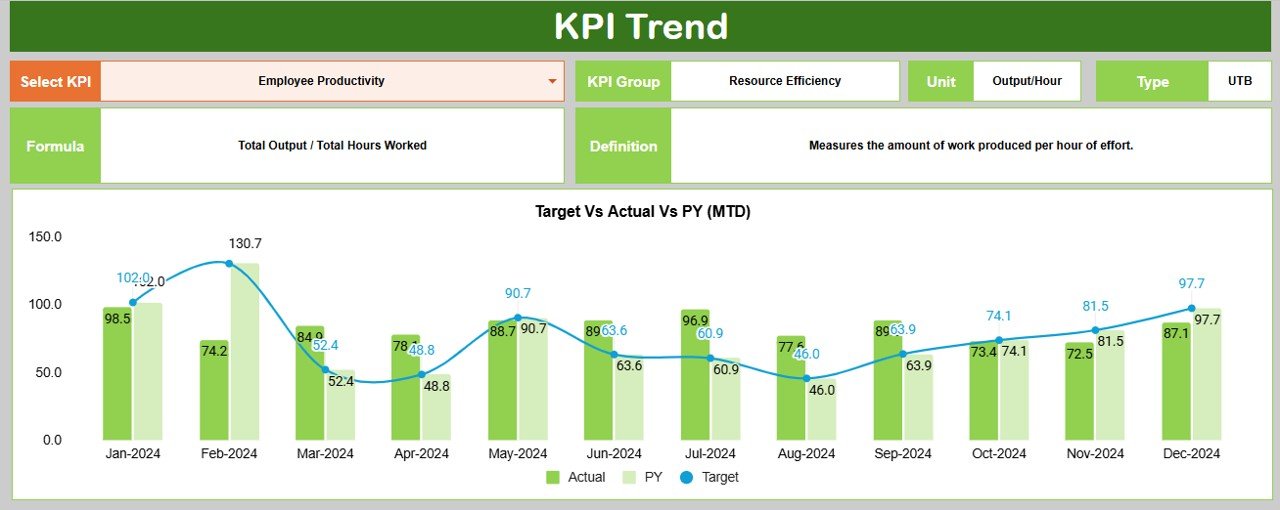
📊 KPI Trend Sheet Tab – KPI Deep Dive
The KPI Trend Sheet enables detailed KPI analysis.
🔎 How It Works
Select a KPI name from the dropdown in Cell C3, and the sheet dynamically updates.
📌 Displayed KPI Details
-
KPI Group
-
KPI Unit
-
KPI Type (Upper the Better / Lower the Better)
-
KPI Formula
-
KPI Definition
This sheet ensures transparency and a clear understanding of how each KPI is calculated.
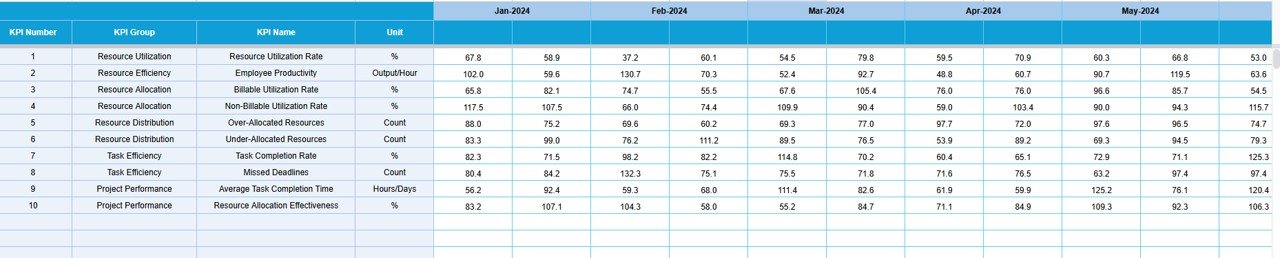
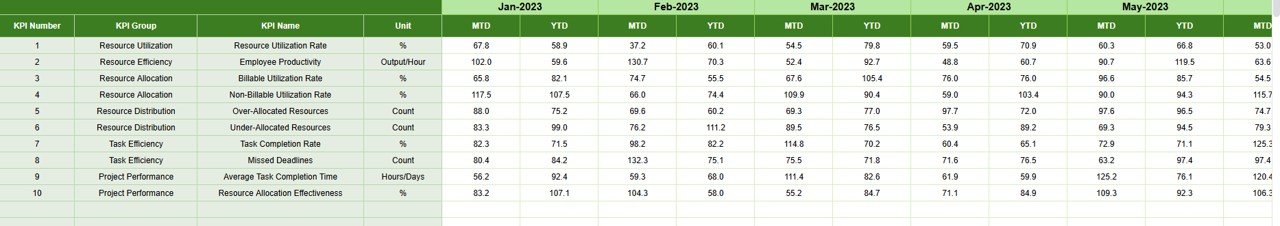
🧮 Actual Number Sheet Tab
This sheet stores actual allocation performance data.
🛠️ How to Use
-
Enter the first month of the year in Cell E1
-
Input MTD Actual and YTD Actual values
All KPIs and charts update automatically, ensuring accurate reporting.
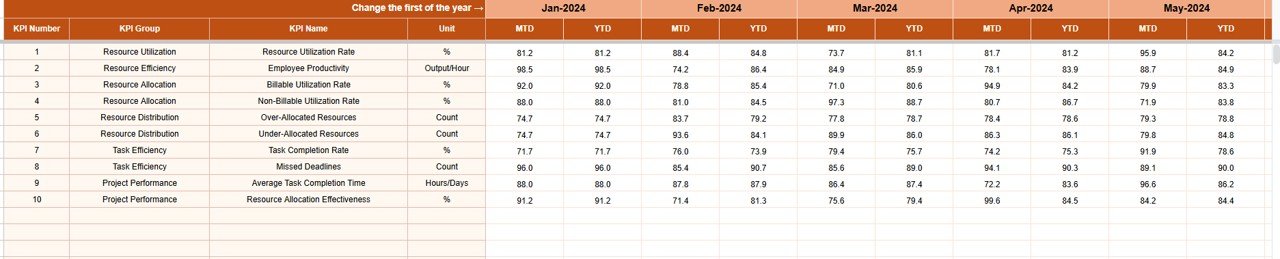
🎯 Target Sheet Tab
The Target Sheet defines expected allocation performance.
📥 Data Entry
-
Enter MTD Target values
-
Enter cumulative YTD Target values
Targets allow objective performance evaluation and accountability.
📆 Previous Year Number Sheet Tab
This sheet enables year-over-year analysis.
🎯 Purpose
-
Enter previous year MTD and YTD values
-
Identify recurring allocation issues
-
Measure improvement trends
Historical comparison supports better forecasting and planning.
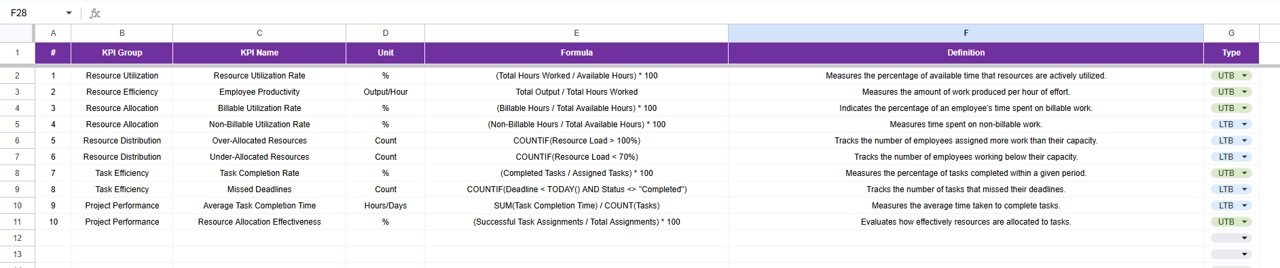
📚 KPI Definition Sheet Tab – KPI Master Library
This sheet acts as the single source of truth for all KPIs.
📋 Fields Included
-
KPI Name
-
KPI Group
-
Unit
-
Formula
-
Definition
-
KPI Type
🎯 Who Can Benefit from This Resource Allocation KPI Dashboard
-
📋 Project Managers & PMOs
-
🧑💼 HR & Workforce Planning Teams
-
🏢 Operations Managers
-
📊 Finance & Strategy Teams
-
🚀 Growing Organizations Across All Industries
🛠️ How to Use the Resource Allocation KPI Dashboard
-
Enter actual allocation data monthly
-
Define realistic targets
-
Review MTD and YTD KPIs regularly
-
Analyze trends using the KPI Trend Sheet
-
Act quickly on over- or under-utilization
Consistent usage improves planning accuracy and productivity.
🔗 ### Click here to read the Detailed blog post
Watch the step-by-step video tutorial:
▶️ Visit our YouTube channel to learn step-by-step video tutorials
👉 Youtube.com/@NeotechNavigators


Reviews
There are no reviews yet.