Renewable Resource KPI Dashboard resources is no longer a choice—it is a business, regulatory, and sustainability necessity. Organizations must track performance, meet targets, and report progress accurately across solar, wind, hydro, biomass, and energy efficiency initiatives. However, when data remains scattered across Excel files and manual reports, insights arrive late and sustainability goals suffer.
That is exactly why the Renewable Resource KPI Dashboard Power BI becomes a powerful, structured, and decision-ready analytics solution.
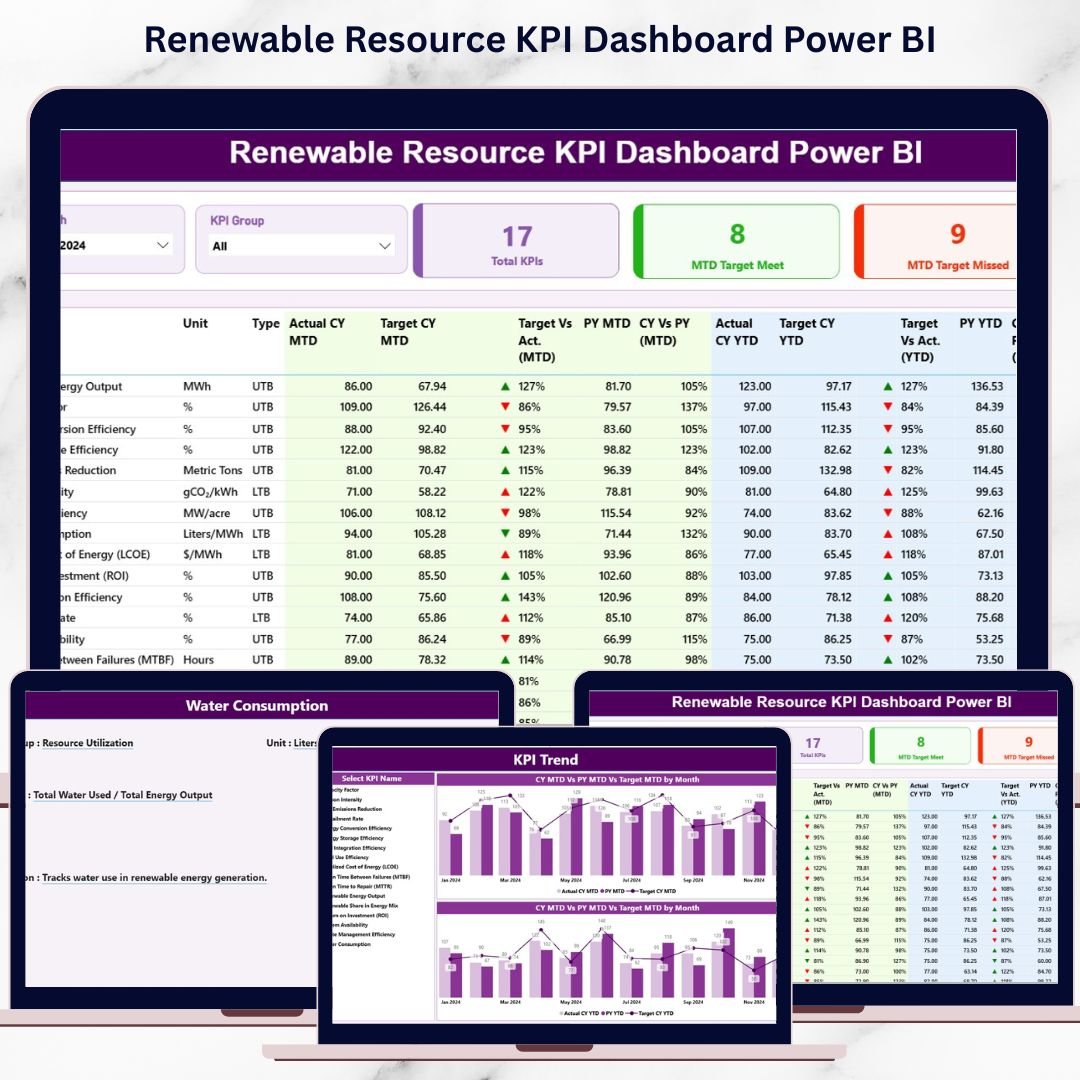
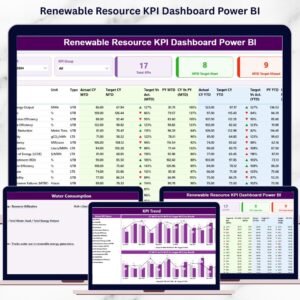
This ready-to-use Power BI dashboard converts raw renewable resource data into clear KPIs, performance indicators, trend analysis, and target comparisons—all in one centralized view. Instead of preparing repetitive reports, sustainability teams and leadership gain instant clarity on where performance stands and where action is required.
Built with Excel as the data source and Power BI as the visualization engine, this dashboard offers the perfect balance of simplicity, flexibility, and analytical depth for renewable resource performance management.
🔑 Key Features of Renewable Resource KPI Dashboard Power BI
🌱 Centralized Renewable KPI Monitoring
Track all renewable resource KPIs in one interactive Power BI dashboard.
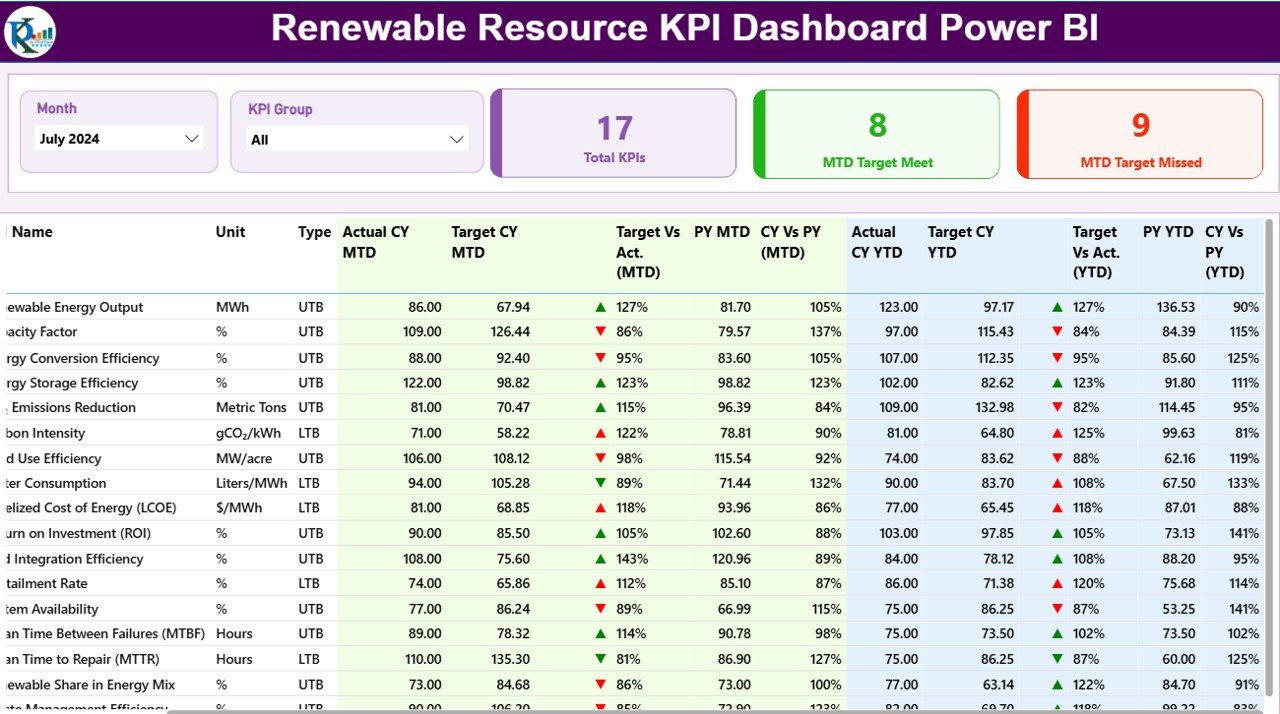
🎯 Target vs Actual Performance Tracking
Instantly identify KPIs meeting or missing targets using visual indicators.
📊 MTD & YTD Performance Visibility
Monitor Month-to-Date and Year-to-Date progress side by side.
🔄 Current Year vs Previous Year Comparison
Evaluate improvement or decline using CY vs PY performance metrics.
📋 Detailed KPI Table with Status Icons
View KPI group, unit, type (LTB/UTB), percentages, and performance icons clearly.
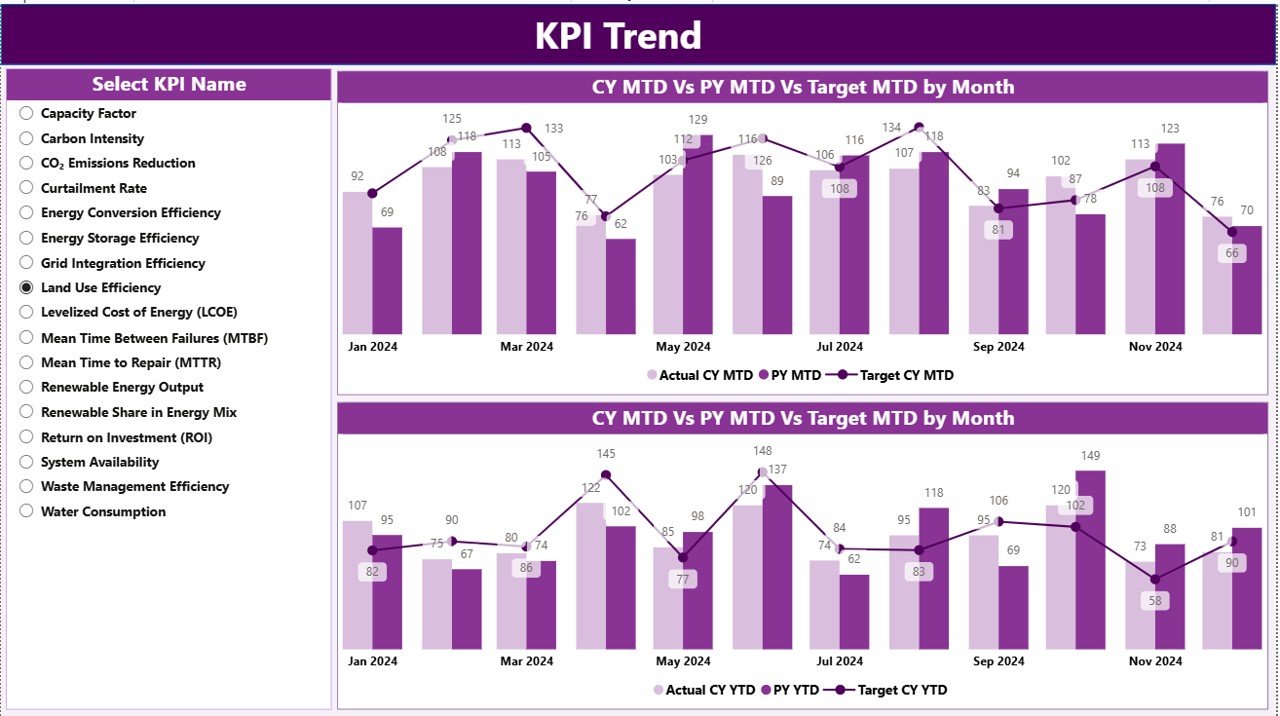
📈 Trend Analysis with Combo Charts
Understand renewable performance patterns over time.
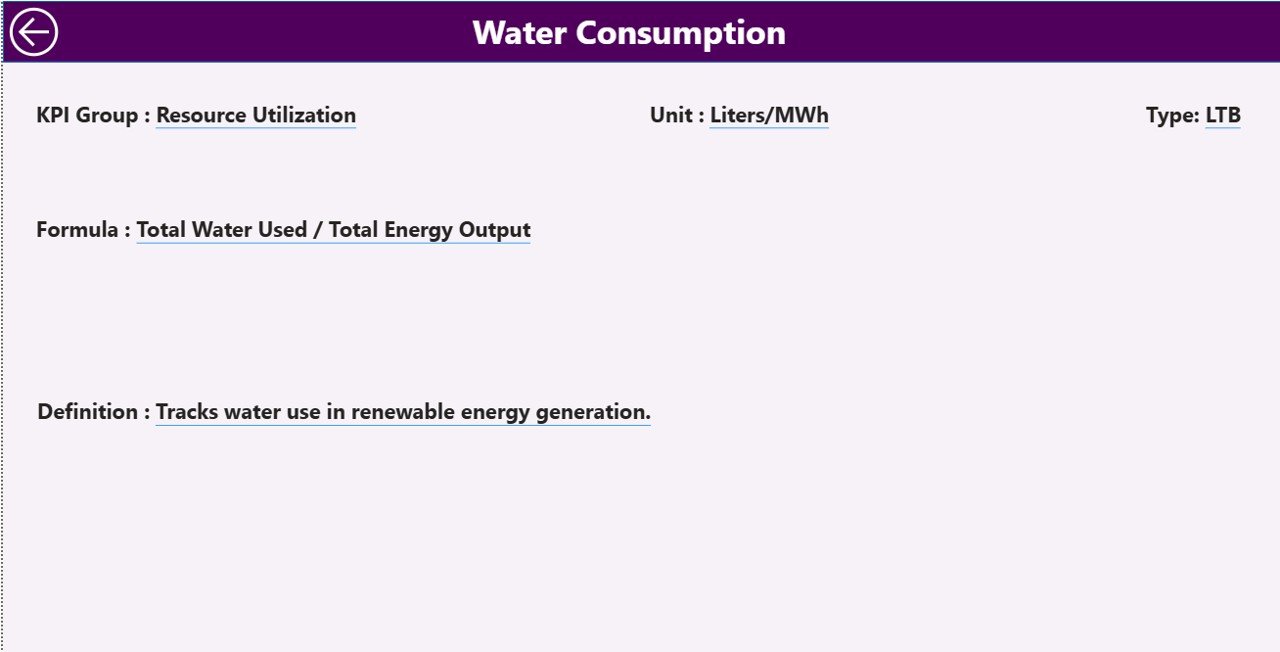
📘 Built-In KPI Definition & Governance
Drill through to KPI formulas and definitions for transparency and consistency.
⚡ Excel-Based Data Maintenance
Update data easily in Excel and refresh Power BI instantly.
📂 What’s Inside the Renewable Resource KPI Dashboard Power BI
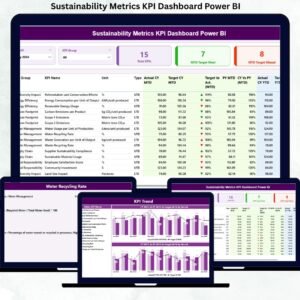
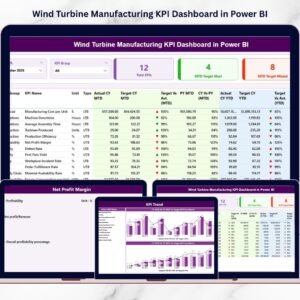
📁 Summary Page – KPI overview with slicers, cards, icons, and a detailed KPI table
📁 KPI Trend Page – MTD and YTD trend analysis using combo charts
📁 KPI Definition Page – Drill-through reference page explaining KPI logic
📊 Excel Data Source Structure
• Input_Actual Sheet – Actual MTD & YTD performance values
• Input_Target Sheet – Target MTD & YTD values
• KPI Definition Sheet – KPI master data, formulas, and definitions
Together, these components deliver a complete renewable resource performance tracking system.
🛠️ How to Use the Renewable Resource KPI Dashboard Power BI
1️⃣ Enter actual renewable KPI values in the Input_Actual Excel sheet
2️⃣ Maintain target values in the Input_Target sheet
3️⃣ Define KPIs clearly in the KPI Definition sheet
4️⃣ Refresh the Power BI dashboard
5️⃣ Use Month and KPI Group slicers for focused analysis
6️⃣ Review KPI cards and tables on the Summary Page
7️⃣ Analyze trends and drill into KPI definitions when needed
No advanced Power BI expertise is required. The dashboard is designed for easy adoption by sustainability and energy teams.
👥 Who Can Benefit from This Renewable Resource KPI Dashboard Power BI
🌞 Renewable energy companies
🌿 Sustainability and ESG teams
📊 Energy analysts and planners
⚡ Utility and power generation companies
🏛️ Government and regulatory bodies
🏢 Corporate sustainability managers
If your organization tracks renewable energy or sustainability KPIs, this dashboard delivers immediate value.
📘 Click here to read the Detailed blog post
🎥 Visit our YouTube channel to learn step-by-step video tutorials
👉 YouTube Channel


Reviews
There are no reviews yet.